. 2013 Sep 16;2(1):14.
doi: 10.1186/2046-2395-2-14.

Life-long spontaneous exercise does not prolong lifespan but improves health span in mice

Affiliations

Life-long spontaneous exercise does not prolong lifespan but improves health span in mice

Rebeca Garcia-Valles et al. Longev Healthspan. .

Abstract

Background: Life expectancy at birth in the first world has increased from 35 years at the beginning of the 20th century to more than 80 years now. The increase in life expectancy has resulted in an increase in age-related diseases and larger numbers of frail and dependent people. The aim of our study was to determine whether life-long spontaneous aerobic exercise affects lifespan and healthspan in mice.

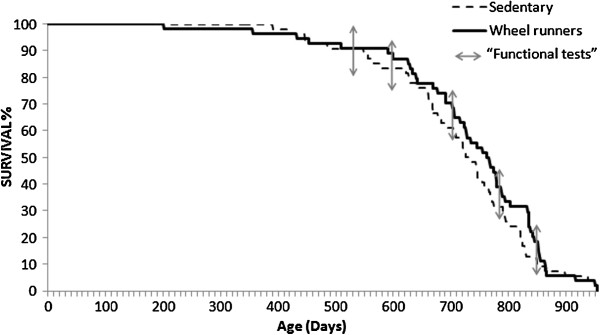
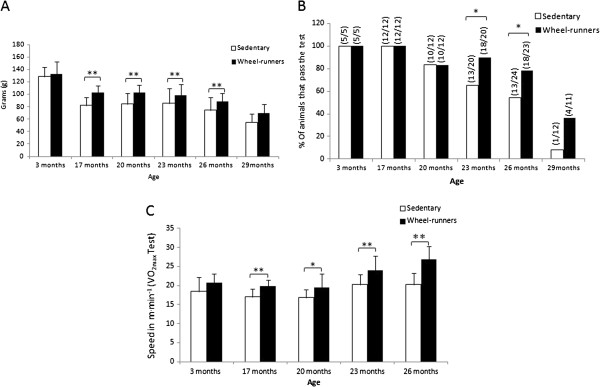
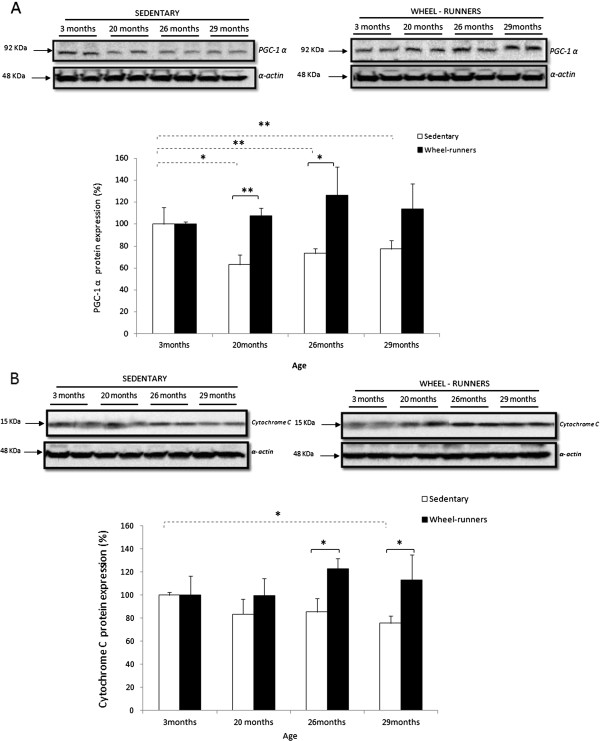
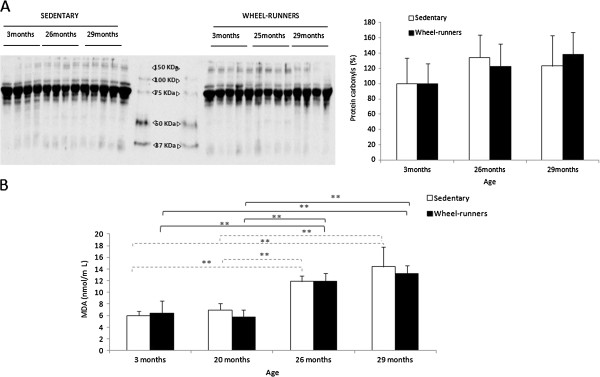
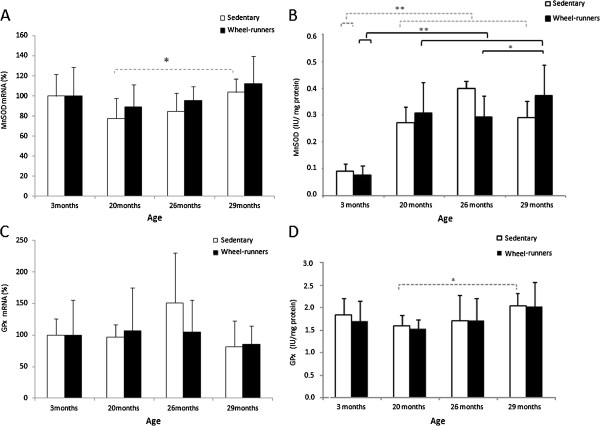
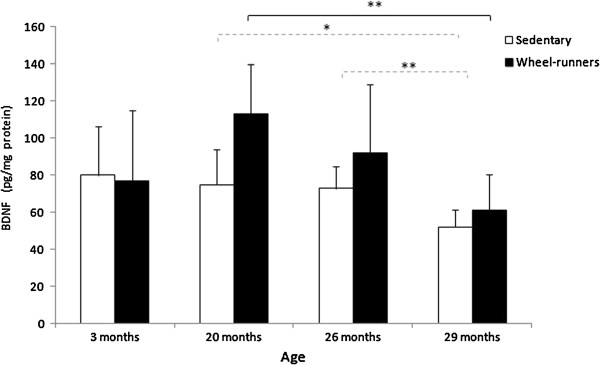
Results: Male C57Bl/6J mice, individually caged, were randomly assigned to one of two groups: sedentary (n = 72) or spontaneous wheel-runners (n = 72). We evaluated longevity and several health parameters including grip strength, motor coordination, exercise capacity (VO2max) and skeletal muscle mitochondrial biogenesis. We also measured the cortical levels of the brain-derived neurotrophic factor (BDNF), a neurotrophin associated with brain plasticity. In addition, we measured systemic oxidative stress (malondialdehyde and protein carbonyl plasma levels) and the expression and activity of two genes involved in antioxidant defense in the liver (that is, glutathione peroxidase (GPx) and manganese superoxide dismutase (Mn-SOD)). Genes that encode antioxidant enzymes are considered longevity genes because their over-expression may modulate lifespan. Aging was associated with an increase in oxidative stress biomarkers and in the activity of the antioxidant enzymes, GPx and Mn-SOD, in the liver in mice. Life-long spontaneous exercise did not prolong longevity but prevented several signs of frailty (that is, decrease in strength, endurance and motor coordination). This improvement was accompanied by a significant increase in the mitochondrial biogenesis in skeletal muscle and in the cortical BDNF levels.

Conclusion: Life-long spontaneous exercise does not prolong lifespan but improves healthspan in mice. Exercise is an intervention that delays age-associated frailty, enhances function and can be translated into the clinic.


Figures

Figure 1
Figure 1
Survival curves of cohorts of sedentary (n = 72) and spontaneous wheel-running mice (n = 72). The Kaplan-Meier representation of the two groups is shown. The median lifespan of the sedentary group was 750 days and it was 770 days in the wheel-runners. Maximal lifespan in both groups was 950 days. The functional tests were performed at different survival time points (3, 17, 20, 23, 26, and 29 months old) as shown by arrows in the longevity curve.
Figure 2
Figure 2
Functional tests performed at different survival time points (3, 17, 20, 23, 26 and 29 months old) in the longevity curve. A) shows the mouse grip strength values in grams. All the available animals were tested at the different ages. B) shows motor coordination. It was determined as the percentage of animals that successfully passed the tightrope test. The fraction of mice passing the test is indicated above the bars. The number of animals tested (n = 12 to 24) varied at the different ages. C) shows the maximal running speed achieved in a VO2max test and that was considered the maximal aerobic workload capacity of the animal (n = 20). Values are shown as mean ± SD. (*) indicates P <0.05, (**) indicates P <0.01 versus the sedentary group at the different ages. Continuous lines show statistically significant differences between the sedentary and the wheel-running groups. VO2max, exercise capacity.
Figure 3
Figure 3
Exercise-induced activation of the mitochondrial biogenesis pathway in mice skeletal muscle during aging. Western blotting analysis to detect (A) Peroxisome Proliferator-Activated Receptor-γ Coactivator 1α (PGC-1α) and (B) cytochrome C at different survival time points. Representative blots are shown. For the densitometric analysis of the results, values are shown as mean (± SD). The content of α-actin, a housekeeping protein marker in skeletal muscle, was determined in all the experimental groups. (*) indicates P <0.05, (**) indicates P <0.01 versus the sedentary group at different ages. Values were normalized to those observed in the samples obtained from the three-month-old group, which was assigned a value of 100%. Continuous lines show statistically significant differences between the sedentary and the wheel-running groups. The discontinuous lines show statistically significant differences between the periods studied in the sedentary group.
Figure 4
Figure 4
Plasma oxidative stress biomarkers at different survival time points (3, 20, 26 and 29 months old) in the longevity curve. A) shows a representative Western blot and the densitometric quantification of protein carbonyls in plasma. Values were normalized to those observed in the samples obtained from the three-month-old group, which was assigned a value of 100%. B) shows plasma lipid peroxidation determined as malondialdehyde {MDA). Values are shown as mean ± SD. (*) indicates P <0.05, (**) indicates P <0.01. Continuous lines show statistically significant differences between the wheel-running animals. Discontinuous lines show statistically significant differences between the sedentary animals.
Figure 5
Figure 5
Expression and activity of GPx and MnSOD in the liver at different survival time points (3, 20, 26 and 29 months old) in the longevity curve. A) and C) show the expression of GPx and MnSOD studied by real time RT-PCR. Values were normalized to those observed in the samples obtained from the three-month-old group, which was assigned a value of 100%. B) and D) show GPx and MnSOD activity. Values are shown as mean ± SD. (*) indicates P <0.05, (**) indicates P <0.01. Continuous lines show statistically significant differences between the wheel-running animals. Discontinuous lines show statistically significant differences between the sedentary animals. GPx, glutathione peroxidase; MnSOD, manganese superoxide dismutase.
Figure 6
Figure 6
Cortex BDNF levels, determined by ELISA, in sedentary and wheel-running mice at different survival time points (3, 20, 26 and 29 months old) in the longevity curve. Values are shown as mean ± SD. (*) indicates P <0.05, (**) indicates P <0.01. Continuous lines show statistically significant differences between the wheel-running animals. Discontinuous lines show statistically significant differences between the sedentary animals. BDNF, brain-derived neurotrophic factor.

References

    1. Oeppen J, Vaupel JW. Demography. Broken limits to life expectancy. Science. 2002;2:1029–1031. doi: 10.1126/science.1069675. - DOI - PubMed
    1. Goetzl EJ. Is aging a drug target? FASEB J. 2011;2:2509–2511. doi: 10.1096/fj.11-0801ufm. - DOI - PubMed
    1. Fries JF. Aging, natural death, and the compression of morbidity. N Engl J Med. 1980;2:130–135. doi: 10.1056/NEJM198007173030304. - DOI - PubMed
    1. Kirkland JL, Peterson C. Healthspan, translation, and new outcomes for animal studies of aging. J Gerontol A Biol Sci Med Sci. 2009;2:209–212. - PMC - PubMed
    1. Tatar M. Can we develop genetically tractable models to assess healthspan (rather than life span) in animal models? J Gerontol A Biol Sci Med Sci. 2009;2:161–163. - PMC - PubMed

LinkOut - more resources