. 2014 Apr;83(4):450-61.
doi: 10.1111/cbdd.12260.

Two- and three-dimensional rings in drugs

Affiliations

Two- and three-dimensional rings in drugs

Matteo Aldeghi et al. Chem Biol Drug Des. 2014 Apr.

Abstract

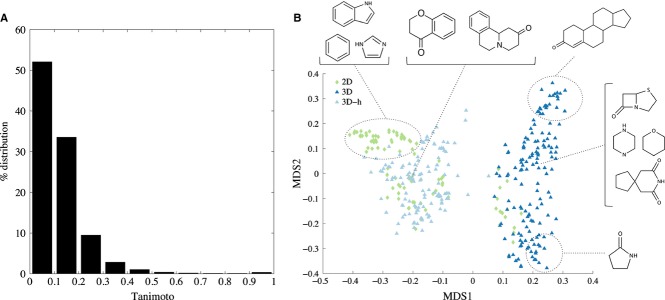
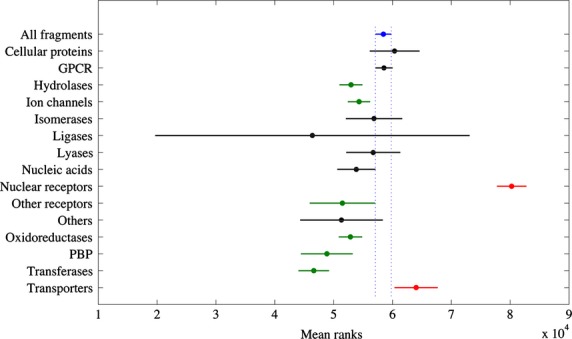
Using small, flat aromatic rings as components of fragments or molecules is a common practice in fragment-based drug discovery and lead optimization. With an increasing focus on the exploration of novel biological and chemical space, and their improved synthetic accessibility, 3D fragments are attracting increasing interest. This study presents a detailed analysis of 3D and 2D ring fragments in marketed drugs. Several measures of properties were used, such as the type of ring assemblies and molecular shapes. The study also took into account the relationship between protein classes targeted by each ring fragment, providing target-specific information. The analysis shows the high structural and shape diversity of 3D ring systems and their importance in bioactive compounds. Major differences in 2D and 3D fragments are apparent in ligands that bind to the major drug targets such as GPCRs, ion channels, and enzymes.

Keywords: drug; fragment; lead optimization; ring.


Figures

Figure 1
Figure 1
Definition of 2D and 3D ring fragments, using Indinavir as an example. A ring fragment is defined as a ring assembly. Fragments with no sp3 carbon are classed as 2D (green), the rest as 3D (blue). 3D-h (light blue) is a subset of the 3D fragments, denoting 3D hybrid/fused ring systems containing both pure 3D and aromatic rings.
Figure 2
Figure 2
Ring fragment count distribution in our dataset of marketed drugs.
Figure 3
Figure 3
Ring type distributions among 2D and 3D ring fragments. (A) percentage of ring fragments containing at least one ring of the specified size; e.g., 76.5% of 3D fragments and 79.2% of 2D fragments contain at least one 6-membered ring. (B) percentage of ring fragments that are composed by one, two, three, four, five, or more rings.
Figure 4
Figure 4
Combinations of 2D and 3D rings found in marketed drugs. The graph shows the percentages of the most common combinations of 2D and 3D assemblies. These associations represent 93.4% of the whole data set. On the right, A–D are examples of drug molecules taken from the respective 2D/3D fragment combination groups; e.g. B, Ramipril is a drug formed by one 2D and one 3D fragment.
Figure 5
Figure 5
Principal moments of inertia (PMI) plot describing the molecular shape for the rings derived from marketed drugs. Two dimensional rings on the left and 3D rings on the right. Notice the more diverse distribution of shapes for 3D rings as compared to 2D.
Figure 6
Figure 6
Number and percentage of 2D and 3D rings per each target class. Values in parentheses next to the target categories are the percentage distribution of targets among the marketed drugs analyzed. On the abscissa, the number of rings (left) and their percentage (right) in the target class.
Figure 7
Figure 7
(A) Percentage distribution of Tanimoto scores for the whole set of non-redundant fragments. (B) The first 2 dimensions of the multidimensional scaling (MDS) map of fragments. Three dimensional fragments are denoted by blue triangles and 2D fragments by green diamonds. Some example molecules are shown, representing the structural characteristics of the fragments found in different clusters. Notice the wider spread of 3D fragments on the map, suggesting a higher skeletal diversity.
Figure 8
Figure 8
Fragment similarity comparison between different target classes. Each line represents the distribution of Tanimoto scores for the fragments belonging to a specific target class. Shown are the location of the distribution and a 95% confidence interval (in blue dotted box for the all-fragment sample). Two mean ranks are significantly different if their intervals do not overlap. Samples in red show a significantly higher mean rank (lower diversity) from a chosen reference group, representing all the fragments (in blue). Samples in green show a significantly lower mean rank (higher diversity) as compared to the reference.

References

    1. Murray CW, Verdonk ML, Rees DC. Experiences in fragment-based drug discovery. Trends Pharmacol Sci. 2012;33:224–232. - PubMed
    1. Scott DE, Coyne AG, Hudson SA, Abell C. Fragment-based approaches in drug discovery and chemical biology. Biochemistry. 2012;51:4990–5003. - PubMed
    1. Congreve M, Carr R, Murray C, Jhoti H. A ‘rule of three’ for fragment-based lead discovery? Drug Discov Today. 2003;8:876–877. - PubMed
    1. Congreve M, Chessari G, Tisi D, Woodhead AJ. Recent developments in fragment-based drug discovery. J Med Chem. 2008;51:3661–3680. - PubMed
    1. Hung AW, Ramek A, Wang Y, Kaya T, Wilson JA, Clemons PA, Young DW. Route to three-dimensional fragments using diversity-oriented synthesis. Proc Natl Acad Sci USA. 2011;108:6799–6804. - PMC - PubMed