. 2014 Mar;164(3):1204-21.
doi: 10.1104/pp.113.231241. Epub 2014 Jan 28.

Remarkable reproducibility of enzyme activity profiles in tomato fruits grown under contrasting environments provides a roadmap for studies of fruit metabolism

Affiliations

Remarkable reproducibility of enzyme activity profiles in tomato fruits grown under contrasting environments provides a roadmap for studies of fruit metabolism

Benot Biais et al. Plant Physiol. 2014 Mar.

Abstract

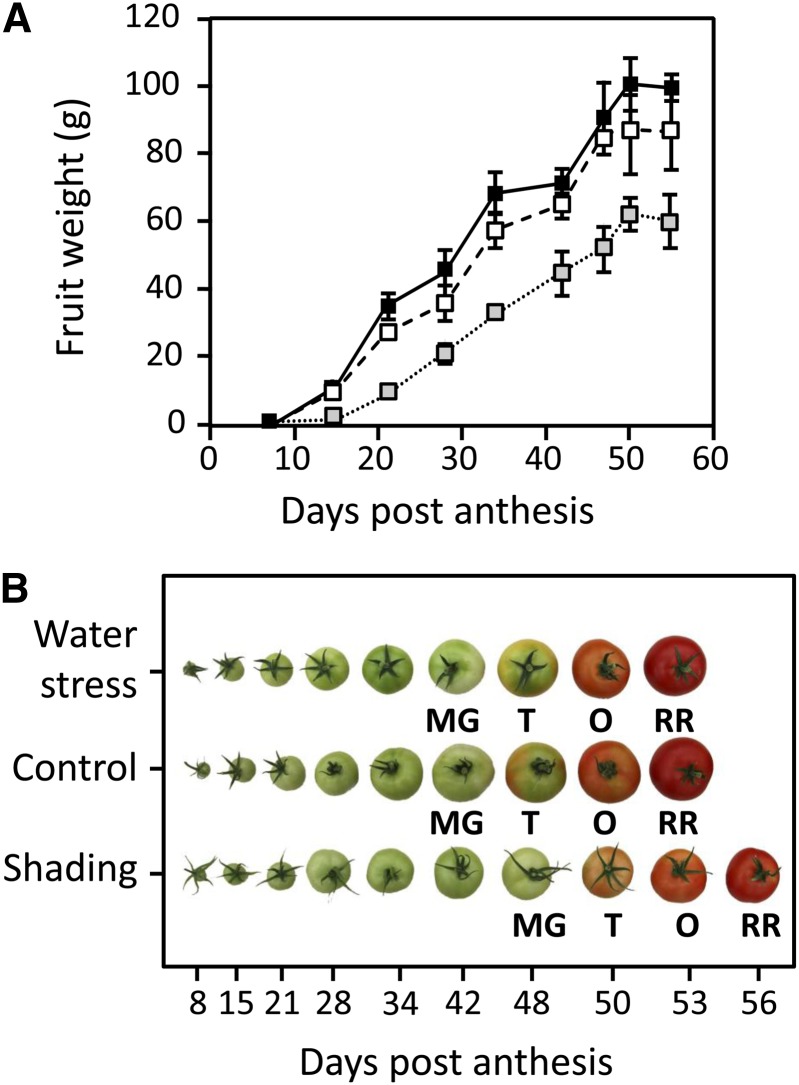
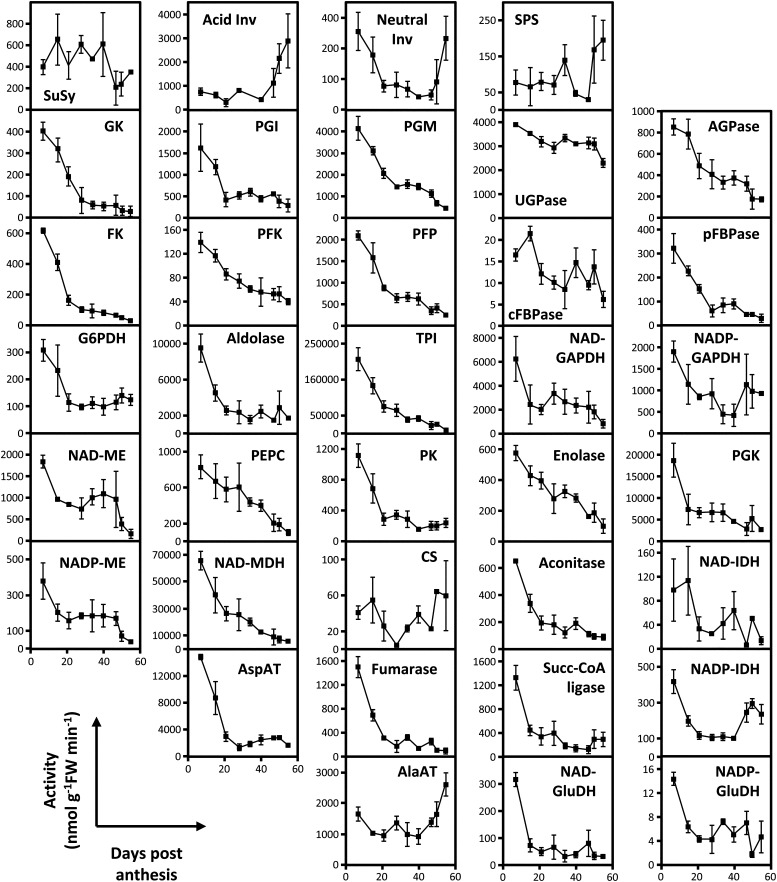
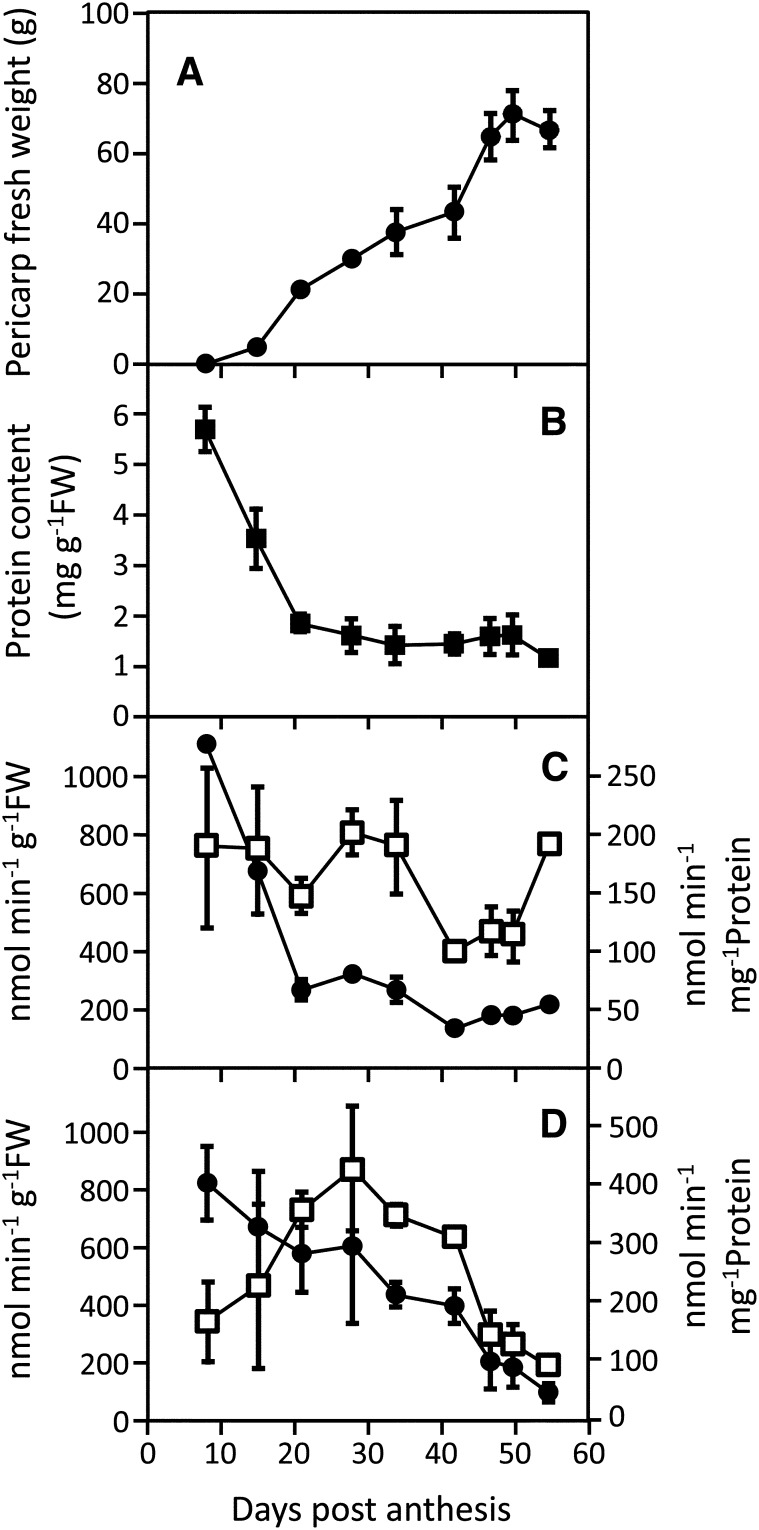
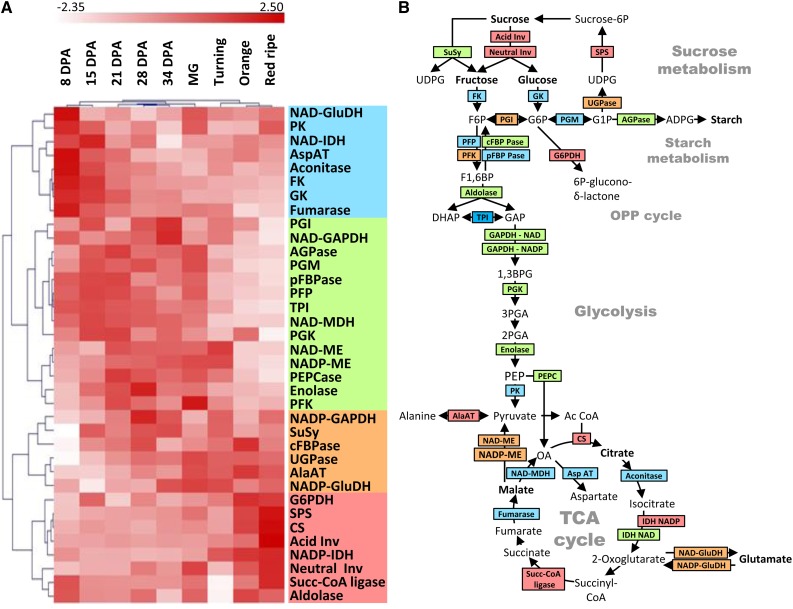
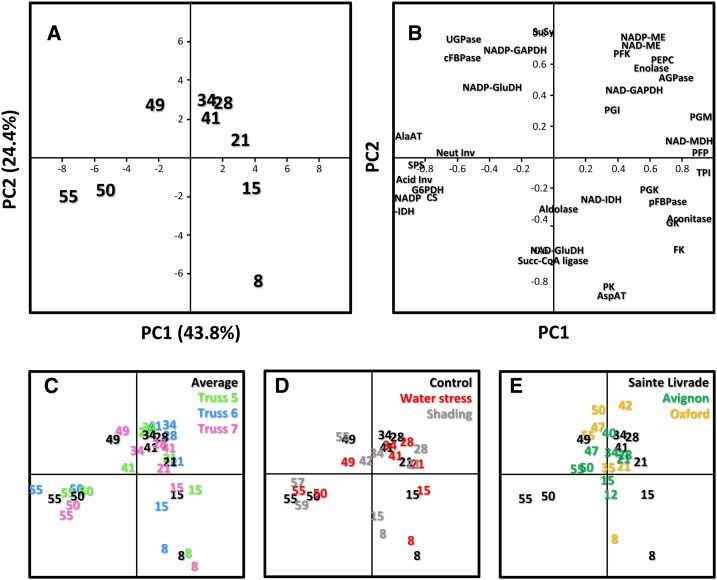
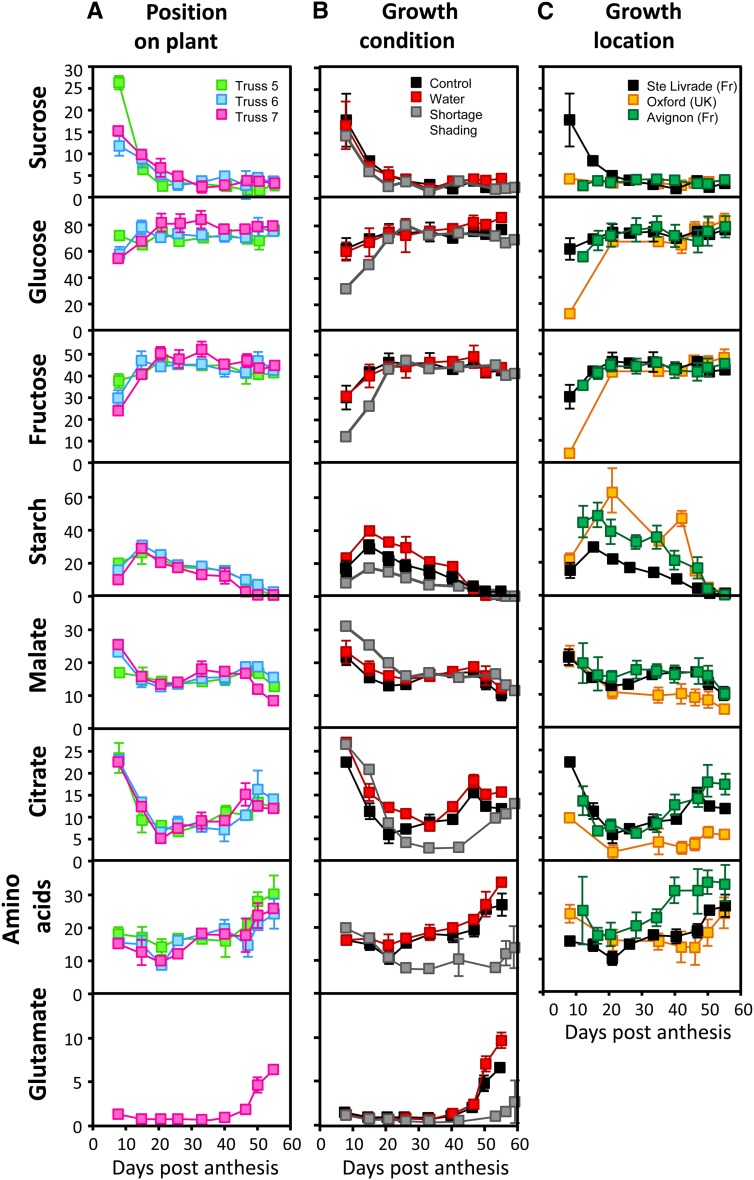
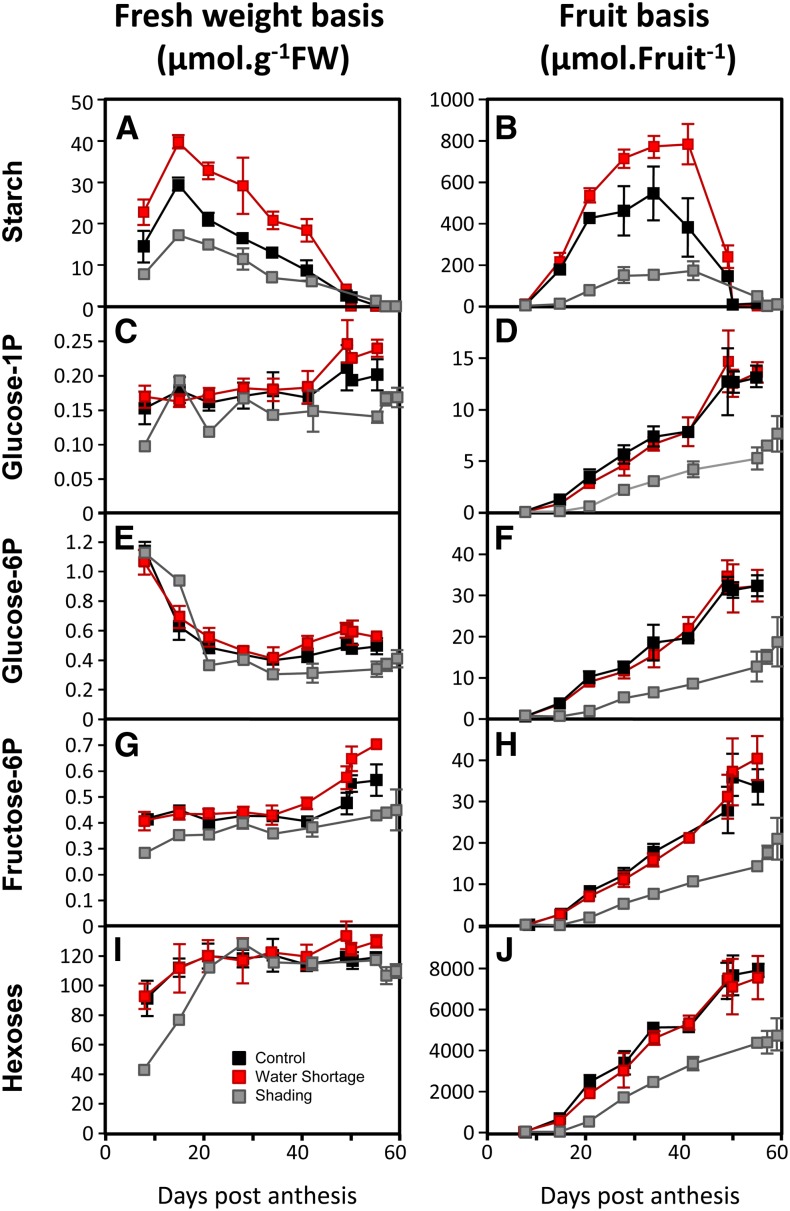
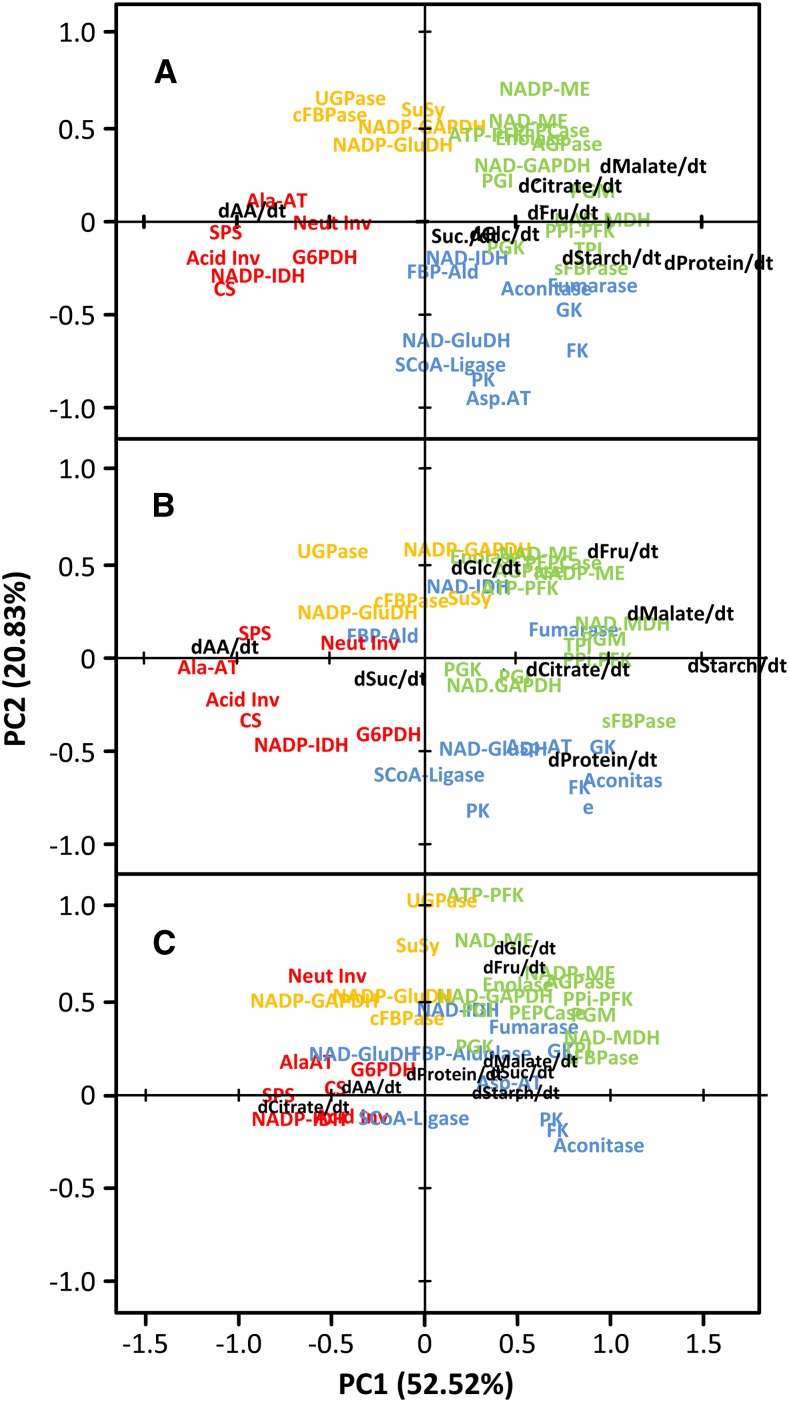
To assess the influence of the environment on fruit metabolism, tomato (Solanum lycopersicum 'Moneymaker') plants were grown under contrasting conditions (optimal for commercial, water limited, or shaded production) and locations. Samples were harvested at nine stages of development, and 36 enzyme activities of central metabolism were measured as well as protein, starch, and major metabolites, such as hexoses, sucrose, organic acids, and amino acids. The most remarkable result was the high reproducibility of enzyme activities throughout development, irrespective of conditions or location. Hierarchical clustering of enzyme activities also revealed tight relationships between metabolic pathways and phases of development. Thus, cell division was characterized by high activities of fructokinase, glucokinase, pyruvate kinase, and tricarboxylic acid cycle enzymes, indicating ATP production as a priority, whereas cell expansion was characterized by enzymes involved in the lower part of glycolysis, suggesting a metabolic reprogramming to anaplerosis. As expected, enzymes involved in the accumulation of sugars, citrate, and glutamate were strongly increased during ripening. However, a group of enzymes involved in ATP production, which is probably fueled by starch degradation, was also increased. Metabolites levels seemed more sensitive than enzymes to the environment, although such differences tended to decrease at ripening. The integration of enzyme and metabolite data obtained under contrasting growth conditions using principal component analysis suggests that, with the exceptions of alanine amino transferase and glutamate and malate dehydrogenase and malate, there are no links between single enzyme activities and metabolite time courses or levels.


Figures

Figure 1.
Figure 1.
Growth of fruits of S. lycopersicum ‘Moneymaker’ obtained under different environmental conditions. A, Fruit weight is expressed in grams ± sd (n = 9) at various development stages under optimal conditions (black line), with 50% water shortage (dashed line), and under a net removing 60% of the photosynthetically active radiation (dotted line). B, Illustration of the nine developmental stages harvested (8, 15, 21, 28, and 34 DPA, Mature Green [MG], Turning [T], Orange [O], and Red Ripe [RR]). Fruit ripening under shading was delayed by 5–8 d.
Figure 2.
Figure 2.
Maximal activities of 36 enzymes of central metabolism throughout tomato fruit development. Activities were measured in fruit pericarps harvested between 8 and 55 DPA at substrate saturation and 25°C, and they are expressed as nanomoles per minute per gram fresh weight ± sd (n = 5). Acid Inv, Acid invertase; Ald, aldolase; cFBPase, cytosolic Fru-1,6-bisphosphatase; CS, citrate synthase; FK, fructokinase; GK, glucokinase; Neutral Inv, neutral invertase; pFBPase, plastidial Fru-1,6-bisphosphatase; Succ-CoA, succinyl-CoA ligase; SuSy, Suc synthase.
Figure 3.
Figure 3.
Pericarp weight (A), protein content (B), fructokinase (C), and phosphoenolpyruvate carboxylase (D) activity during tomato fruit development. Fruit age is expressed as DPA, pericarp weight is expressed in grams ± sd (n = 9), and enzyme activities are expressed in nanomoles per minute pergram fresh weight (black circles) and nanomoles per minute per milligram protein ± sd (white squares; n = 5).
Figure 4.
Figure 4.
Hierarchical clustering analysis of enzyme activity profiles throughout development and ripening of fruit obtained under optimal growth conditions. A, The clustering analysis was performed on activities expressed on a protein basis by Pearson’s correlation, mean centered, and scaled to unit data. Columns correspond to nine developmental stages, and rows correspond to enzyme activities. The four main enzyme clusters are highlighted with a colored bar on the left. B, Simplified drawing of central metabolism in plant. The color code corresponds to the clusters selected in A. Blue, activities highest during cell division and beginning of cell expansion; green, activities highest during cell expansion; orange, activity peaking at late expansion; red, activities highest at ripening. Abbreviations for enzymes are the same as in Figure 2.
Figure 5.
Figure 5.
Comparison of enzyme activity profiles obtained in fruits grown on different trusses under optimal or suboptimal growth conditions and at different locations by PCA. Numbers indicating the coordinates correspond to fruit age. A, Scores plot obtained for the reference culture conducted in Sainte-Livrade, France (numbers in black) and subsequently used for comparison. B, Corresponding loadings plot. C, Scores plots obtained by adding data obtained for trusses 5 (numbers in green), 6 (numbers in blue), and 7 (numbers in pink). D, Scores plots obtained by adding data obtained under water shortage (numbers in red) and shading (numbers in gray). E, Scores plots obtained by adding data obtained from fruits grown in Avignon, France (numbers in green) and Oxford, United Kingdom (numbers in orange). Abbreviations for enzymes are the same as in Figure 2.
Figure 6.
Figure 6.
Changes in major metabolites throughout tomato fruit development. Fruit age is given in DPA. Total amino acids, Glc, Fru, malate, and citrate are expressed in micromoles per gram fresh weight ± sd, and Suc and starch are expressed in Glc equivalents (micromoles glucose per gram fresh weight− ± sd). A, Data obtained from fruits grown in Sainte-Livrade under optimal growth conditions on trusses 5–7 (n = 5). B, Data from fruits grown under control (means for trusses 5–7), water-limited (n = 5), and shaded (n = 5) growth conditions. C, Data obtained from fruits grown in Sainte-Livrade (same as in B), Avignon (n = 5), and Oxford (n = 5).
Figure 7.
Figure 7.
Comparison of changes throughout fruit development in starch, hexoses phosphate, and hexoses when expressed on a fresh or whole-fruit pericarp basis. Fruit age is given in DPA. A, C, E, G, and I, Data are expressed on a fresh weight basis (moles per gram fresh weight [FW]). B, D, F, H, and J, Data are expressed on a fruit basis (micromoles per fruit per pericarp).
Figure 8.
Figure 8.
Integration of enzyme activities and metabolites accumulation rates in tomato fruits during development and ripening using PCA. Enzyme activities were expressed on a protein basis, and data for metabolite rates were expressed as per fruit pericarp and per day. Data were centered and scaled before PCA. A, Loadings plot obtained with control data (fruits grown under optimal conditions). B, Loadings plot for additional data obtained under water shortage. C, Loadings plot for additional data obtained under shading. Coordinates for each enzyme activity or metabolite are indicated by text. Text colors indicate the cluster to which enzymes have been assigned using hierarchical clustering (blue, cell division; green, cell early expansion; orange, late expansion; red, ripening; Fig. 4). Abbreviations for enzymes are the same as in Figure 2.

References

    1. Alba R, Payton P, Fei Z, McQuinn R, Debbie P, Martin GB, Tanksley SD, Giovannoni JJ. (2005) Transcriptome and selected metabolite analyses reveal multiple points of ethylene control during tomato fruit development. Plant Cell 17: 2954–2965 - PMC - PubMed
    1. Amemiya T, Kanayama Y, Yamaki S, Yamada K, Shiratake K. (2006) Fruit-specific V-ATPase suppression in antisense-transgenic tomato reduces fruit growth and seed formation. Planta 223: 1272–1280 - PubMed
    1. Appeldoorn NJG, de Bruijn SM, Koot-Gronsveld EAM, Visser RGF, Vreugdenhil D, van der Plas LHW. (1997) Developmental changes of enzymes involved in conversion of sucrose to hexose-phosphate during early tuberisation of potato. Planta 202: 220–226
    1. Balibrea ME, Martinez-Andujar C, Cuartero J, Bolarin MC, Perez-Alfocea F. (2006) The high fruit soluble sugar content in wild Lycopersicon species and their hybrids with cultivars depends on sucrose import during ripening rather than on sucrose metabolism. Funct Plant Biol 33: 279–288 - PubMed
    1. Beckles DM. (2012) Factors affecting the postharvest soluble solids and sugar content of tomato (Solanum lycopersicum L.) fruit. Postharvest Biol Technol 63: 129–140

Publication types

MeSH terms

LinkOut - more resources