

Increasing socioeconomic disparities in adolescent obesity
- PMID: 24474757
- PMCID: PMC3910644
- DOI: 10.1073/pnas.1321355110
Increasing socioeconomic disparities in adolescent obesity
Abstract
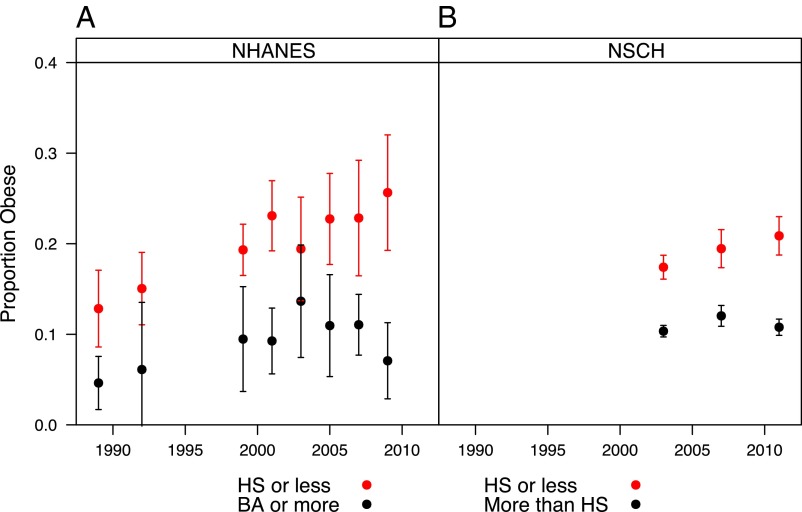
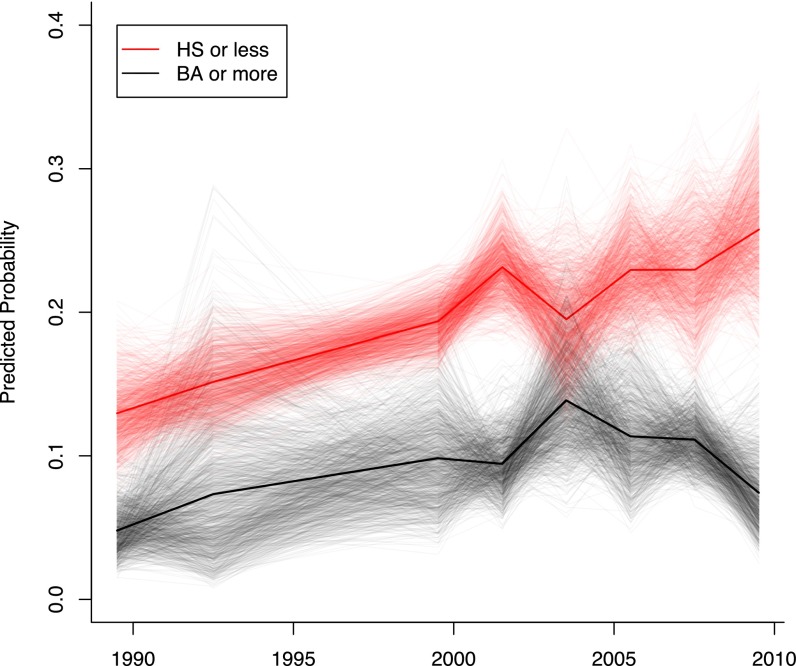
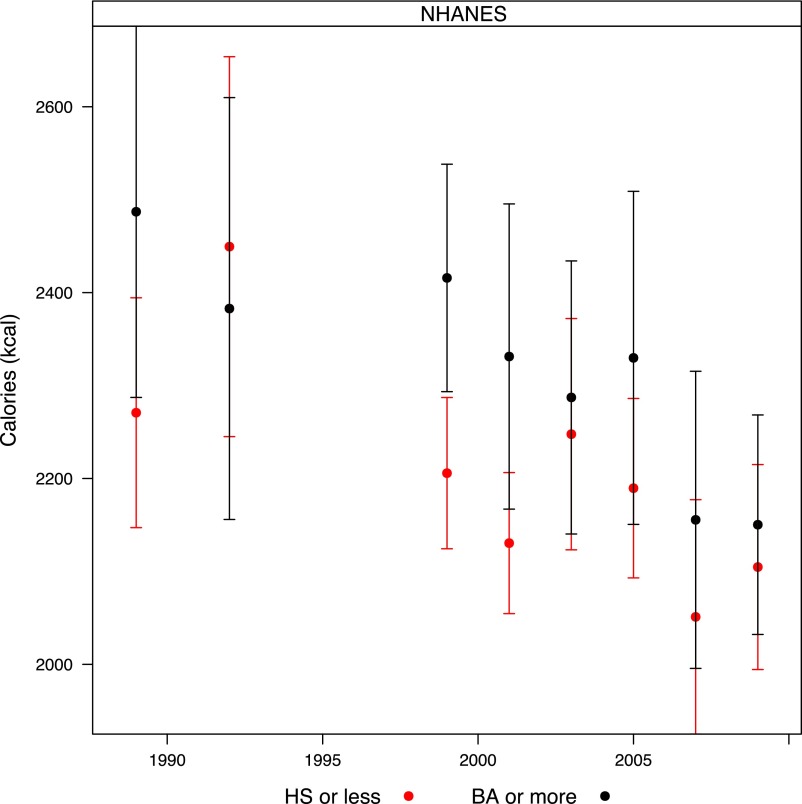
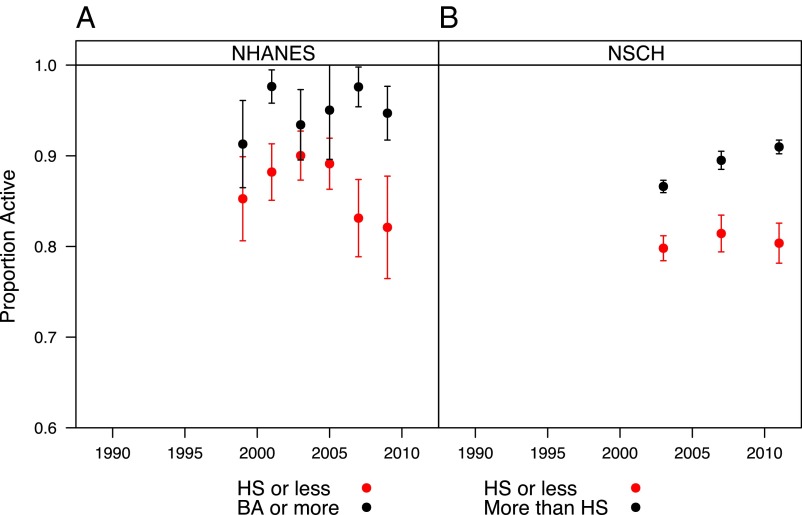
Recent reports suggest that the rapid growth in youth obesity seen in the 1980s and 1990s has plateaued. We examine changes in obesity among US adolescents aged 12-17 y by socioeconomic background using data from two nationally representative health surveys, the 1988-2010 National Health and Nutrition Examination Surveys and the 2003-2011 National Survey of Children's Health. Although the overall obesity prevalence stabilized, this trend masks a growing socioeconomic gradient: The prevalence of obesity among high-socioeconomic status adolescents has decreased in recent years, whereas the prevalence of obesity among their low-socioeconomic status peers has continued to increase. Additional analyses suggest that socioeconomic differences in the levels of physical activity, as well as differences in calorie intake, may have contributed to the growing obesity gradient.
Keywords: health disparities; overweight; public policy; social class; social inequality.
Conflict of interest statement
The authors declare no conflict of interest.
Figures
Comment in
-
Is poverty associated with obesity among American children?Proc Natl Acad Sci U S A. 2014 Jun 3;111(22):E2237. doi: 10.1073/pnas.1405656111. Epub 2014 May 19. Proc Natl Acad Sci U S A. 2014. PMID: 24843138 Free PMC article. No abstract available.
-
Reply to Gao et al: Racial composition does not explain increasing class gaps in obesity.Proc Natl Acad Sci U S A. 2014 Jun 3;111(22):E2238. doi: 10.1073/pnas.1406465111. Proc Natl Acad Sci U S A. 2014. PMID: 25054191 Free PMC article. No abstract available.
References
-
- Ogden CL, Flegal KM, Carroll MD, Johnson CL. Prevalence and trends in overweight among US children and adolescents, 1999-2000. JAMA. 2002;288(14):1728–1732. - PubMed
-
- Daniels SR, et al. Overweight in children and adolescents: Pathophysiology, consequences, prevention, and treatment. Circulation. 2005;111(15):1999–2012. - PubMed
-
- Dietz WH. Health consequences of obesity in youth: Childhood predictors of adult disease. Pediatrics. 1998;101(3 Pt 2):518–525. - PubMed
-
- Ebbeling CB, Pawlak DB, Ludwig DS. Childhood obesity: Public-health crisis, common sense cure. Lancet. 2002;360(9331):473–482. - PubMed
Publication types
MeSH terms
LinkOut - more resources
Full Text Sources
Other Literature Sources
Medical
