. 2014 Jan 28;111(4):E426-34.
doi: 10.1073/pnas.1320692111. Epub 2014 Jan 13.

Structures of yeast mitochondrial ADP/ATP carriers support a domain-based alternating-access transport mechanism

Affiliations

Structures of yeast mitochondrial ADP/ATP carriers support a domain-based alternating-access transport mechanism

Jonathan J Ruprecht et al. Proc Natl Acad Sci U S A. .

Abstract

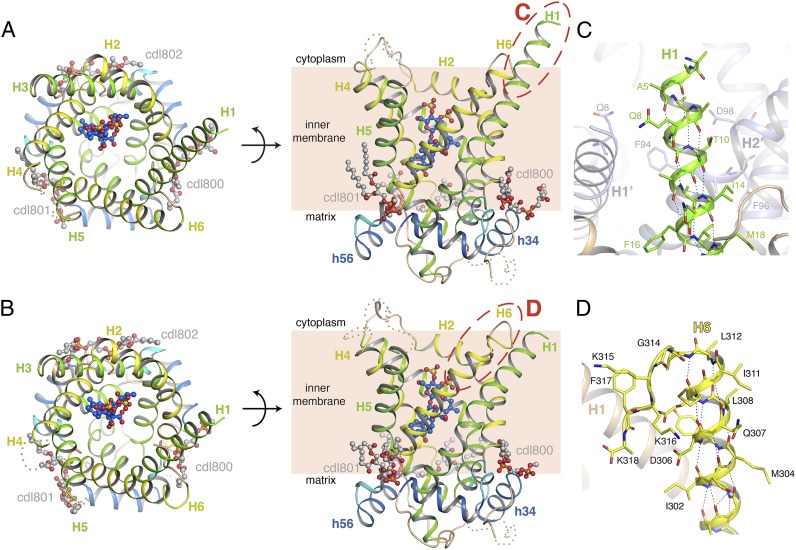
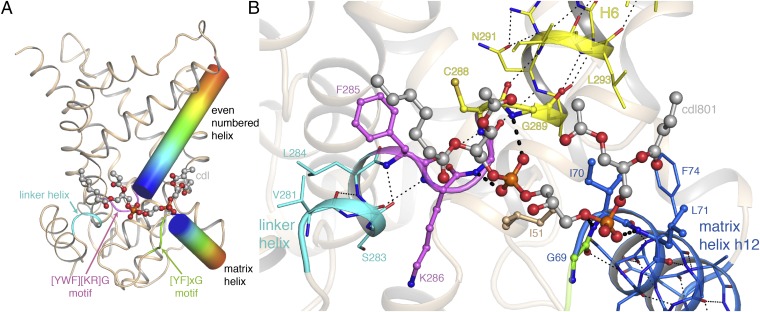
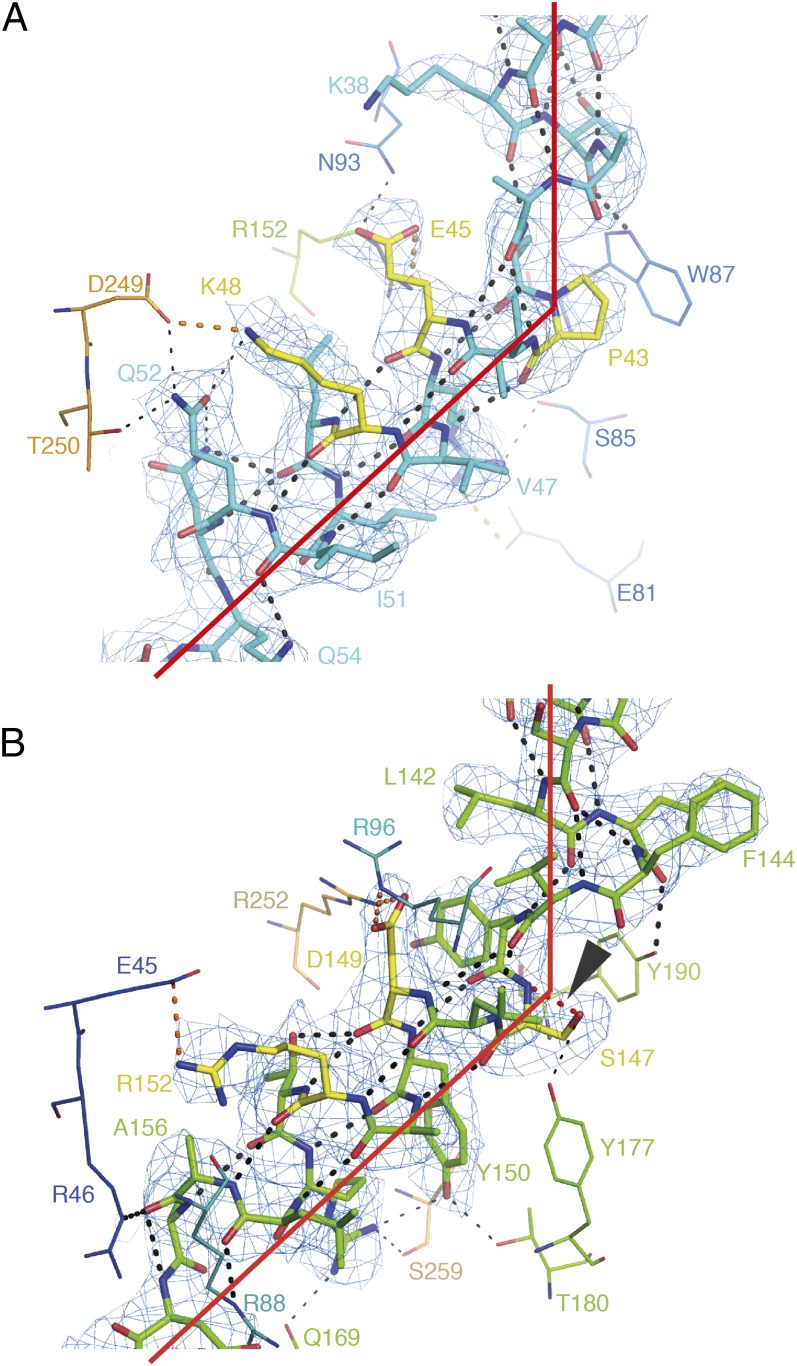
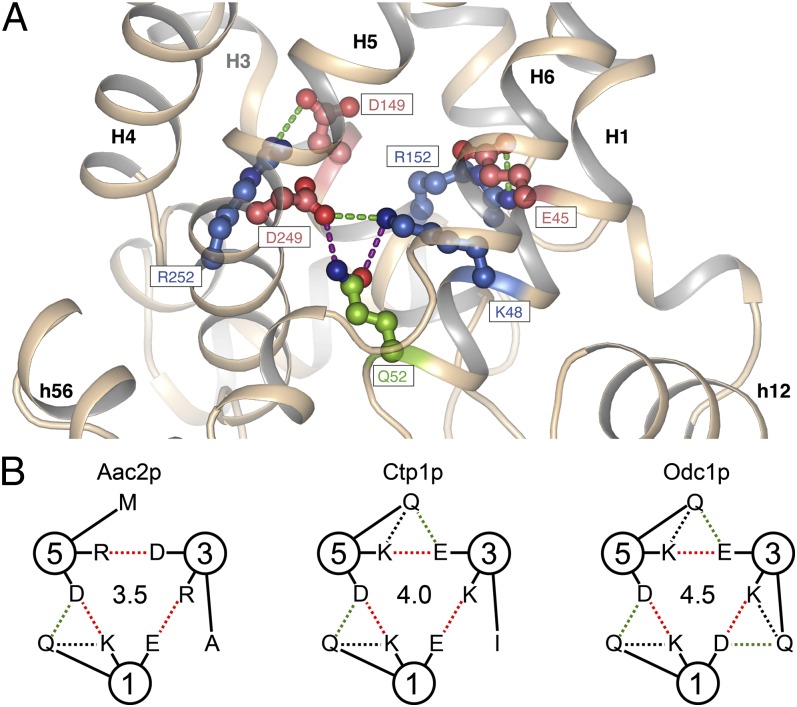
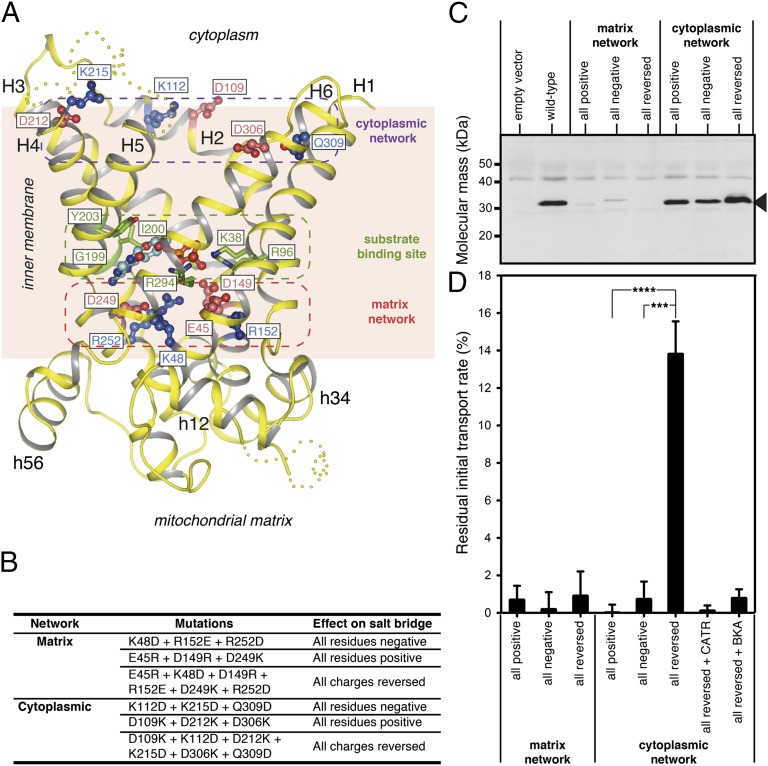
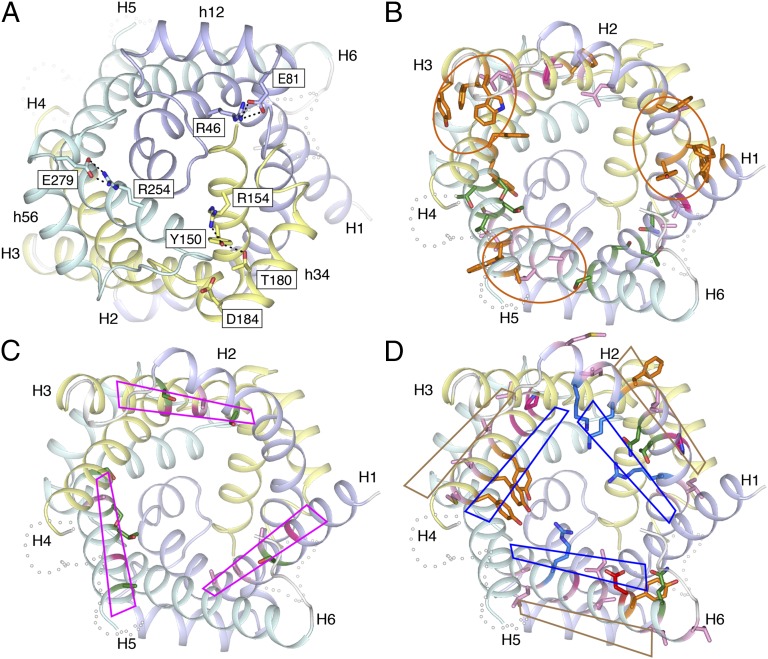
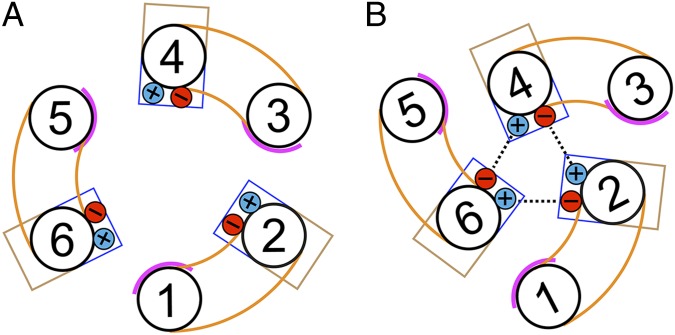
The mitochondrial ADP/ATP carrier imports ADP from the cytosol and exports ATP from the mitochondrial matrix. The carrier cycles by an unresolved mechanism between the cytoplasmic state, in which the carrier accepts ADP from the cytoplasm, and the matrix state, in which it accepts ATP from the mitochondrial matrix. Here we present the structures of the yeast ADP/ATP carriers Aac2p and Aac3p in the cytoplasmic state. The carriers have three domains and are closed at the matrix side by three interdomain salt-bridge interactions, one of which is braced by a glutamine residue. Glutamine braces are conserved in mitochondrial carriers and contribute to an energy barrier, preventing the conversion to the matrix state unless substrate binding occurs. At the cytoplasmic side a second salt-bridge network forms during the transport cycle, as demonstrated by functional analysis of mutants with charge-reversed networks. Analyses of the domain structures and properties of the interdomain interfaces indicate that interconversion between states involves movement of the even-numbered α-helices across the surfaces of the odd-numbered α-helices by rotation of the domains. The odd-numbered α-helices have an L-shape, with proline or serine residues at the kinks, which functions as a lever-arm, coupling the substrate-induced disruption of the matrix network to the formation of the cytoplasmic network. The simultaneous movement of three domains around a central translocation pathway constitutes a unique mechanism among transport proteins. These findings provide a structural description of transport by mitochondrial carrier proteins, consistent with an alternating-access mechanism.

Keywords: X-ray crystallography; adenine nucleotide translocase; cardiolipin binding; membrane protein; serine kinks.


Conflict of interest statement

The authors declare no conflict of interest.

Figures

Fig. 1.
Fig. 1.
Architecture of the yeast ADP/ATP carriers. (A) Aac3p (chain B of the P21 crystal), viewed from the cytoplasm (Left) and from the membrane (Right). (B) Equivalent views of Aac2p (chain A of the P212121 crystal). Odd-numbered helices are shown in green, even-numbered helices in yellow, matrix helices in blue, and linker helices in cyan. Cardiolipin and CATR molecules are shown in ball-and-stick representation, with gray-colored carbons for cardiolipin and blue-colored carbons for CATR. The cytoplasmic loop between H4 and H5 and part of the loop between H3 and matrix helix h34 are missing, and are indicated as wheat-colored dots, following the position of these elements in the bovine carrier. Red-dashed ovals show the location of the close-ups in C and D. (C) The N-terminal region of Aac3p (chain B of the P21 crystal). H1 is in green, and the rest of the structure in wheat. A symmetry-related molecule is shown in pale blue, and residues making crystal contacts to the N-terminal region are shown as sticks. (D) The C-terminal region of Aac2p (chain A of the P212121 crystal). The C-terminal region is highlighted in yellow. In C and D, hydrogen bonds are shown by black-dotted lines. Side-chains for some residues in the N- and C-terminal regions have poor density, and have therefore been modeled to the Cβ atom.
Fig. 2.
Fig. 2.
Cardiolipin binding to Aac2p. (A) Schematic representation of the key elements of the cardiolipin-binding sites. The even-numbered and matrix helices for one binding site are shown as cylinders, with a rainbow color scheme (N terminus, blue; C terminus, red), the linker helix is shown in cyan. (B) Detailed view of the binding site for cardiolipin (Cdl801 in chain A of the P212121 crystal form). Residues in the linker helix, even-numbered helix, and matrix helix are shown with cyan, yellow, and blue carbon atoms, respectively. Hydrogen bonds within these helices are shown as thin black-dotted lines. Residues in the [YWF][KR]G and [YF]xG motifs are shown in violet and green, respectively. Residues contacting cardiolipin are shown with spheres. Hydrogen-bond interactions between protein and cardiolipin are shown as thick black-dashed lines. Electron density is present for only part of the cardiolipin acyl chains, and they have therefore been modeled with truncated acyl chains.
Fig. 3.
Fig. 3.
Proline and serine residues in the signature motifs of Aac2p. (A) The signature motif of H1 (cyan) and (B) of H3 (green) of Aac2p (chain A of P212121). Residues interacting with the side-chains are shown in line representation. Residues of the signature motif are shown in yellow. Hydrogen bonds involving backbone atoms are shown as thick black-dotted lines, hydrogen bonds not involving backbone atoms are shown as thin black-dotted lines. Salt bridges are shown as orange-dotted lines. The density, shown as a blue mesh, is a 2mFo-DFc map, contoured at 1 σ, and displayed within 2 Å of the atoms. In B, the unusual hydrogen bond from the side-chain of Ser147 to its own backbone amide is highlighted in red dots, and indicated by an arrowhead.
Fig. 4.
Fig. 4.
Glutamine residues brace salt bridge links of the matrix network. (A) Close-up of the bonding arrangement of glutamine with the salt bridge of the matrix network that links domains 1 and 3 of Aac2p. (B) Interactions of glutamine residues with salt-bridge residues of the matrix network of Aac2p and the yeast citrate carrier Ctp1 and oxodicarboxylate carrier Odc1p. The circles represent the odd-numbered α-helices H1, H3, and H5, with the residues indicated in the one-letter amino acid code. The interdomain and intradomain polar interactions with glutamine are shown in green- and black-dashed lines, respectively, whereas the salt bridges are shown in red. The central numbers give an estimate of the strength of interaction network in terms of number of salt bridges, assuming that hydrogen bonds have about half the interaction energy of salt bridges.
Fig. 5.
Fig. 5.
The cytoplasmic salt-bridge network forms during the transport cycle. (A) Lateral view of the structure of the yeast ADP/ATP carrier Aac2p with the positively charged (blue) and negatively charged (red) residues of the matrix and cytoplasmic salt-bridge networks indicated. Shown also are the contact points of the substrate-binding site (green) interacting with ADP (light blue) docked in the site. (B) Mutations introduced into the matrix and cytoplasmic networks to change the residues to all positively charged, all negatively charged, and fully reversed matrix or cytoplasmic salt-bridge networks. (C) Western blot of lactococcal membranes expressing wild-type and mutant Aac2p carriers. An antibody raised against Neurospora crassa ADP/ATP carrier was used and the band for Aac2p is indicated by an arrowhead. Approximately 10 μg total protein was loaded per lane. (D) Residual ADP uptake rate corrected for background of mutant Aac2p carriers compared with the wild-type rate in fused lactococcal membranes. The specific initial uptake rate of wild-type Aac2p (100%) was 0.788 nmol⋅min−1⋅mg−1 of protein. For active transporters the residual rates were also determined in the presence of CATR and bongkrekic acid (BKA). The initial transport rates were determined in the linear part of the uptake curve. The data are represented by the average plus SD of three independent experiments. Student t test P values are indicated: ***P ≤ 0.001 and ****P ≤ 0.0001.
Fig. 6.
Fig. 6.
Conserved properties of the intra- and interdomain interfaces suggest a domain-based mechanism of transport. (A) Intradomain hydrogen bonds and salt bridges link the matrix-side of the odd-numbered helices to the matrix helices. The networks involve negatively charged residues of the EG motif on the matrix helices. View from the matrix side of the membrane. (B) Many of the residues in the intradomain interface are aromatic or form hydrophobic or polar clusters. The aromatic clusters are highlighted by orange ovals. Side-chains for Phe23 and Phe231 are not modeled because of poor density. (C) Residues of the odd-numbered α-helices close to the interdomain interface have no or small side-chains, and include the conserved GxxxG motif. The interfaces are highlighted by magenta rhomboids. The side-chain of Ser230 is not modeled. (D) Residues of the even-numbered α-helices close to the interdomain interface are either hydrophobic and face the membrane, or are hydrophilic and face the cavity. The hydrophobic and hydrophilic faces are shown as brown and blue rhomboids, respectively. In AD, domain 1 is colored light blue, domain 2 pale yellow, and domain 3 pale cyan. For BD, the carrier is viewed from the cytoplasmic side and polar, aliphatic, aromatic, structural, positively charged, and negatively charged residues are shown in green, pink, orange, magenta, blue, and red, respectively.
Fig. 7.
Fig. 7.
Proposed domain motions in the transport cycle. (A and B) Schematic representation of the helical arrangement at the cytoplasmic side in the c-state and m-state, respectively. The domain structures are shown in orange. Pink lines indicate the smooth surface of the odd-numbered α-helices in the interdomain interface. Blue and brown boxes represent hydrophilic and hydrophobic residues on the even-numbered α-helices at the interdomain interface, which face either the cavity or the membrane, respectively. The positive and negatively charged residues of the cytoplasmic salt-bridge network are shown in blue and red, respectively. The formation of the cytoplasmic salt-bridge network is shown as dashed lines.

References

    1. Palmieri F. The mitochondrial transporter family SLC25: Identification, properties and physiopathology. Mol Aspects Med. 2013;34(2–3):465–484. - PubMed
    1. Palmieri F. Diseases caused by defects of mitochondrial carriers: A review. Biochim Biophys Acta. 2008;1777(7–8):564–578. - PubMed
    1. Klingenberg M. The ADP and ATP transport in mitochondria and its carrier. Biochim Biophys Acta. 2008;1778(10):1978–2021. - PubMed
    1. Duee ED, Vignais PV. [Exchange between extra- and intramitochondrial adenine nucleotides] Biochim Biophys Acta. 1965;107(1):184–188. French. - PubMed
    1. Vignais PV, Vignais PM, Defaye G. Adenosine diphosphate translocation in mitochondria. Nature of the receptor site for carboxyatractyloside (gummiferin) Biochemistry. 1973;12(8):1508–1519. - PubMed

Publication types

MeSH terms

Substances