

IFN-γ signaling maintains skin pigmentation homeostasis through regulation of melanosome maturation
- PMID: 24474804
- PMCID: PMC3926048
- DOI: 10.1073/pnas.1304988111
IFN-γ signaling maintains skin pigmentation homeostasis through regulation of melanosome maturation
Abstract
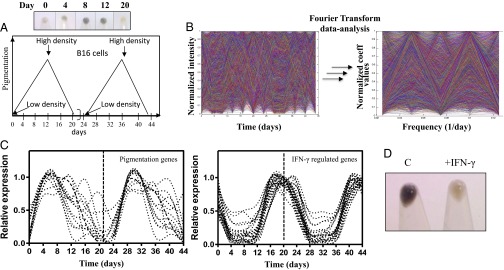
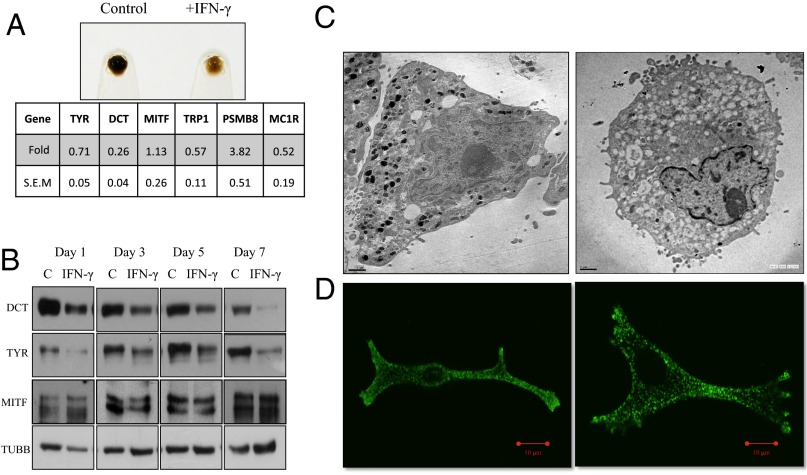
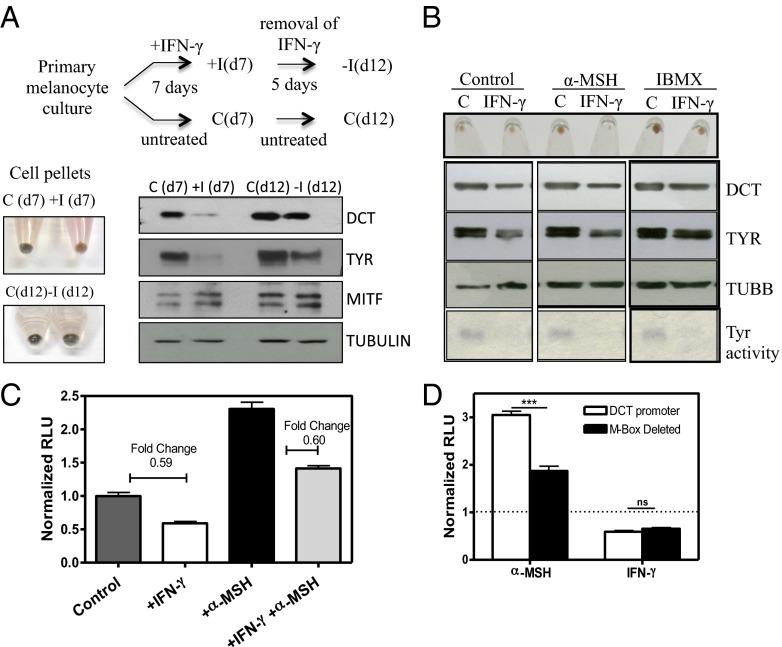
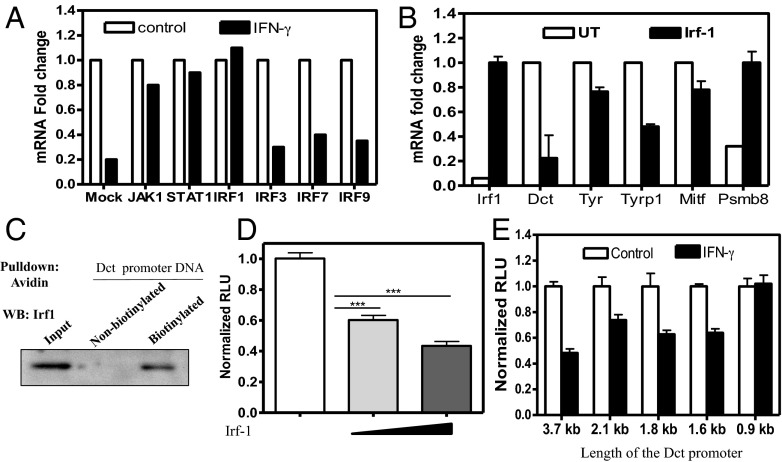
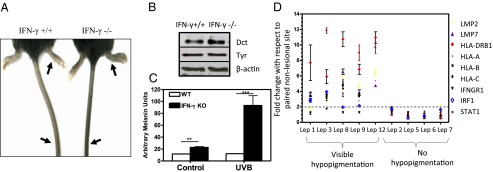
Cellular homeostasis is an outcome of complex interacting processes with nonlinear feedbacks that can span distinct spatial and temporal dimensions. Skin tanning is one such dynamic response that maintains genome integrity of epidermal cells. Although pathways underlying hyperpigmentation cascade are recognized, negative feedback regulatory loops that can dampen the activated melanogenesis process are not completely understood. In this study, we delineate a regulatory role of IFN-γ in skin pigmentation biology. We show that IFN-γ signaling impedes maturation of the key organelle melanosome by concerted regulation of several pigmentation genes. Withdrawal of IFN-γ signal spontaneously restores normal cellular programming. This effect in melanocytes is mediated by IFN regulatory factor-1 and is not dependent on the central regulator microphthalmia-associated transcription factor. Chronic IFN-γ signaling shows a clear hypopigmentation phenotype in both mouse and human skin. Interestingly, IFN-γ KO mice display a delayed recovery response to restore basal state of epidermal pigmentation after UV-induced tanning. Together, our studies delineate a new spatiotemporal role of the IFN-γ signaling network in skin pigmentation homeostasis, which could have implications in various cutaneous depigmentary and malignant disorders.
Keywords: detanning; gene regulation; interferon; melanin.
Conflict of interest statement
The authors declare no conflict of interest.
Figures
Similar articles
-
Cross-talk between interferon-gamma and interleukin-18 in melanogenesis.J Photochem Photobiol B. 2016 Oct;163:133-43. doi: 10.1016/j.jphotobiol.2016.08.024. Epub 2016 Aug 21. J Photochem Photobiol B. 2016. PMID: 27567084
-
Mammalian pigmentation is regulated by a distinct cAMP-dependent mechanism that controls melanosome pH.Sci Signal. 2018 Nov 6;11(555):eaau7987. doi: 10.1126/scisignal.aau7987. Sci Signal. 2018. PMID: 30401788 Free PMC article.
-
The role of autophagy in skin pigmentation.Eur J Dermatol. 2020 Dec 1;30(6):655-662. doi: 10.1684/ejd.2020.3930. Eur J Dermatol. 2020. PMID: 33262098 Review.
-
FK506 regulates pigmentation by maturing the melanosome and facilitating their transfer to keratinocytes.Pigment Cell Melanoma Res. 2016 Mar;29(2):199-209. doi: 10.1111/pcmr.12443. Epub 2016 Jan 27. Pigment Cell Melanoma Res. 2016. PMID: 26581186
-
Recent advances in understanding the molecular basis of melanogenesis in melanocytes.F1000Res. 2020 Jun 15;9:F1000 Faculty Rev-608. doi: 10.12688/f1000research.24625.1. eCollection 2020. F1000Res. 2020. PMID: 32595944 Free PMC article. Review.
Cited by
-
Diversified Stimuli-Induced Inflammatory Pathways Cause Skin Pigmentation.Int J Mol Sci. 2021 Apr 12;22(8):3970. doi: 10.3390/ijms22083970. Int J Mol Sci. 2021. PMID: 33921371 Free PMC article. Review.
-
pH-controlled histone acetylation amplifies melanocyte differentiation downstream of MITF.EMBO Rep. 2020 Jan 7;21(1):e48333. doi: 10.15252/embr.201948333. Epub 2019 Nov 11. EMBO Rep. 2020. PMID: 31709752 Free PMC article.
-
Enhanced Vaccine Immunogenicity Enabled by Targeted Cytosolic Delivery of Tumor Antigens into Dendritic Cells.ACS Cent Sci. 2023 Sep 14;9(9):1835-1845. doi: 10.1021/acscentsci.3c00625. eCollection 2023 Sep 27. ACS Cent Sci. 2023. PMID: 37780364 Free PMC article.
-
Vitiligo: Focus on Clinical Aspects, Immunopathogenesis, and Therapy.Clin Rev Allergy Immunol. 2018 Feb;54(1):52-67. doi: 10.1007/s12016-017-8622-7. Clin Rev Allergy Immunol. 2018. PMID: 28685247 Review.
-
Transcriptional Reprogramming and Constitutive PD-L1 Expression in Melanoma Are Associated with Dedifferentiation and Activation of Interferon and Tumour Necrosis Factor Signalling Pathways.Cancers (Basel). 2021 Aug 24;13(17):4250. doi: 10.3390/cancers13174250. Cancers (Basel). 2021. PMID: 34503064 Free PMC article.
References
Publication types
MeSH terms
Substances
Associated data
- Actions
LinkOut - more resources
Full Text Sources
Other Literature Sources
Molecular Biology Databases
Research Materials
