

Multi-scale glycemic variability: a link to gray matter atrophy and cognitive decline in type 2 diabetes
- PMID: 24475100
- PMCID: PMC3901681
- DOI: 10.1371/journal.pone.0086284
Multi-scale glycemic variability: a link to gray matter atrophy and cognitive decline in type 2 diabetes
Abstract
Objective: Type 2 diabetes mellitus (DM) accelerates brain aging and cognitive decline. Complex interactions between hyperglycemia, glycemic variability and brain aging remain unresolved. This study investigated the relationship between glycemic variability at multiple time scales, brain volumes and cognition in type 2 DM.
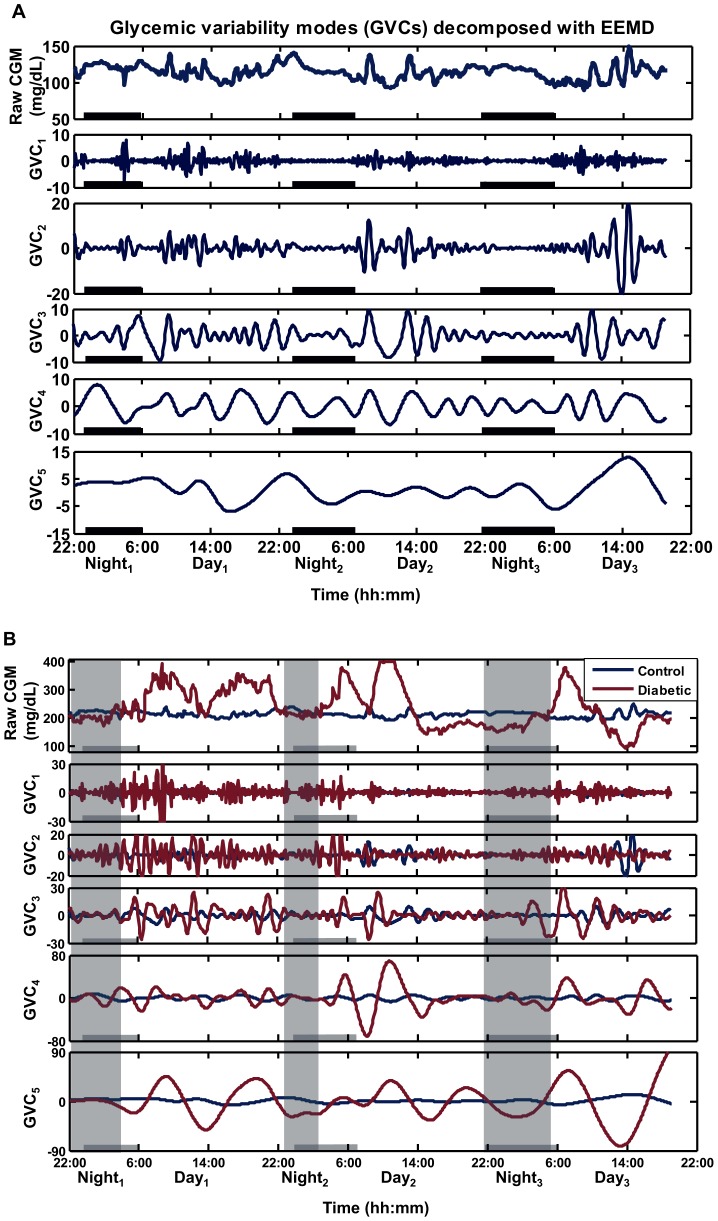
Research design and methods: Forty-three older adults with and 26 without type 2 DM completed 72-hour continuous glucose monitoring, cognitive tests and anatomical MRI. We described a new analysis of continuous glucose monitoring, termed Multi-Scale glycemic variability (Multi-Scale GV), to examine glycemic variability at multiple time scales. Specifically, Ensemble Empirical Mode Decomposition was used to identify five unique ultradian glycemic variability cycles (GVC1-5) that modulate serum glucose with periods ranging from 0.5-12 hrs.
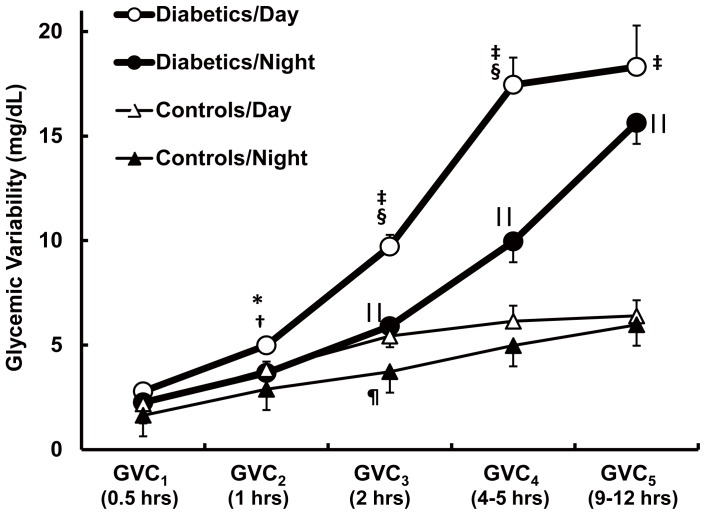
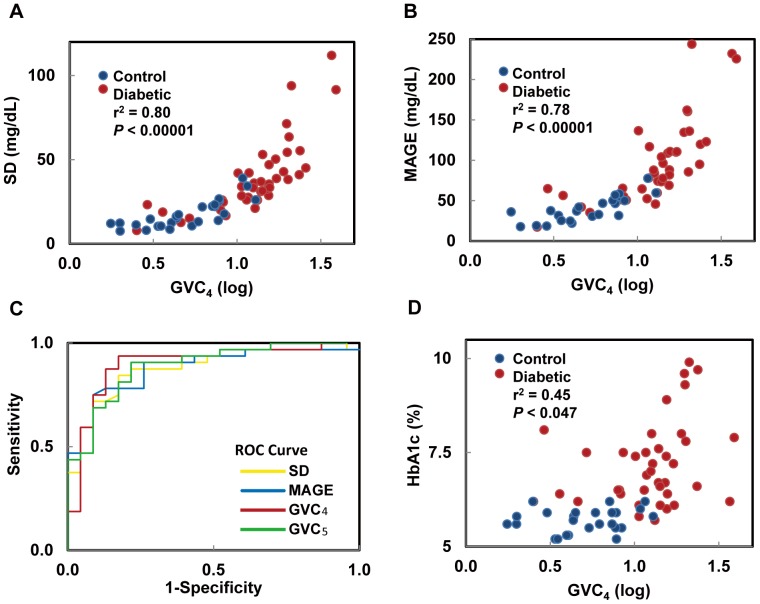
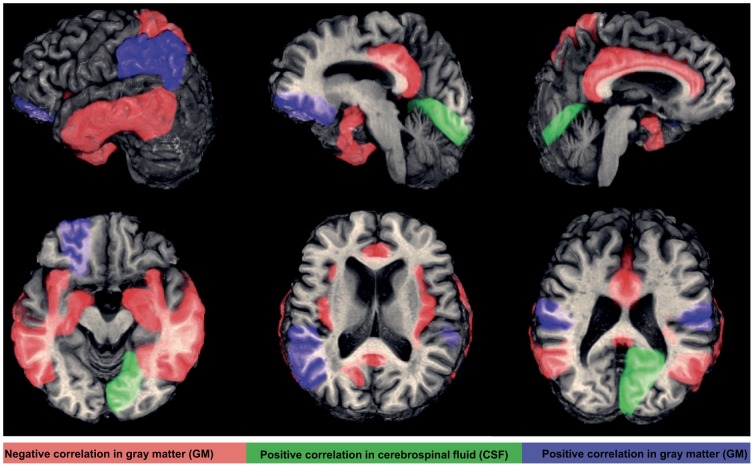
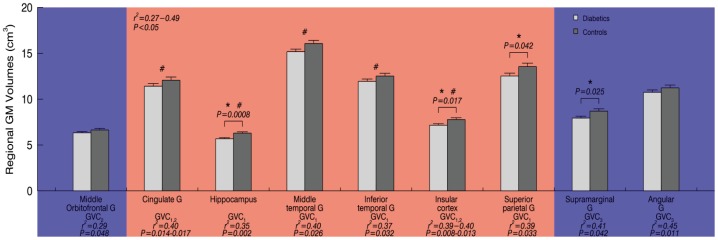
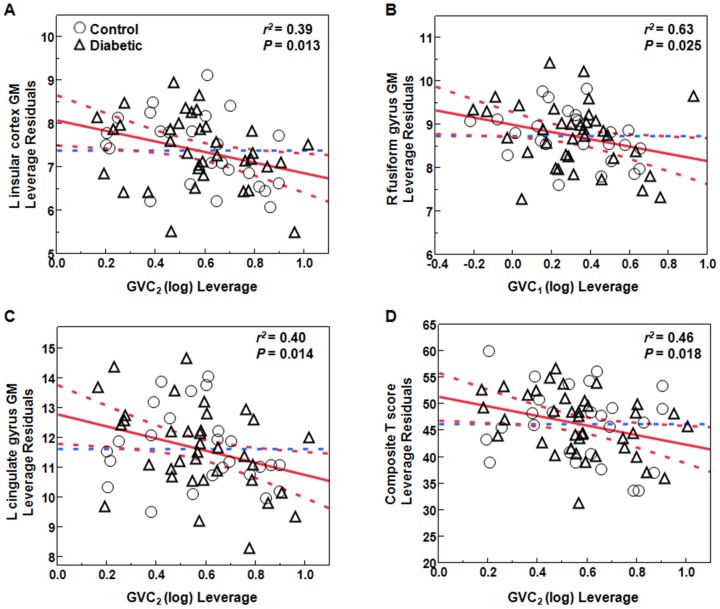
Results: Type 2 DM subjects demonstrated greater variability in GVC3-5 (period 2.0-12 hrs) than controls (P<0.0001), during the day as well as during the night. Multi-Scale GV was related to conventional markers of glycemic variability (e.g. standard deviation and mean glycemic excursions), but demonstrated greater sensitivity and specificity to conventional markers, and was associated with worse long-term glycemic control (e.g. fasting glucose and HbA1c). Across all subjects, those with greater glycemic variability within higher frequency cycles (GVC1-3; 0.5-2.0 hrs) had less gray matter within the limbic system and temporo-parietal lobes (e.g. cingulum, insular, hippocampus), and exhibited worse cognitive performance. Specifically within those with type 2 DM, greater glycemic variability in GVC2-3 was associated with worse learning and memory scores. Greater variability in GVC5 was associated with longer DM duration and more depression. These relationships were independent of HbA1c and hypoglycemic episodes.
Conclusions: Type 2 DM is associated with dysregulation of glycemic variability over multiple scales of time. These time-scale-dependent glycemic fluctuations might contribute to brain atrophy and cognitive outcomes within this vulnerable population.
Conflict of interest statement
Figures
Similar articles
-
[Neural networks in the predictive diagnosis of cognitive impairment in type 1 and type 2 diabetes mellitus].Ter Arkh. 2021 Nov 15;93(11):1349-1358. doi: 10.26442/00403660.2021.11.201253. Ter Arkh. 2021. PMID: 36286658 Russian.
-
Progression of brain atrophy and cognitive decline in diabetes mellitus: a 3-year follow-up.Neurology. 2010 Sep 14;75(11):997-1002. doi: 10.1212/WNL.0b013e3181f25f06. Neurology. 2010. PMID: 20837967 Clinical Trial.
-
Association between short-term glucose fluctuations and cognition in patients with acute ischemic stroke complicated by type 2 diabetes mellitus.J Nutr Health Aging. 2024 Jul;28(7):100252. doi: 10.1016/j.jnha.2024.100252. Epub 2024 Apr 30. J Nutr Health Aging. 2024. PMID: 38692207
-
Glucose Variability: A Review of Clinical Applications and Research Developments.Diabetes Technol Ther. 2018 Jun;20(S2):S25-S215. doi: 10.1089/dia.2018.0092. Diabetes Technol Ther. 2018. PMID: 29916742 Review.
-
CGMS and Glycemic Variability, Relevance in Clinical Research to Evaluate Interventions in T2D, a Literature Review.Front Endocrinol (Lausanne). 2021 Sep 9;12:666008. doi: 10.3389/fendo.2021.666008. eCollection 2021. Front Endocrinol (Lausanne). 2021. PMID: 34566883 Free PMC article. Review.
Cited by
-
Glucose variability: A physiological correlate of eating disorder behaviors among individuals with binge-spectrum eating disorders.Int J Eat Disord. 2022 Dec;55(12):1788-1798. doi: 10.1002/eat.23838. Epub 2022 Oct 28. Int J Eat Disord. 2022. PMID: 36305323 Free PMC article.
-
Cardiovascular Risk Factors: It's Time to Focus on Variability!J Lipid Atheroscler. 2020 May;9(2):255-267. doi: 10.12997/jla.2020.9.2.255. Epub 2020 Apr 7. J Lipid Atheroscler. 2020. PMID: 32821735 Free PMC article. Review.
-
Cortical thickness contributes to cognitive heterogeneity in patients with type 2 diabetes mellitus.Medicine (Baltimore). 2018 May;97(21):e10858. doi: 10.1097/MD.0000000000010858. Medicine (Baltimore). 2018. PMID: 29794784 Free PMC article.
-
Long-term glycemic variability and risk of stroke in patients with diabetes: a meta-analysis.Diabetol Metab Syndr. 2022 Jan 12;14(1):6. doi: 10.1186/s13098-021-00770-0. Diabetol Metab Syndr. 2022. PMID: 35022087 Free PMC article.
-
Diabetes and the link between neuroplasticity and glutamate in the aging human motor cortex.Clin Neurophysiol. 2019 Sep;130(9):1502-1510. doi: 10.1016/j.clinph.2019.04.721. Epub 2019 Jun 21. Clin Neurophysiol. 2019. PMID: 31295719 Free PMC article.
References
Publication types
MeSH terms
Substances
Grants and funding
- 8UL1TR000170-05/TR/NCATS NIH HHS/United States
- 8KL2TR000168-05/TR/NCATS NIH HHS/United States
- NIDDK-5R21-DK-084463-02/PHS HHS/United States
- R21 DK084463/DK/NIDDK NIH HHS/United States
- UL1 TR000170/TR/NCATS NIH HHS/United States
- NIA-1R01-AG-0287601-A2/AG/NIA NIH HHS/United States
- KL2 RR025757/RR/NCRR NIH HHS/United States
- 5R21-DK-084463-02/DK/NIDDK NIH HHS/United States
- KL2 TR000168/TR/NCATS NIH HHS/United States
- 1R01-AG-0287601-A2/AG/NIA NIH HHS/United States
- 1KL2RR025757-04/RR/NCRR NIH HHS/United States
- KL2 RR 025757/RR/NCRR NIH HHS/United States
LinkOut - more resources
Full Text Sources
Other Literature Sources
Medical
