

A new mathematical model for the interpretation of translational research evaluating six CTLA-4 polymorphisms in high-risk melanoma patients receiving adjuvant interferon
- PMID: 24475110
- PMCID: PMC3903519
- DOI: 10.1371/journal.pone.0086375
A new mathematical model for the interpretation of translational research evaluating six CTLA-4 polymorphisms in high-risk melanoma patients receiving adjuvant interferon
Abstract
Adjuvant therapy of stage IIB/III melanoma with interferon reduces relapse and mortality by up to 33% but is accompanied by toxicity-related complications. Polymorphisms of the CTLA-4 gene associated with autoimmune diseases could help in identifying interferon treatment benefits. We previously genotyped 286 melanoma patients and 288 healthy (unrelated) individuals for six CTLA-4 polymorphisms (SNP). Previous analyses found no significant differences between the distributions of CTLA-4 polymorphisms in the melanoma population vs. controls, no significant difference in relapse free and overall survivals among patients and no correlation between autoimmunity and specific alleles. We report new analysis of these CTLA-4 genetic profiles, using Network Phenotyping Strategy (NPS). It is graph-theory based method, analyzing the SNP patterns. Application of NPS on CTLA-4 polymorphism captures allele relationship pattern for every patient into 6-partite mathematical graph P. Graphs P are combined into weighted 6-partite graph S, which subsequently decomposed into reference relationship profiles (RRP). Finally, every individual CTLA-4 genotype pattern is characterized by the graph distances of P from eight identified RRP's. RRP's are subgraphs of S, collecting equally frequent binary allele co-occurrences in all studied loci. If S topology represents the genetic "dominant model", the RRP's and their characteristic frequencies are identical to expectation-maximization derived haplotypes and maximal likelihood estimates of their frequencies. The graph-representation allows showing that patient CTLA-4 haplotypes are uniquely different from the controls by absence of specific SNP combinations. New function-related insight is derived when the 6-partite graph reflects allelic state of CTLA-4. We found that we can use differences between individual P and specific RRPs to identify patient subpopulations with clearly different polymorphic patterns relatively to controls as well as to identify patients with significantly different survival.
Conflict of interest statement
Figures


 are sums of these mismatches (in computations, we add negative sign to make identity (zero mismatches) mathematically largest). a,b) Comparison of patient's genotype to the second and third reference SNP relationship patterns rrp3 and rrp2
.
c) Comparison of patient's genotype to the 4th reference SNP relationship pattern RRP4
.
are sums of these mismatches (in computations, we add negative sign to make identity (zero mismatches) mathematically largest). a,b) Comparison of patient's genotype to the second and third reference SNP relationship patterns rrp3 and rrp2
.
c) Comparison of patient's genotype to the 4th reference SNP relationship pattern RRP4
.

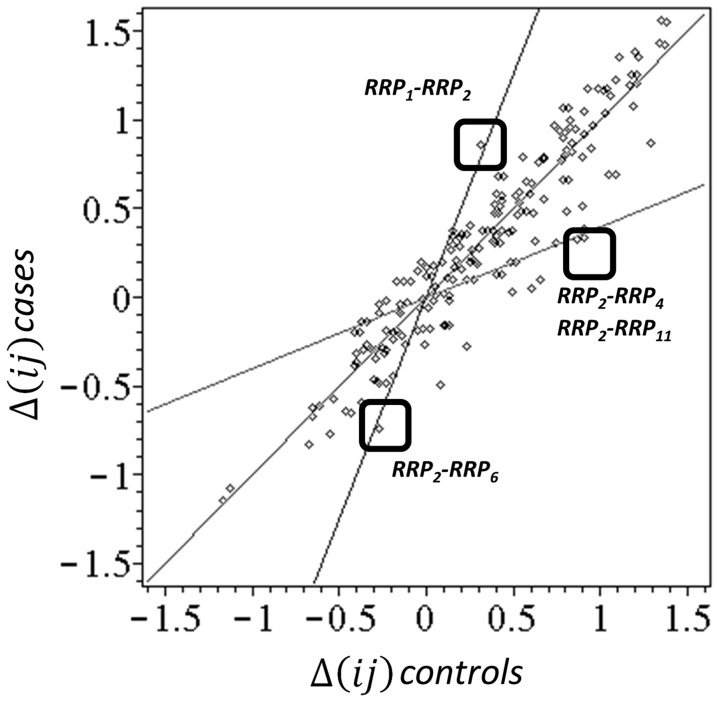
 coordinates (see text) computed by averaging the distance differences over all patients separately in case and control sub-cohorts for all 190 possible RRP pairs. In the neighborhood of diagonal line
  are non-discriminatory combinations. The two lines are used to identify the combinations, with maximal case – control and control-case bias in PRP-RRP distances. The optimal selection is shown by boxes.
 distance differences are plotted on x and y axes, on the z axis are numbers of subjects having a given combination of the distance differences. Blue-controls, red-cases.
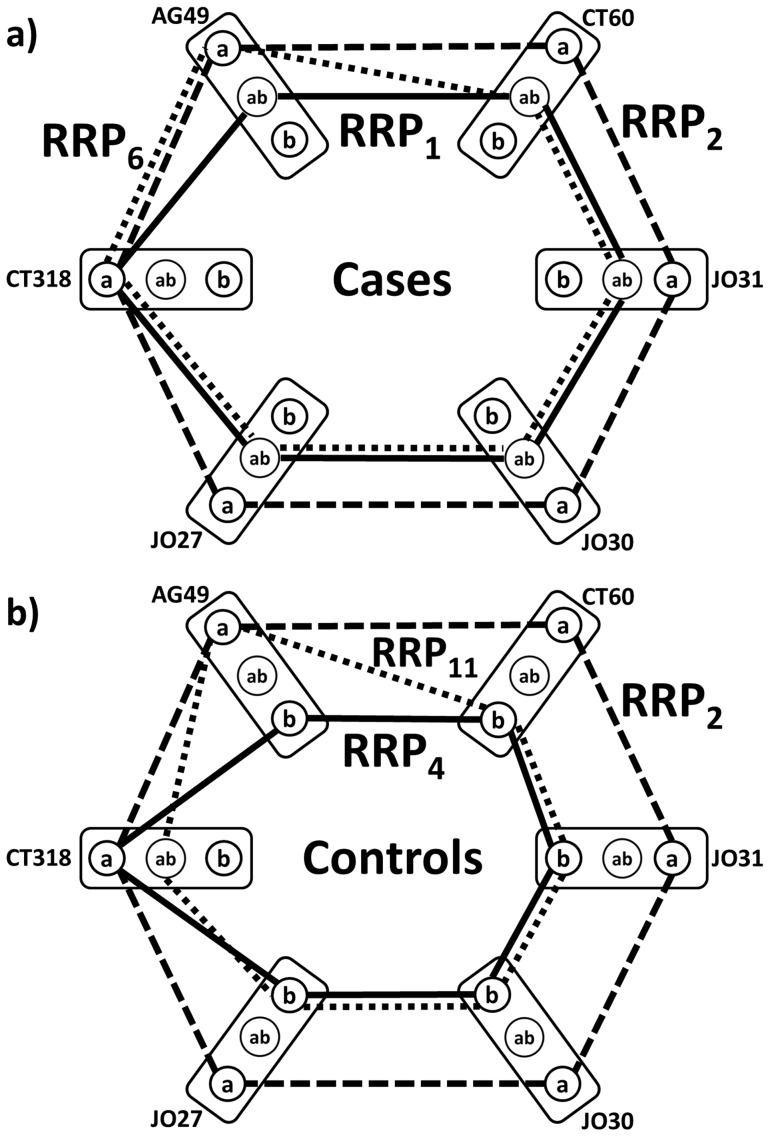

Similar articles
-
Evaluation of six CTLA-4 polymorphisms in high-risk melanoma patients receiving adjuvant interferon therapy in the He13A/98 multicenter trial.J Transl Med. 2010 Nov 3;8:108. doi: 10.1186/1479-5876-8-108. J Transl Med. 2010. PMID: 21044351 Free PMC article.
-
A novel multiplex pyrosequencing assay for genotyping functionally relevant CTLA-4 polymorphisms: potential applications in autoimmunity and cancer.Hum Immunol. 2014 Aug;75(8):730-9. doi: 10.1016/j.humimm.2014.04.019. Epub 2014 May 5. Hum Immunol. 2014. PMID: 24801647
-
A multi-factorial genetic model for prognostic assessment of high risk melanoma patients receiving adjuvant interferon.PLoS One. 2012;7(7):e40805. doi: 10.1371/journal.pone.0040805. Epub 2012 Jul 24. PLoS One. 2012. PMID: 22911710 Free PMC article.
-
Adjuvant therapy for melanoma.Cancer J. 2012 Mar-Apr;18(2):192-202. doi: 10.1097/PPO.0b013e31824f118b. Cancer J. 2012. PMID: 22453021 Free PMC article. Review.
-
No association of CTLA-4 polymorphisms with susceptibility to Behçet disease.Br J Ophthalmol. 2009 Oct;93(10):1378-81. doi: 10.1136/bjo.2008.156919. Epub 2009 Jun 30. Br J Ophthalmol. 2009. PMID: 19570770 Review.
References
-
- Kirkwood JM, Strawderman MH, Ernstoff MS, Smith TJ, Borden EC, et al. (1996) Interferon alfa-2b adjuvant therapy of high-risk resected cutaneous melanoma: the Eastern Cooperative Oncology Group Trial EST 1684. J Clin Oncol 14: 7–17. - PubMed
-
- Kirkwood JM, Ibrahim JG, Sosman JA, Sondak VK, Agarwala SS, et al. (2001) High-dose interferon alfa-2b significantly prolongs relapse-free and overall survival compared with the GM2-KLH/QS-21 vaccine in patients with resected stage IIB-III melanoma: results of intergroup trial E1694/S9512/C509801. J Clin Oncol 19: 2370–2380. - PubMed
-
- Mocellin S, Pasquali S, Rossi CR, Nitti D (2010) Interferon alpha adjuvant therapy in patients with high-risk melanoma: a systematic review and meta-analysis. J Natl Cancer Inst. 102: 493–501. - PubMed
-
- Kirkwood JM, Richards T, Zarour HM, Sosman J, Ernstoff M, et al. (2002) Immunomodulatory effects of high-dose and low-dose interferon alpha2b in patients with high-risk resected melanoma: the E2690 laboratory corollary of intergroup adjuvant trial E1690. Cancer 95: 1101–1112. - PubMed
Publication types
MeSH terms
Substances
Grants and funding
LinkOut - more resources
Full Text Sources
Other Literature Sources
Medical
