Randomized Controlled Trial
. 2014 Jan 27;9(1):e86555.
doi: 10.1371/journal.pone.0086555. eCollection 2014.

Randomized controlled ferret study to assess the direct impact of 2008-09 trivalent inactivated influenza vaccine on A(H1N1)pdm09 disease risk

Affiliations
Randomized Controlled Trial

Randomized controlled ferret study to assess the direct impact of 2008-09 trivalent inactivated influenza vaccine on A(H1N1)pdm09 disease risk

Danuta M Skowronski et al. PLoS One. .

Abstract

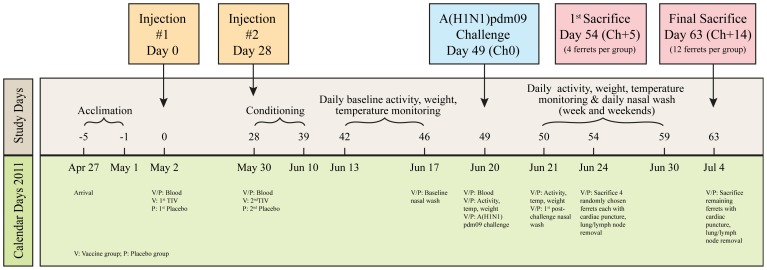
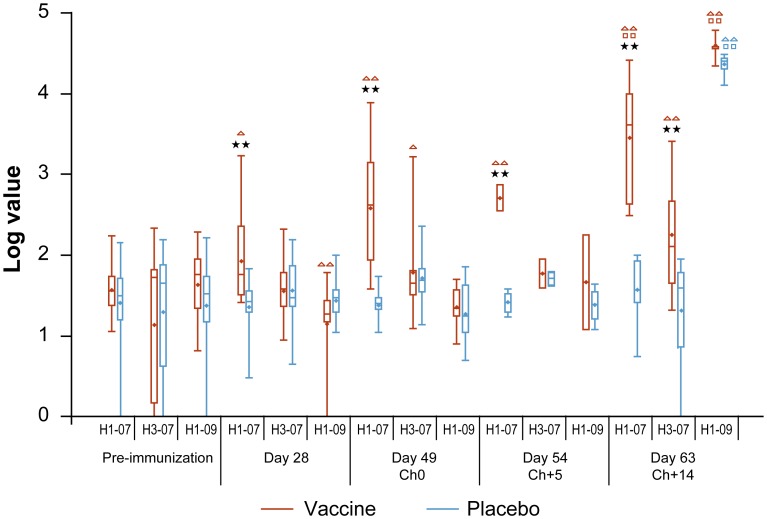
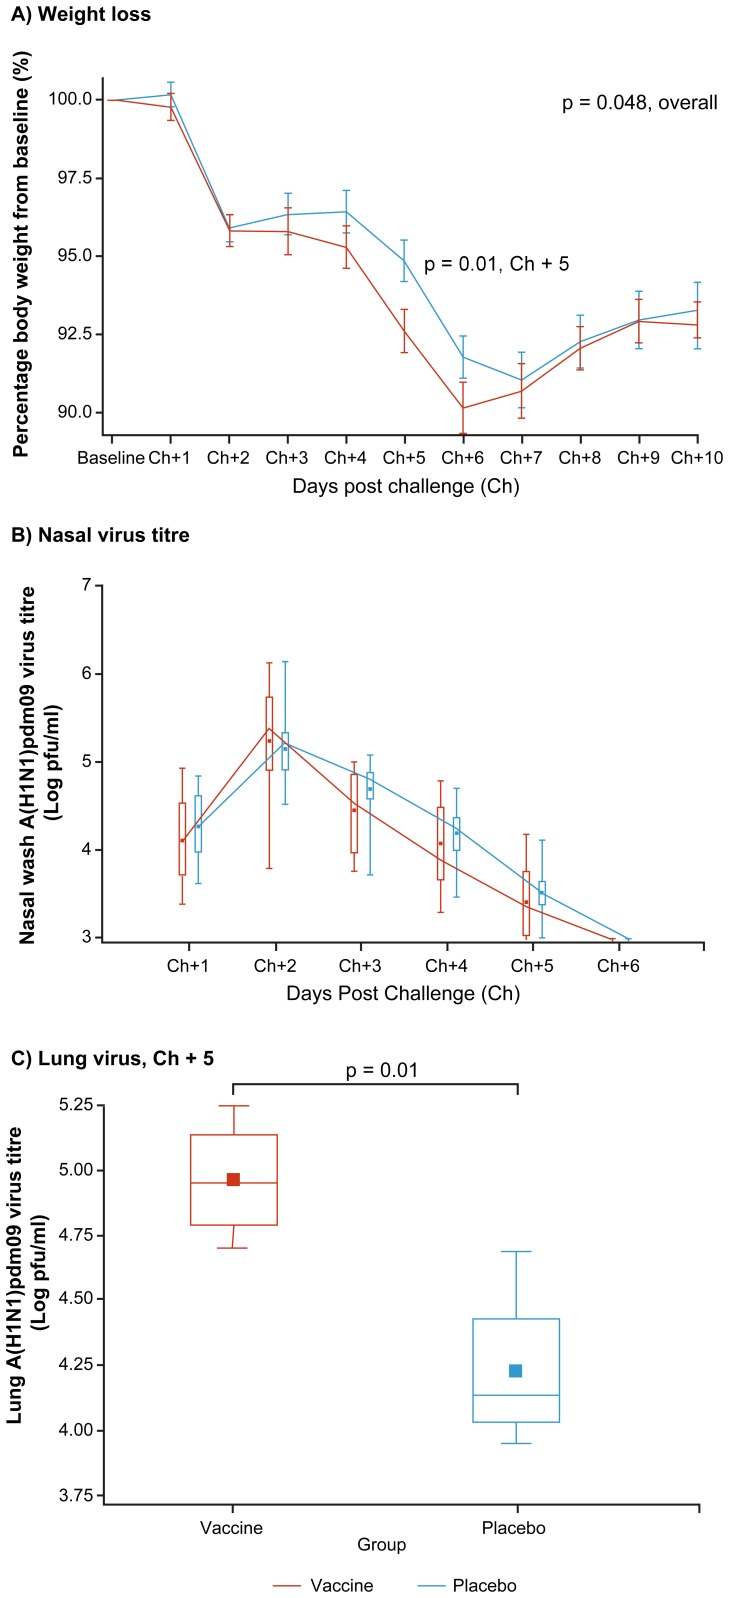
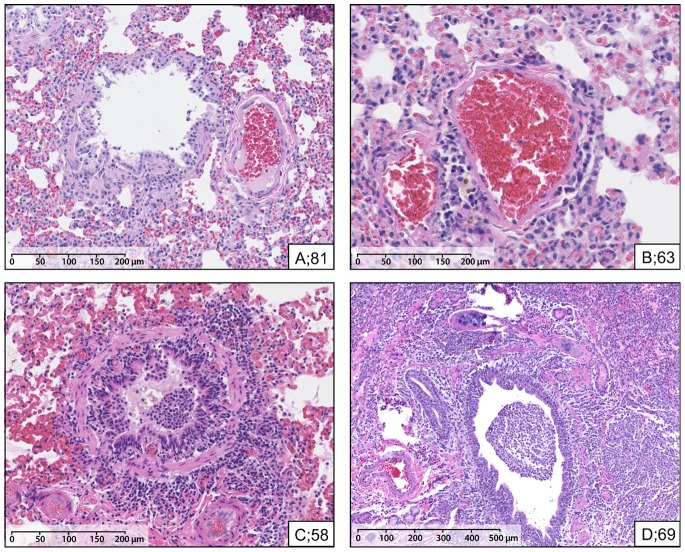
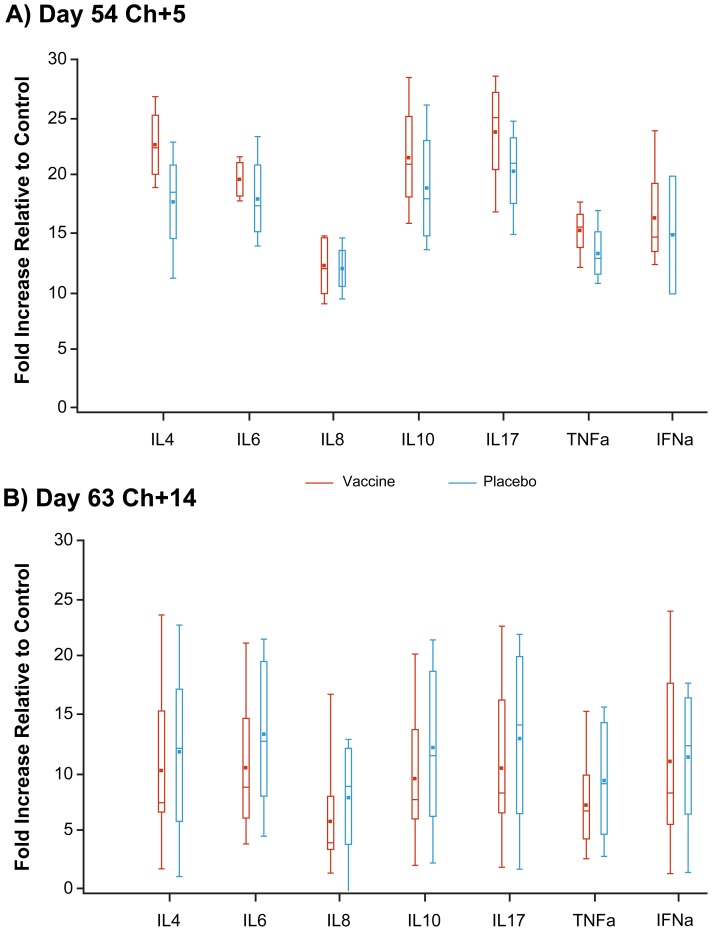
During spring-summer 2009, several observational studies from Canada showed increased risk of medically-attended, laboratory-confirmed A(H1N1)pdm09 illness among prior recipients of 2008-09 trivalent inactivated influenza vaccine (TIV). Explanatory hypotheses included direct and indirect vaccine effects. In a randomized placebo-controlled ferret study, we tested whether prior receipt of 2008-09 TIV may have directly influenced A(H1N1)pdm09 illness. Thirty-two ferrets (16/group) received 0.5 mL intra-muscular injections of the Canadian-manufactured, commercially-available, non-adjuvanted, split 2008-09 Fluviral or PBS placebo on days 0 and 28. On day 49 all animals were challenged (Ch0) with A(H1N1)pdm09. Four ferrets per group were randomly selected for sacrifice at day 5 post-challenge (Ch+5) and the rest followed until Ch+14. Sera were tested for antibody to vaccine antigens and A(H1N1)pdm09 by hemagglutination inhibition (HI), microneutralization (MN), nucleoprotein-based ELISA and HA1-based microarray assays. Clinical characteristics and nasal virus titers were recorded pre-challenge then post-challenge until sacrifice when lung virus titers, cytokines and inflammatory scores were determined. Baseline characteristics were similar between the two groups of influenza-naïve animals. Antibody rise to vaccine antigens was evident by ELISA and HA1-based microarray but not by HI or MN assays; virus challenge raised antibody to A(H1N1)pdm09 by all assays in both groups. Beginning at Ch+2, vaccinated animals experienced greater loss of appetite and weight than placebo animals, reaching the greatest between-group difference in weight loss relative to baseline at Ch+5 (7.4% vs. 5.2%; p = 0.01). At Ch+5 vaccinated animals had higher lung virus titers (log-mean 4.96 vs. 4.23pfu/mL, respectively; p = 0.01), lung inflammatory scores (5.8 vs. 2.1, respectively; p = 0.051) and cytokine levels (p>0.05). At Ch+14, both groups had recovered. Findings in influenza-naïve, systematically-infected ferrets may not replicate the human experience. While they cannot be considered conclusive to explain human observations, these ferret findings are consistent with direct, adverse effect of prior 2008-09 TIV receipt on A(H1N1)pdm09 illness. As such, they warrant further in-depth investigation and search for possible mechanistic explanations.


Conflict of interest statement

Competing Interests: The authors have the following conflicts: Gaston De Serres has received research grants from GSK and Sanofi Pasteur and received reimbursement for travel fee to attend a GSK ad hoc Advisory board meeting. Guy Boivin has received research grants from GSK and Medicago. Marion Koopmans and Erwin de Bruin have received grants from the Dutch government, from the Wellcome trust, and from the European commission. Before joining the BC Centre for Disease Control, Robert Balshaw was previously (within the last 36 months) Director of Biometrics for Syreon Corporation, a contract research organization which has conducted clinical trials on behalf of pharmaceutical companies. The other authors declare that they have no conflicts of interest to report. This does not alter the authors’ adherence to all PLOS ONE policies on sharing data and materials.

Figures

Figure 1
Figure 1. Study protocol.
Randomized blinded placebo-controlled experiment of Canadian manufactured, commercially-available 2008–09 trivalent inactivated influenza vaccine (TIV: Fluviral) on A(H1N1)pdm09 disease risk in ferrets.
Figure 2
Figure 2. HA1 microarray serological values by study antigens, group and day.
Box plots display median (dash) and mean (dot) of log10-transformed HA1 protein microarray signal values. The box extends to the 25th/75th percentiles and whiskers extend to minimum/maximum values. H1-07 indicates A/Brisbane/59/2007 (H1N1)-like; H3-07 indicates A/Brisbane/10/2007 (H3N2)-like; H1-09 indicates A/California/7/2009 (H1N1)pdm09-like (Table S3; grey-shaded). Sample size as follows: Pre-immunization Vaccine = 15, Placebo = 16 (3 ferrets each per group pre-shipment serum was substituted owing to insufficient day 0 available); Day 28 Vaccine = 14, Placebo = 15; Day 49 Vaccine = 12, Placebo = 11; Day 54 Vaccine = 2, Placebo = 4; Day 63 Vaccine = 9, Placebo = 8. **indicates statistical significance at p<0.01 and *indicates statistical significance at p<0.05 in comparing vaccine to placebo group at the designated time point. ΔΔ indicates statistical significance at p<0.01 and Δ indicates statistical significance at p<0.05 in comparing values within study groups at days 28, 49, 54 and 63 relative to pre-immunization, colour coded by vaccine (red) or placebo (blue). □□ indicates statistical significance at p<0.01 and □ indicates statistical significance at p<0.05 in comparing day 63 to day 49 within groups, colour coded per above by study group.
Figure 3
Figure 3. Clinical outcomes including weight loss, nasal wash and lung virus titers by study group and day.
Clinical outcomes are displayed including: (A) Mean percentage weight relative to baseline by study group and day, with standard errors. (B) Nasal wash virus titers by study group and day. (C) Lung homogenate virus titers at day 5 post-challenge. Box plots (B and C) display mean (dot) and median (line) virus titres as log pfu/mL. Per usual, the box extends to the 25th/75th percentiles and whiskers extend to minimum/maximum values. Ch refers to challenge day and Ch+1, Ch+2 etc indicate day post-challenge (i.e. day one post-challenge, day two post-challenge etc). Ch+5 indicates day five post-challenge on which four animals per group were randomly selected for sacrifice. Statistically significant between-group differences are as specified.
Figure 4
Figure 4. Ferret lung histology at day 5 post-challenge (Ch+5).
Salient lung histologic features (hematoxylin eosin stain micrometric scale in lower left of each panel) including vaccine and placebo ferrets with highest and lowest combined Ch+5 inflammatory scores within their group: (A) Ferret #81 (placebo; inflammatory score 0.5) indicating very mild/minimal peri-bronchial inflammation; (B) Ferret #63 (vaccinated; inflammatory score 0.5) indicating very mild/minimal peri-vascular inflammation; (C) Ferret #58 (placebo; inflammatory score 4.0) indicating moderate bronchial and mild peri-bronchial/peri-vascular inflammation; (D) Ferret #69 (vaccinated; inflammatory score 11.5) indicating severe bronchopneumonia. The increased micrometric scale in panel D reflects that the pathologic changes are marked and diffuse, best rendered at low magnification, whereas the mild to moderate and more focal changes in panels A to C necessitate photomicrographs at higher magnification. Corresponding histopathology scores are shown in Table S9.
Figure 5
Figure 5. Lung cytokine values at days 5 and 14 post-challenge with A(H1N1)pdm09 by study group.
Per usual, box plots display mean (dot) and median (dash) virus titers with box extending to the 25th/75th percentiles and whiskers extending to minimum/maximum values. Cytokine values relative to control are displayed at (A) day 5 post challenge (Ch+5) on which four animals per group were randomly selected for sacrifice and (B) day 14 post-challenge (Ch+14) on which the remaining 12 animals per group were sacrificed. Thus, at Ch+5, n = 4 (except IFN alpha for which n = 2 for placebo group) and at Ch+14, n = 12.

Similar articles

Cited by

References

    1. Skowronski DM, De Serres G, Crowcroft NS, Janjua NZ, Boulianne N, et al. (2010) Association between the 2008–09 seasonal influenza vaccine and pandemic H1N1 illness during spring-summer 2009: Four observational studies from Canada. PLoS Med 7(4): e1000258 10.1371/journal.pmed.1000258 - DOI - PMC - PubMed
    1. Janjua NZ, Skowronski DM, Hottes TS, Osei W, Adams E, et al. (2010) Seasonal influenza vaccine and increased risk of pandemic A/H1N1-related illness: first detection of the association in British Columbia, Canada. Clin Infect Dis 51: 1017–1027. - PMC - PubMed
    1. Crum-Cianflone NF, Blair PJ, Faix D, Arnold J, Echols S, et al. (2009) Clinical and epidemiologic characteristics of an outbreak of novel H1N1 (swine origin) influenza A virus among United States military beneficiaries. Clin Infect Dis 49: 1801–1810. - PMC - PubMed
    1. Tsuchihashi Y, Sunagawa T, Yahata Y, Takahashi H, Toyokawa T, et al. (2012) Association between seasonal influenza vaccination in 2008–2009 and pandemic influenza A (H1N1) 2009 infection among school students from Kobe, Japan, April-June 2009. Clin Infect Dis 54: 381–383. - PubMed
    1. Gilca R, Deceuninck G, De Serres G, Boulianne N, Sauvageau C, et al. (2011) Effectiveness of pandemic H1N1 vaccine against influenza-related hospitalization in children. Pediatrics 128: e1084–1091. - PubMed

Publication types

MeSH terms