

Transcriptomic meta-analysis of multiple sclerosis and its experimental models
- PMID: 24475162
- PMCID: PMC3903571
- DOI: 10.1371/journal.pone.0086643
Transcriptomic meta-analysis of multiple sclerosis and its experimental models
Abstract
Background: Multiple microarray analyses of multiple sclerosis (MS) and its experimental models have been published in the last years.
Objective: Meta-analyses integrate the information from multiple studies and are suggested to be a powerful approach in detecting highly relevant and commonly affected pathways.
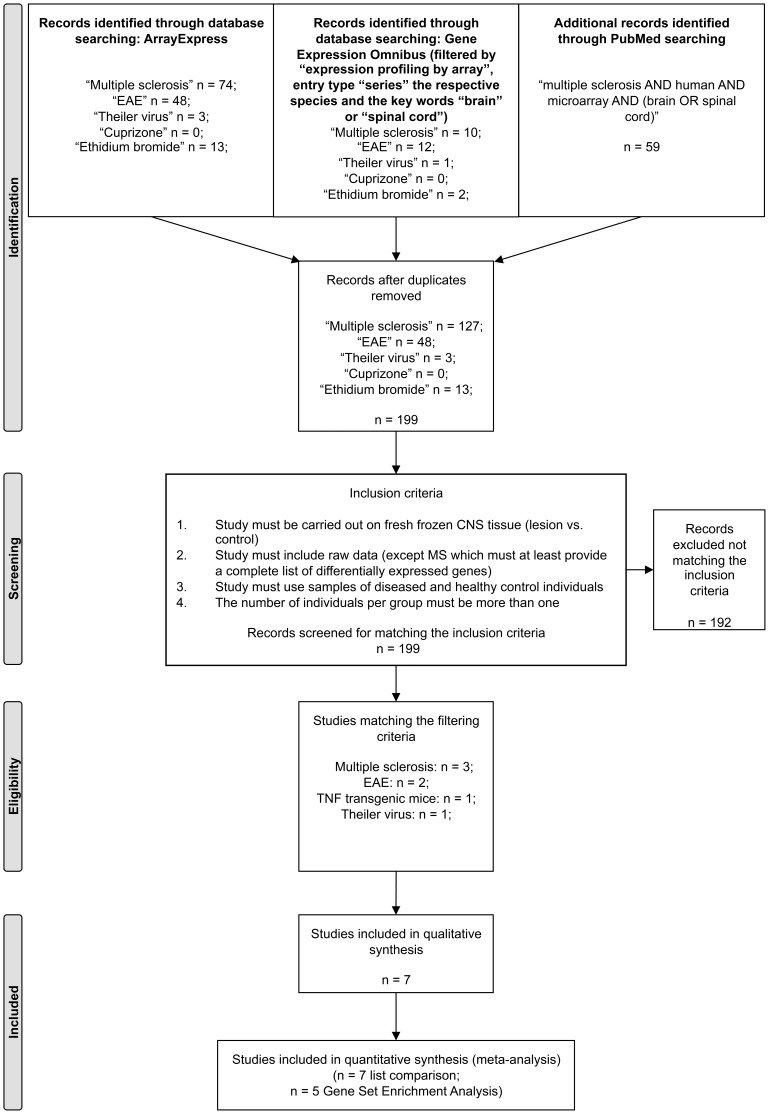
Data sources: ArrayExpress, Gene Expression Omnibus and PubMed databases were screened for microarray gene expression profiling studies of MS and its experimental animal models.
Study eligibility criteria: Studies comparing central nervous system (CNS) samples of diseased versus healthy individuals with n >1 per group and publically available raw data were selected.
Material and methods: Included conditions for re-analysis of differentially expressed genes (DEGs) were MS, myelin oligodendrocyte glycoprotein-induced experimental autoimmune encephalomyelitis (EAE) in rats, proteolipid protein-induced EAE in mice, Theiler's murine encephalomyelitis virus-induced demyelinating disease (TMEV-IDD), and a transgenic tumor necrosis factor-overexpressing mouse model (TNFtg). Since solely a single MS raw data set fulfilled the inclusion criteria, a merged list containing the DEGs from two MS-studies was additionally included. Cross-study analysis was performed employing list comparisons of DEGs and alternatively Gene Set Enrichment Analysis (GSEA).
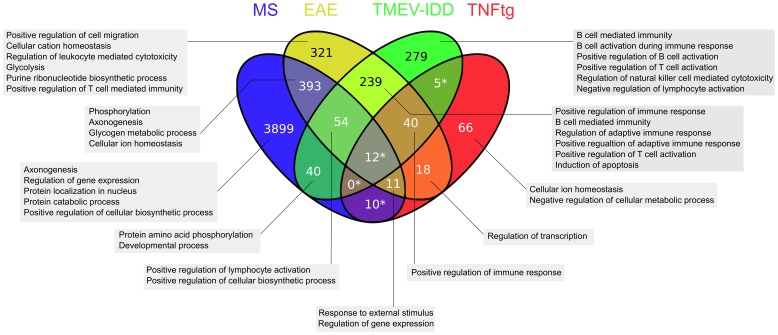
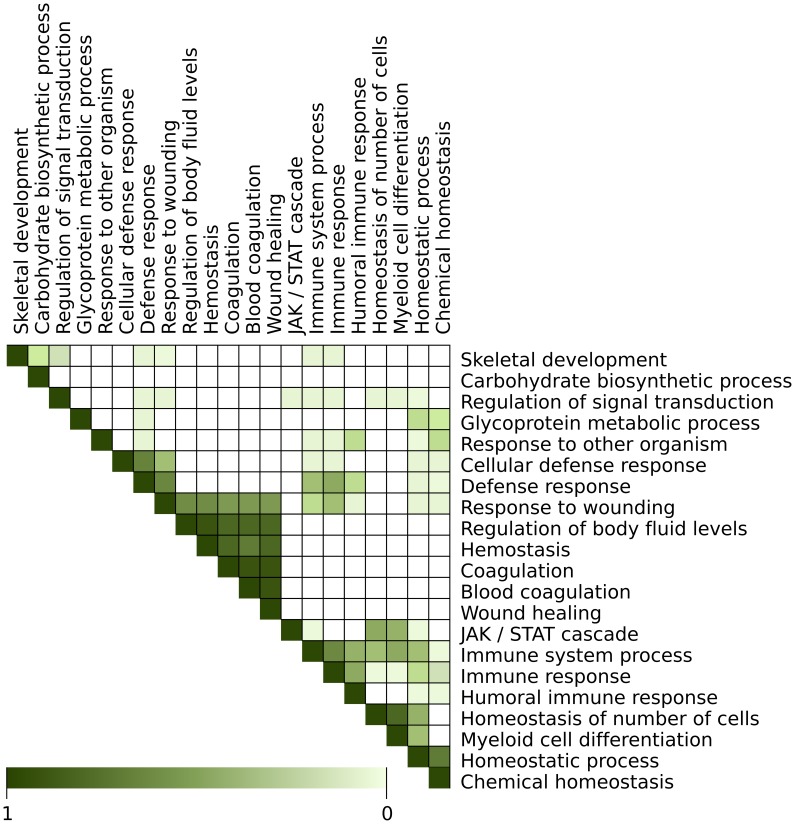
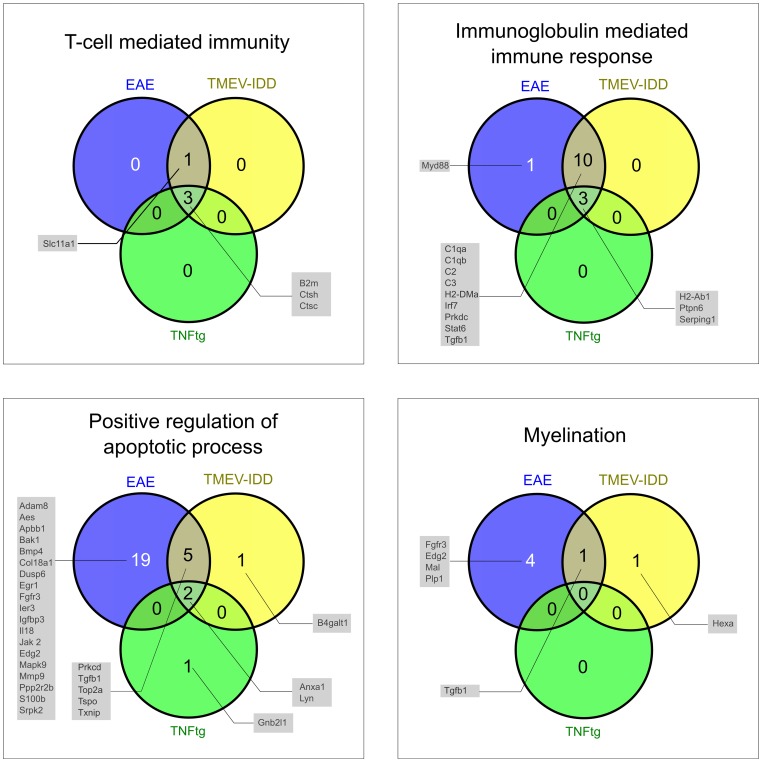
Results: The intersection of DEGs in MS, EAE, TMEV-IDD, and TNFtg contained 12 genes related to macrophage functions. The intersection of EAE, TMEV-IDD and TNFtg comprised 40 DEGs, functionally related to positive regulation of immune response. Over and above, GSEA identified substantially more differentially regulated pathways including coagulation and JAK/STAT-signaling.
Conclusion: A meta-analysis based on a simple comparison of DEGs is over-conservative. In contrast, the more experimental GSEA approach identified both, a priori anticipated as well as promising new candidate pathways.
Conflict of interest statement
Figures
Similar articles
-
Two models of multiple sclerosis: experimental allergic encephalomyelitis (EAE) and Theiler's murine encephalomyelitis virus (TMEV) infection. A pathological and immunological comparison.Microsc Res Tech. 1995 Oct 15;32(3):215-29. doi: 10.1002/jemt.1070320305. Microsc Res Tech. 1995. PMID: 8527856 Free PMC article. Review.
-
Differential neuro-immune patterns in two clinically relevant murine models of multiple sclerosis.J Neuroinflammation. 2019 May 22;16(1):109. doi: 10.1186/s12974-019-1501-9. J Neuroinflammation. 2019. PMID: 31118079 Free PMC article.
-
Mouse models of multiple sclerosis: experimental autoimmune encephalomyelitis and Theiler's virus-induced demyelinating disease.Methods Mol Med. 2004;102:339-61. doi: 10.1385/1-59259-805-6:339. Methods Mol Med. 2004. PMID: 15286394
-
The role of α4 integrin in Theiler's murine encephalomyelitis virus (TMEV)-induced demyelinating disease: an infectious animal model for multiple sclerosis (MS).Int Immunol. 2016 Dec;28(12):575-584. doi: 10.1093/intimm/dxw045. Epub 2016 Nov 1. Int Immunol. 2016. PMID: 27803063 Free PMC article.
-
Two models for multiple sclerosis: experimental allergic encephalomyelitis and Theiler's murine encephalomyelitis virus.J Neuropathol Exp Neurol. 1996 Jun;55(6):673-86. doi: 10.1097/00005072-199606000-00001. J Neuropathol Exp Neurol. 1996. PMID: 8642393 Review.
Cited by
-
The immune response in the CNS in Theiler's virus induced demyelinating disease switches from an early adaptive response to a chronic innate-like response.J Neurovirol. 2016 Feb;22(1):66-79. doi: 10.1007/s13365-015-0369-4. Epub 2015 Aug 11. J Neurovirol. 2016. PMID: 26260496
-
Morphologic, phenotypic, and transcriptomic characterization of classically and alternatively activated canine blood-derived macrophages in vitro.PLoS One. 2017 Aug 17;12(8):e0183572. doi: 10.1371/journal.pone.0183572. eCollection 2017. PLoS One. 2017. PMID: 28817687 Free PMC article.
-
Phospholipase D Family Member 4 Regulates Microglial Phagocytosis and Remyelination via the AKT Pathway in a Cuprizone-Induced Multiple Sclerosis Mouse Model.CNS Neurosci Ther. 2024 Nov;30(11):e70111. doi: 10.1111/cns.70111. CNS Neurosci Ther. 2024. PMID: 39548665 Free PMC article.
-
Extracellular cues influencing oligodendrocyte differentiation and (re)myelination.Exp Neurol. 2016 Sep;283(Pt B):512-30. doi: 10.1016/j.expneurol.2016.03.019. Epub 2016 Mar 23. Exp Neurol. 2016. PMID: 27016069 Free PMC article. Review.
-
Delayed Astrogliosis Associated with Reduced M1 Microglia Activation in Matrix Metalloproteinase 12 Knockout Mice during Theiler's Murine Encephalomyelitis.Int J Mol Sci. 2019 Apr 5;20(7):1702. doi: 10.3390/ijms20071702. Int J Mol Sci. 2019. PMID: 30959793 Free PMC article.
References
-
- Comabella M, Martin R (2007) Genomics in multiple sclerosis - Current state and future directions. J Neuroimmunol 187: 1–8. - PubMed
-
- Lindberg RLP, De Groot CJA, Certa U, Ravid R, Hoffmann F, et al. (2004) Multiple sclerosis as a generalized CNS disease - comparative microarray analysis of normal appearing white matter and lesions in secondary progressive MS. J Neuroimmunol 152: 154–167. - PubMed
Publication types
MeSH terms
Substances
LinkOut - more resources
Full Text Sources
Other Literature Sources
Medical
