

Evaluation of hyperpolarized [1-¹³C]-pyruvate by magnetic resonance to detect ionizing radiation effects in real time
- PMID: 24475215
- PMCID: PMC3903593
- DOI: 10.1371/journal.pone.0087031
Evaluation of hyperpolarized [1-¹³C]-pyruvate by magnetic resonance to detect ionizing radiation effects in real time
Abstract
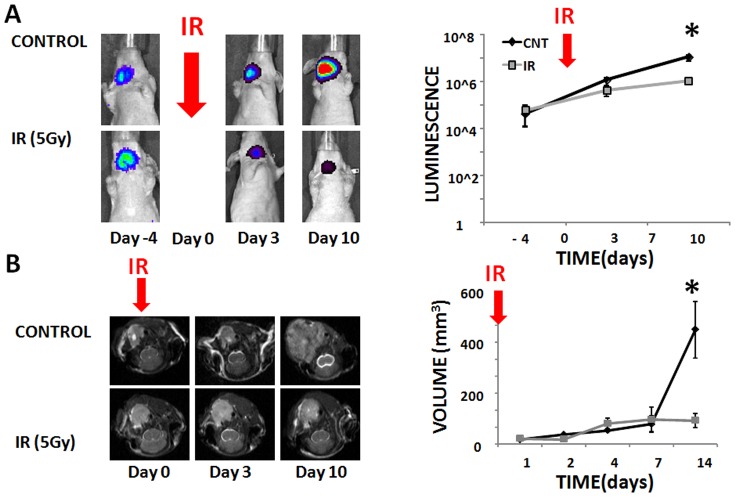
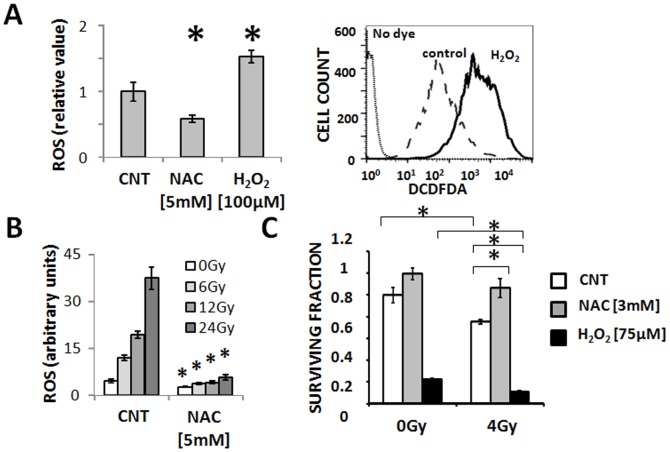
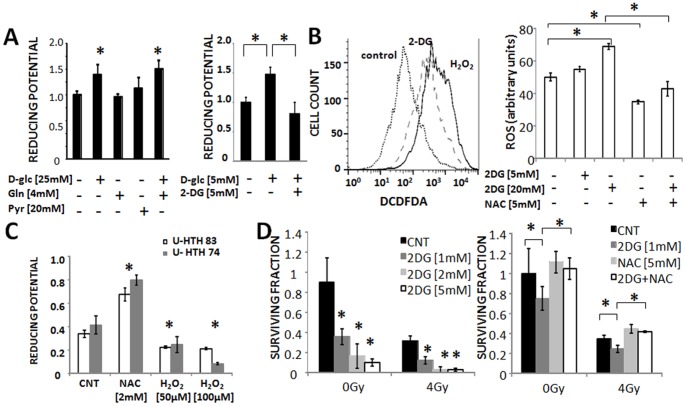
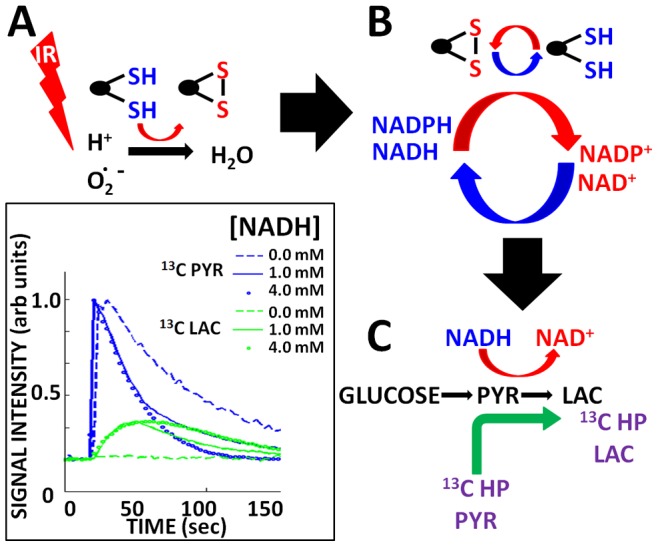
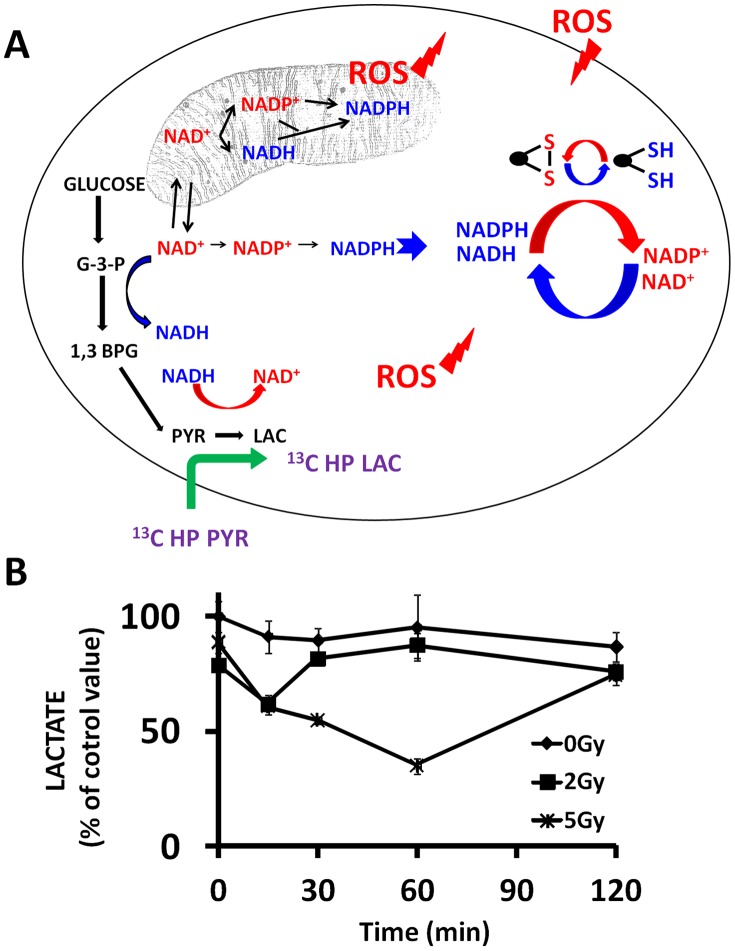
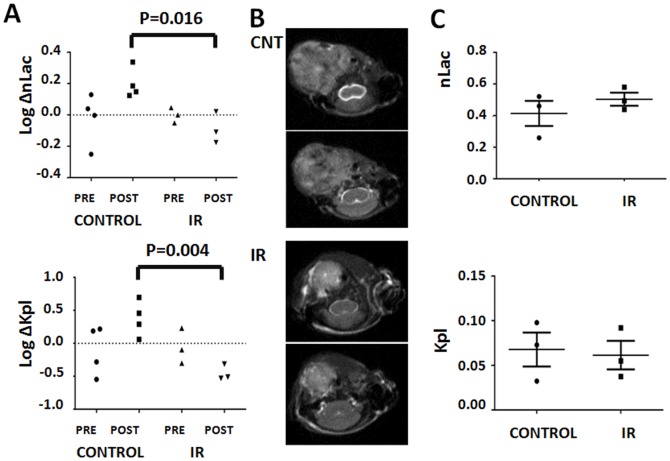
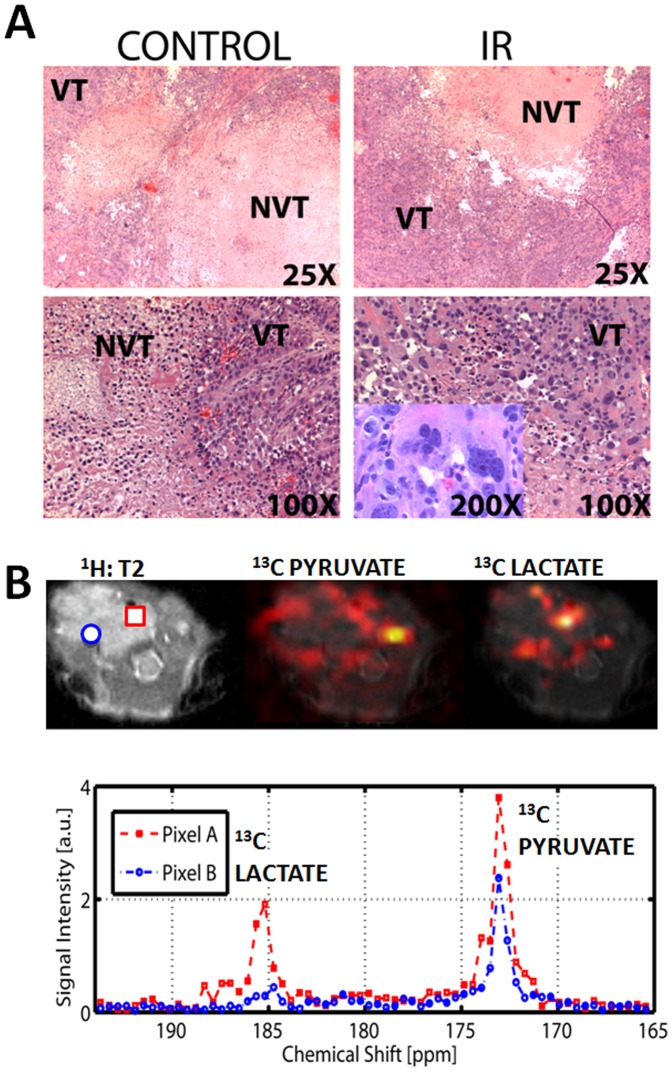
Ionizing radiation (IR) cytotoxicity is primarily mediated through reactive oxygen species (ROS). Since tumor cells neutralize ROS by utilizing reducing equivalents, we hypothesized that measurements of reducing potential using real-time hyperpolarized (HP) magnetic resonance spectroscopy (MRS) and spectroscopic imaging (MRSI) can serve as a surrogate marker of IR induced ROS. This hypothesis was tested in a pre-clinical model of anaplastic thyroid carcinoma (ATC), an aggressive head and neck malignancy. Human ATC cell lines were utilized to test IR effects on ROS and reducing potential in vitro and [1-¹³C] pyruvate HP-MRS/MRSI imaging of ATC orthotopic xenografts was used to study in vivo effects of IR. IR increased ATC intra-cellular ROS levels resulting in a corresponding decrease in reducing equivalent levels. Exogenous manipulation of cellular ROS and reducing equivalent levels altered ATC radiosensitivity in a predictable manner. Irradiation of ATC xenografts resulted in an acute drop in reducing potential measured using HP-MRS, reflecting the shunting of reducing equivalents towards ROS neutralization. Residual tumor tissue post irradiation demonstrated heterogeneous viability. We have adapted HP-MRS/MRSI to non-invasively measure IR mediated changes in tumor reducing potential in real time. Continued development of this technology could facilitate the development of an adaptive clinical algorithm based on real-time adjustments in IR dose and dose mapping.
Conflict of interest statement
Figures
Similar articles
-
Offset of apparent hyperpolarized 13 C lactate flux by the use of adjuvant metformin in ionizing radiation therapy in vivo.NMR Biomed. 2021 Aug;34(8):e4561. doi: 10.1002/nbm.4561. Epub 2021 Jun 3. NMR Biomed. 2021. PMID: 34080736 Free PMC article.
-
Hyperpolarized [1-13C]pyruvate-to-[1-13C]lactate conversion is rate-limited by monocarboxylate transporter-1 in the plasma membrane.Proc Natl Acad Sci U S A. 2020 Sep 8;117(36):22378-22389. doi: 10.1073/pnas.2003537117. Epub 2020 Aug 24. Proc Natl Acad Sci U S A. 2020. PMID: 32839325 Free PMC article.
-
Acute Tumor Lactate Perturbations as a Biomarker of Genotoxic Stress: Development of a Biochemical Model.Mol Cancer Ther. 2015 Dec;14(12):2901-8. doi: 10.1158/1535-7163.MCT-15-0217. Epub 2015 Sep 16. Mol Cancer Ther. 2015. PMID: 26376962 Free PMC article.
-
Hyperpolarized carbon-13 magnetic resonance spectroscopic imaging: a clinical tool for studying tumour metabolism.Br J Radiol. 2018 May;91(1085):20170688. doi: 10.1259/bjr.20170688. Epub 2018 Jan 19. Br J Radiol. 2018. PMID: 29293376 Free PMC article. Review.
-
Bio-positive effects of ionizing radiation on pollen: The role of ROS.Physiol Plant. 2024 Jan-Feb;176(1):e14163. doi: 10.1111/ppl.14163. Physiol Plant. 2024. PMID: 39141204 Review.
Cited by
-
Metabolic interrogation as a tool to optimize chemotherapeutic regimens.Oncotarget. 2017 Mar 14;8(11):18154-18165. doi: 10.18632/oncotarget.15186. Oncotarget. 2017. PMID: 28184025 Free PMC article.
-
Mitochondrial Metabolism as a Treatment Target in Anaplastic Thyroid Cancer.Semin Oncol. 2015 Dec;42(6):915-22. doi: 10.1053/j.seminoncol.2015.09.025. Epub 2015 Sep 24. Semin Oncol. 2015. PMID: 26615136 Free PMC article.
-
Emerging Magnetic Resonance Imaging Technologies for Radiation Therapy Planning and Response Assessment.Int J Radiat Oncol Biol Phys. 2018 Aug 1;101(5):1046-1056. doi: 10.1016/j.ijrobp.2018.03.028. Epub 2018 Mar 30. Int J Radiat Oncol Biol Phys. 2018. PMID: 30012524 Free PMC article. Review.
-
High-throughput hyperpolarized (13)C metabolic investigations using a multi-channel acquisition system.J Magn Reson. 2015 Nov;260:20-7. doi: 10.1016/j.jmr.2015.08.025. Epub 2015 Sep 5. J Magn Reson. 2015. PMID: 26397217 Free PMC article.
-
Magnetic resonance biomarkers in radiation oncology: The report of AAPM Task Group 294.Med Phys. 2021 Jul;48(7):e697-e732. doi: 10.1002/mp.14884. Epub 2021 May 20. Med Phys. 2021. PMID: 33864283 Free PMC article.
References
-
- Bhatia A, Rao A, Ang KK, Garden AS, Morrison WH, et al. (2010) Anaplastic thyroid cancer: Clinical outcomes with conformal radiotherapy. Head Neck 32: 829–836. - PubMed
-
- Forastiere AA, Trotti A, Pfister DG, Grandis JR (2006) Head and neck cancer: recent advances and new standards of care. J Clin Oncol 24: 2603–2605. - PubMed
Publication types
MeSH terms
Substances
Grants and funding
LinkOut - more resources
Full Text Sources
Other Literature Sources
Medical
Research Materials
Miscellaneous
