

An upregulation in the expression of vanilloid transient potential channels 2 enhances hypotonicity-induced cytosolic Ca²⁺ rise in human induced pluripotent stem cell model of Hutchinson-Gillford Progeria
- PMID: 24475260
- PMCID: PMC3903625
- DOI: 10.1371/journal.pone.0087273
An upregulation in the expression of vanilloid transient potential channels 2 enhances hypotonicity-induced cytosolic Ca²⁺ rise in human induced pluripotent stem cell model of Hutchinson-Gillford Progeria
Abstract
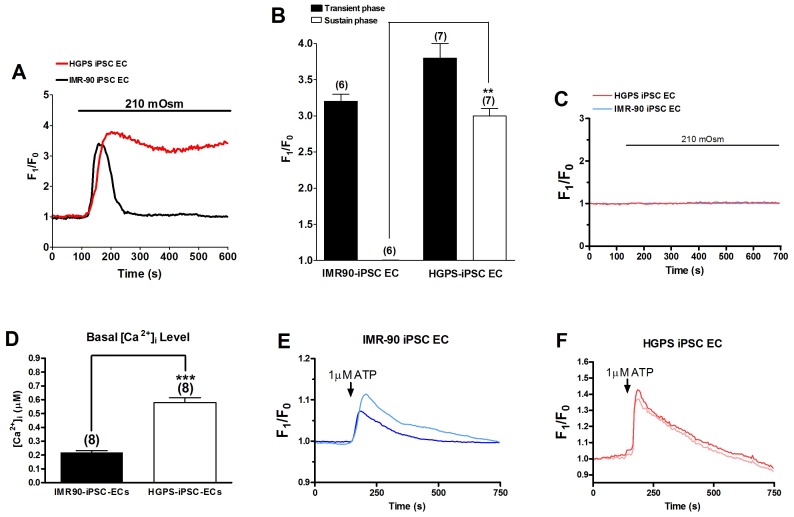
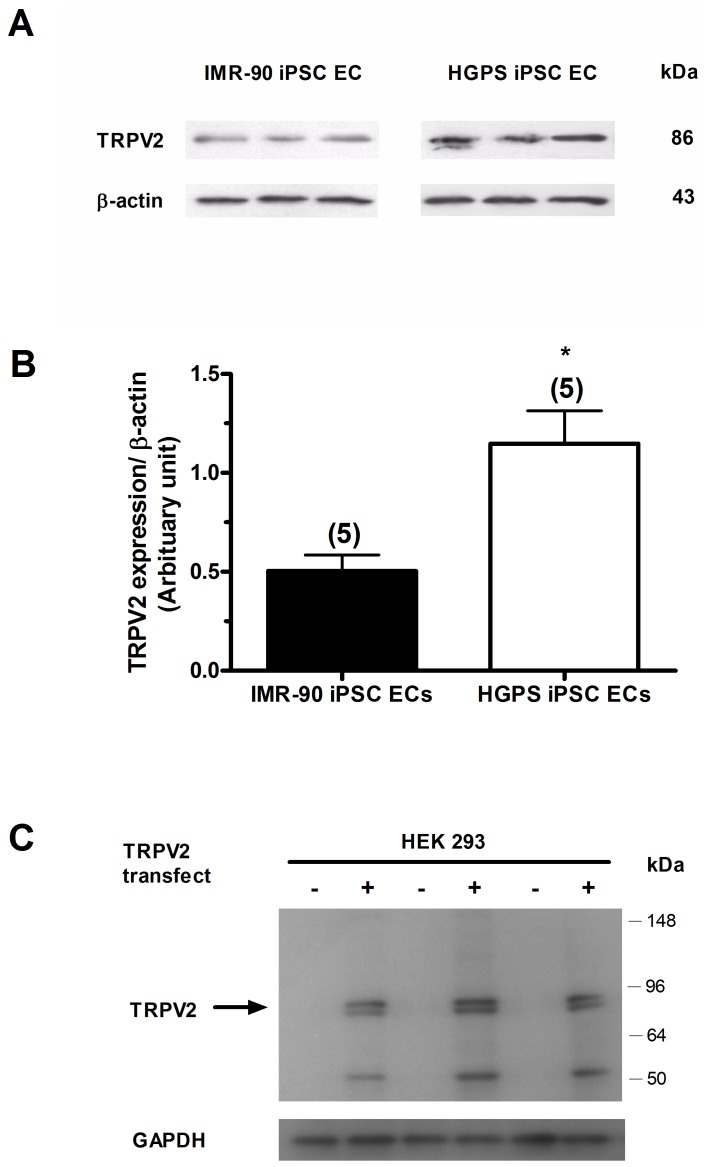
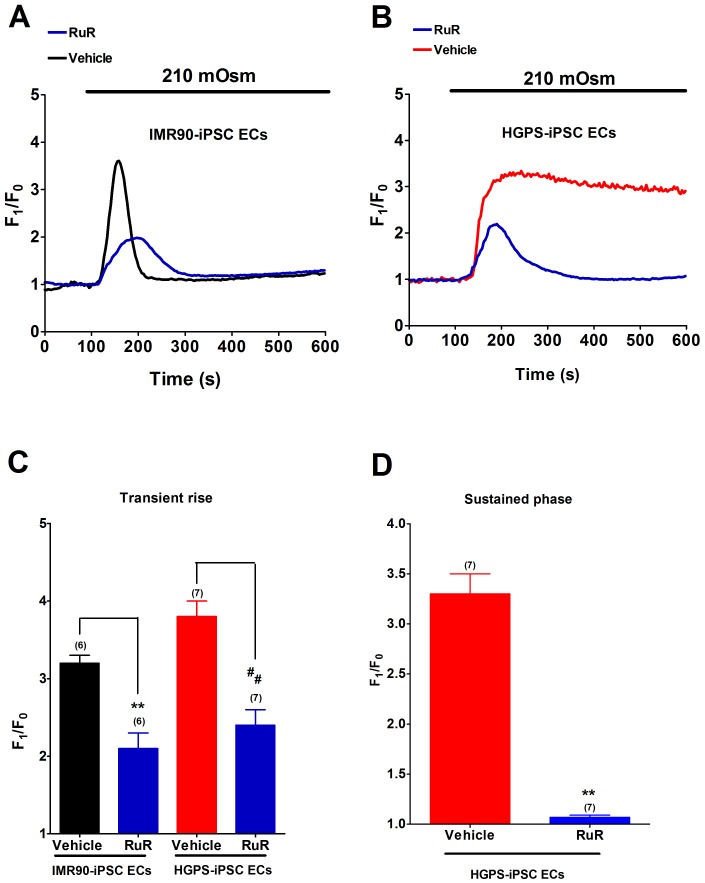
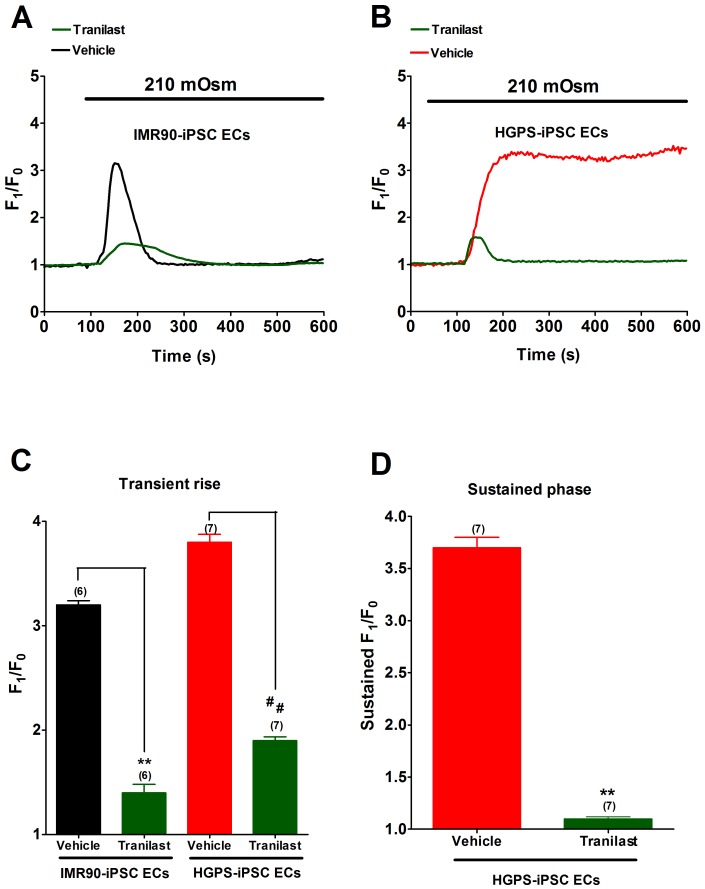
Hutchinson-Gillford Progeria Syndrome (HGPS) is a fatal genetic disorder characterized by premature aging in multiple organs including the skin, musculoskeletal and cardiovascular systems. It is believed that an increased mechanosensitivity of HGPS cells is a causative factor for vascular cell death and vascular diseases in HGPS patients. However, the exact mechanism is unknown. Transient receptor potential (TRP) channels are cationic channels that can act as cellular sensors for mechanical stimuli. The aim of this present study was to examine the expression and functional role of TRP channels in human induced pluripotent stem cell-derived endothelial cells (iPSC-ECs) from the patients with HGPS. The mRNA and protein expression of TRP channels in HGPS and control (IMR90) iPSC-ECs were examined by semi-quantitative RT-PCRs and immunoblots, respectively. Hypotonicity-induced cytosolic Ca²⁺ ([Ca²⁺](i)) rise in iPSC-ECs was measured by confocal microscopy. RT-PCRs and immunoblots showed higher expressional levels of TRPV2 in iPSC-ECs from HGPS patients than those from normal individuals. In functional studies, hypotonicity induced a transient [Ca²⁺](i) rise in iPSC-ECs from normal individuals but a sustained [Ca²⁺](i) elevation in iPSC-ECs from HGPS patients. A nonselective TRPV inhibitor, ruthenium red (RuR, 20 µM), and a specific TRPV2 channel inhibitor, tranilast (100 µM), abolished the sustained phase of hypotonicity-induced [Ca²⁺](i) rise in iPSC-ECs from HGPS patients, and also markedly attenuated the transient phase of the [Ca²⁺](i) rise in these cells. Importantly, a short 10 min hypotonicity treatment caused a substantial increase in caspase 8 activity in iPSC-ECs from HGPS patients but not in cells from normal individuals. Tranilast could also inhibit the hypotonicity-induced increase in caspase 8 activity. Taken together, our data suggest that an up-regulation in TRPV2 expression causes a sustained [Ca²⁺](i) elevation in HGPS-iPSC-ECs under hypotonicity, consequently resulting in apoptotic cell death. This mechanism may contribute to the pathogenesis of vascular diseases in HGPS patients.
Conflict of interest statement
Figures


Similar articles
-
Dysfunction of iPSC-derived endothelial cells in human Hutchinson-Gilford progeria syndrome.Cell Cycle. 2019 Oct;18(19):2495-2508. doi: 10.1080/15384101.2019.1651587. Epub 2019 Aug 14. Cell Cycle. 2019. PMID: 31411525 Free PMC article.
-
Mechanisms of angiogenic incompetence in Hutchinson-Gilford progeria via downregulation of endothelial NOS.Aging Cell. 2021 Jul;20(7):e13388. doi: 10.1111/acel.13388. Epub 2021 Jun 4. Aging Cell. 2021. PMID: 34086398 Free PMC article.
-
TRPV2 channels mediate insulin secretion induced by cell swelling in mouse pancreatic β-cells.Am J Physiol Cell Physiol. 2019 Mar 1;316(3):C434-C443. doi: 10.1152/ajpcell.00210.2017. Epub 2019 Jan 16. Am J Physiol Cell Physiol. 2019. PMID: 30649920
-
Hutchinson-Gilford progeria syndrome as a model for vascular aging.Biogerontology. 2016 Feb;17(1):129-45. doi: 10.1007/s10522-015-9602-z. Epub 2015 Sep 2. Biogerontology. 2016. PMID: 26330290 Review.
-
Pluripotent stem cells to model Hutchinson-Gilford progeria syndrome (HGPS): Current trends and future perspectives for drug discovery.Ageing Res Rev. 2015 Nov;24(Pt B):343-8. doi: 10.1016/j.arr.2015.10.002. Epub 2015 Oct 22. Ageing Res Rev. 2015. PMID: 26474742 Review.
Cited by
-
Universal multilayer network embedding reveals a causal link between GABA neurotransmitter and cancer.BMC Bioinformatics. 2025 Jun 2;26(1):149. doi: 10.1186/s12859-025-06158-5. BMC Bioinformatics. 2025. PMID: 40457205 Free PMC article.
-
Differential stem cell aging kinetics in Hutchinson-Gilford progeria syndrome and Werner syndrome.Protein Cell. 2018 Apr;9(4):333-350. doi: 10.1007/s13238-018-0517-8. Epub 2018 Feb 23. Protein Cell. 2018. PMID: 29476423 Free PMC article.
-
Endoplasmic reticulum stress at the crossroads of progeria and atherosclerosis.EMBO Mol Med. 2019 Apr;11(4):e10360. doi: 10.15252/emmm.201910360. EMBO Mol Med. 2019. PMID: 30902910 Free PMC article.
-
High-Throughput Screen Detects Calcium Signaling Dysfunction in Hutchinson-Gilford Progeria Syndrome.Int J Mol Sci. 2021 Jul 7;22(14):7327. doi: 10.3390/ijms22147327. Int J Mol Sci. 2021. PMID: 34298947 Free PMC article.
-
Endothelial cell-specific progerin expression does not cause cardiovascular alterations and premature death.Aging Cell. 2025 Feb;24(2):e14389. doi: 10.1111/acel.14389. Epub 2024 Oct 31. Aging Cell. 2025. PMID: 39479939 Free PMC article.
References
Publication types
MeSH terms
Substances
LinkOut - more resources
Full Text Sources
Other Literature Sources
Miscellaneous
