

Embryonic caffeine exposure acts via A1 adenosine receptors to alter adult cardiac function and DNA methylation in mice
- PMID: 24475304
- PMCID: PMC3903656
- DOI: 10.1371/journal.pone.0087547
Embryonic caffeine exposure acts via A1 adenosine receptors to alter adult cardiac function and DNA methylation in mice
Erratum in
- PLoS One. 2014;9(5):e97212
Abstract
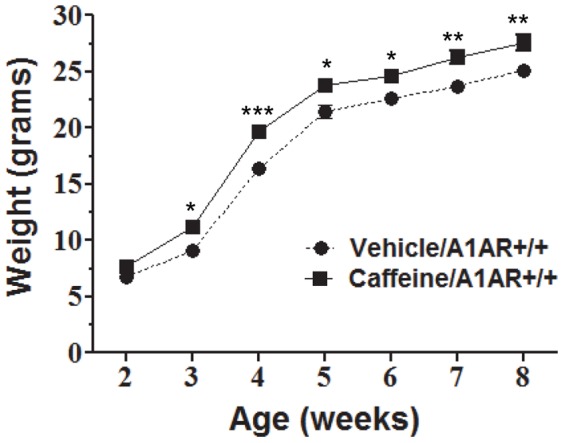
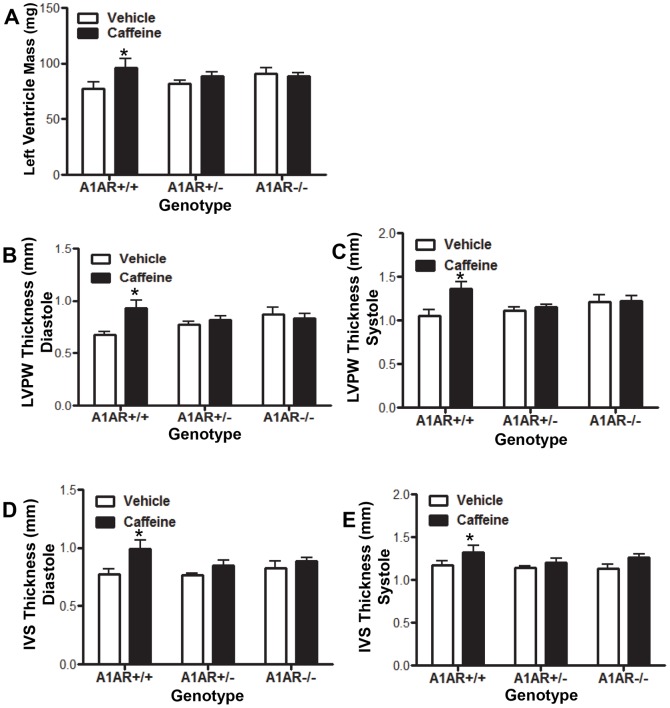
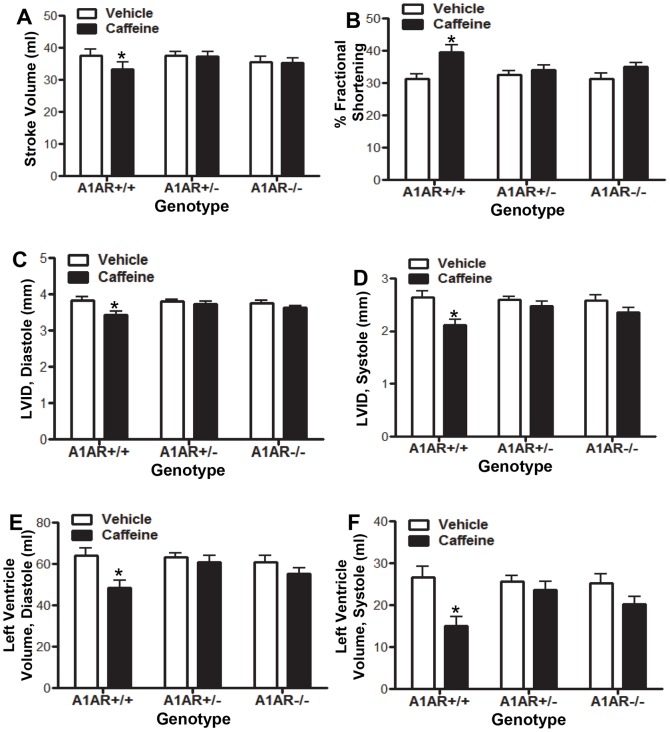
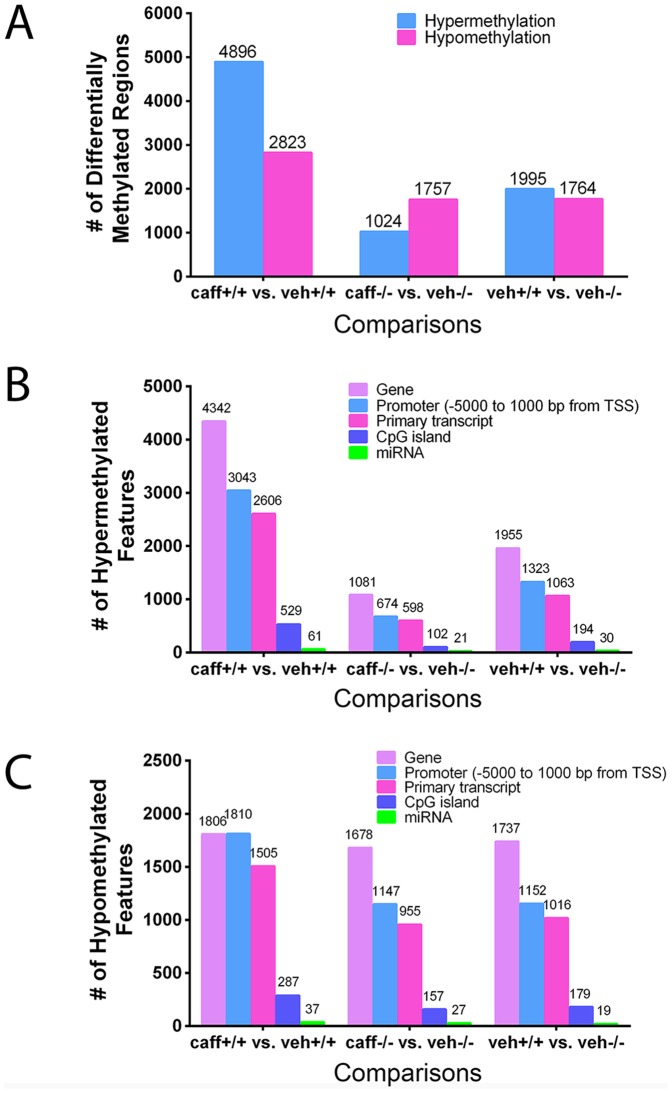
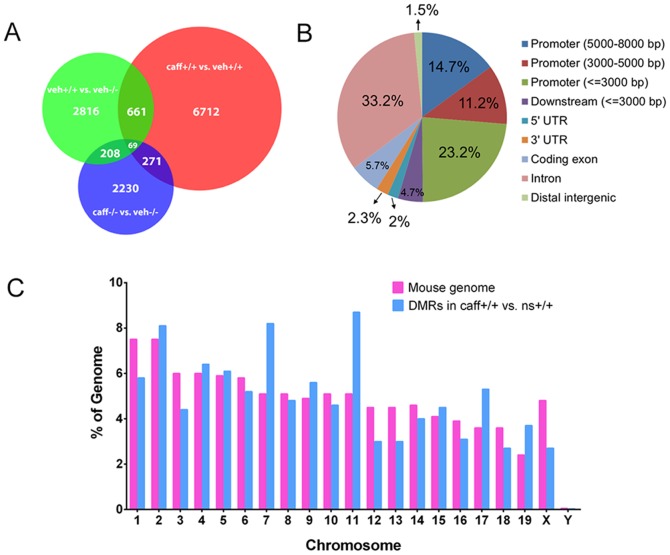
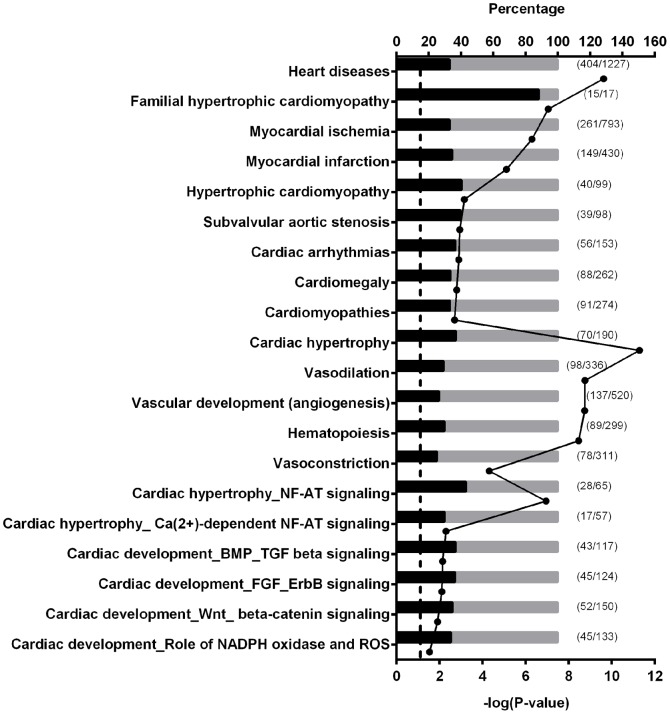
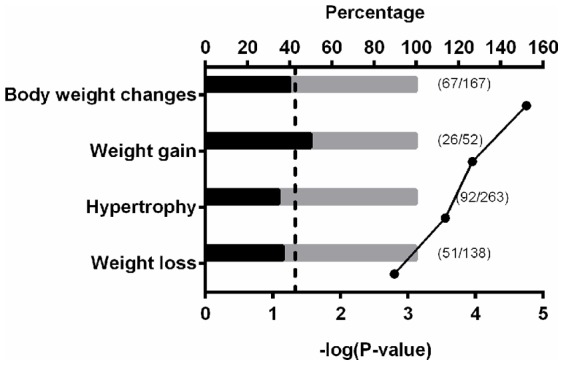
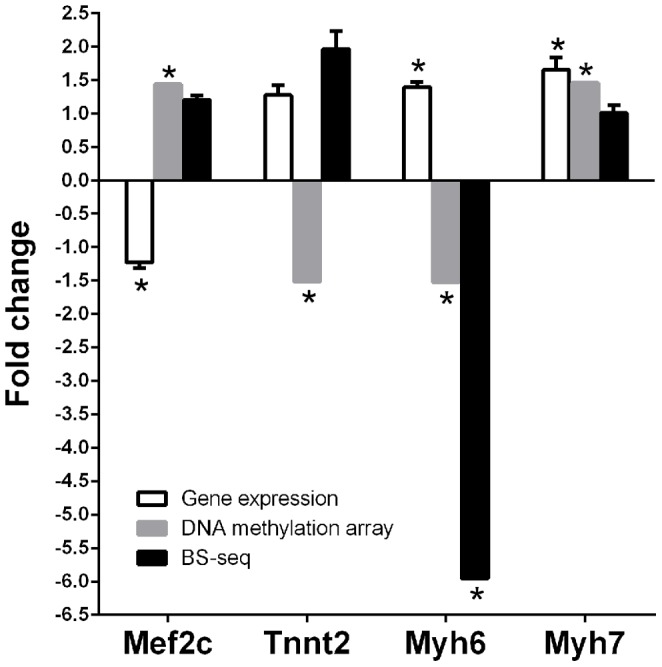
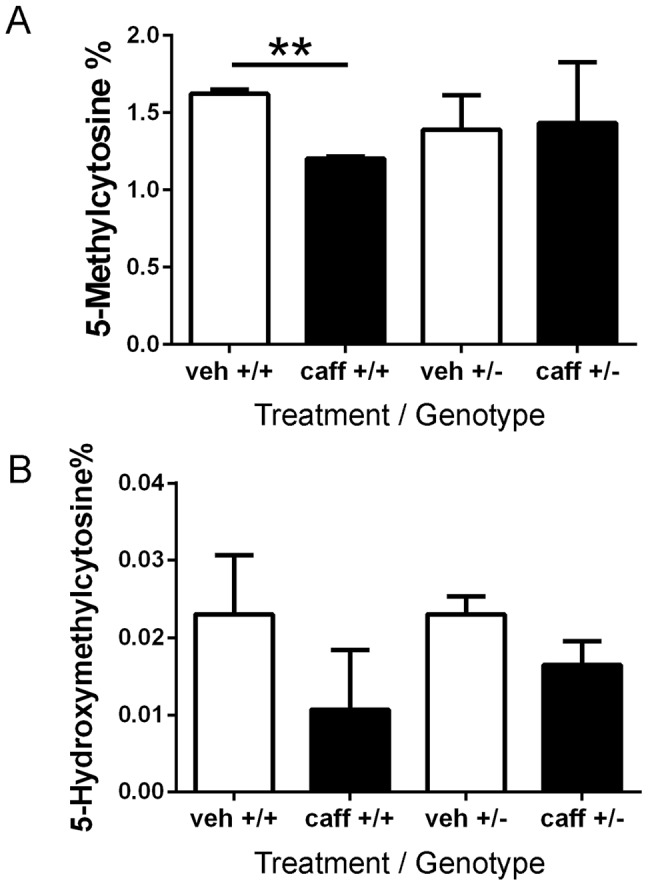
Evidence indicates that disruption of normal prenatal development influences an individual's risk of developing obesity and cardiovascular disease as an adult. Thus, understanding how in utero exposure to chemical agents leads to increased susceptibility to adult diseases is a critical health related issue. Our aim was to determine whether adenosine A1 receptors (A1ARs) mediate the long-term effects of in utero caffeine exposure on cardiac function and whether these long-term effects are the result of changes in DNA methylation patterns in adult hearts. Pregnant A1AR knockout mice were treated with caffeine (20 mg/kg) or vehicle (0.09% NaCl) i.p. at embryonic day 8.5. This caffeine treatment results in serum levels equivalent to the consumption of 2-4 cups of coffee in humans. After dams gave birth, offspring were examined at 8-10 weeks of age. A1AR+/+ offspring treated in utero with caffeine were 10% heavier than vehicle controls. Using echocardiography, we observed altered cardiac function and morphology in adult mice exposed to caffeine in utero. Caffeine treatment decreased cardiac output by 11% and increased left ventricular wall thickness by 29% during diastole. Using DNA methylation arrays, we identified altered DNA methylation patterns in A1AR+/+ caffeine treated hearts, including 7719 differentially methylated regions (DMRs) within the genome and an overall decrease in DNA methylation of 26%. Analysis of genes associated with DMRs revealed that many are associated with cardiac hypertrophy. These data demonstrate that A1ARs mediate in utero caffeine effects on cardiac function and growth and that caffeine exposure leads to changes in DNA methylation.
Conflict of interest statement
Figures
Similar articles
-
Caffeine acts via A1 adenosine receptors to disrupt embryonic cardiac function.PLoS One. 2011;6(12):e28296. doi: 10.1371/journal.pone.0028296. Epub 2011 Dec 2. PLoS One. 2011. PMID: 22164264 Free PMC article.
-
Long-term consequences of disrupting adenosine signaling during embryonic development.Mol Aspects Med. 2017 Jun;55:110-117. doi: 10.1016/j.mam.2017.02.001. Epub 2017 Feb 13. Mol Aspects Med. 2017. PMID: 28202385 Free PMC article. Review.
-
Embryonic caffeine exposure induces adverse effects in adulthood.FASEB J. 2009 Apr;23(4):1272-8. doi: 10.1096/fj.08-124941. Epub 2008 Dec 16. FASEB J. 2009. PMID: 19088180 Free PMC article.
-
Caffeine exposure alters cardiac gene expression in embryonic cardiomyocytes.Am J Physiol Regul Integr Comp Physiol. 2014 Dec 15;307(12):R1471-87. doi: 10.1152/ajpregu.00307.2014. Epub 2014 Oct 29. Am J Physiol Regul Integr Comp Physiol. 2014. PMID: 25354728 Free PMC article.
-
Regulation of cardiovascular development by adenosine and adenosine-mediated embryo protection.Arterioscler Thromb Vasc Biol. 2012 Apr;32(4):851-5. doi: 10.1161/ATVBAHA.111.226811. Arterioscler Thromb Vasc Biol. 2012. PMID: 22423036 Free PMC article. Review.
Cited by
-
Epigenetic Programming of Synthesis, Release, and/or Receptor Expression of Common Mediators Participating in the Risk/Resilience for Comorbid Stress-Related Disorders and Coronary Artery Disease.Int J Mol Sci. 2018 Apr 18;19(4):1224. doi: 10.3390/ijms19041224. Int J Mol Sci. 2018. PMID: 29670001 Free PMC article. Review.
-
Gamma-tocotrienol attenuates high-fat diet-induced obesity and insulin resistance by inhibiting adipose inflammation and M1 macrophage recruitment.Int J Obes (Lond). 2015 Mar;39(3):438-46. doi: 10.1038/ijo.2014.124. Epub 2014 Jul 21. Int J Obes (Lond). 2015. PMID: 25042861
-
Maternal caffeine intake during pregnancy and childhood growth and overweight: results from a large Norwegian prospective observational cohort study.BMJ Open. 2018 Apr 23;8(3):e018895. doi: 10.1136/bmjopen-2017-018895. BMJ Open. 2018. PMID: 29685923 Free PMC article.
-
Caffeine: cardiorespiratory effects and tissue protection in animal models.Exp Anim. 2021 Nov 10;70(4):431-439. doi: 10.1538/expanim.20-0185. Epub 2021 May 27. Exp Anim. 2021. PMID: 34039788 Free PMC article. Review.
-
Exploring the relationship between caffeine metabolism-related CYP1A2 rs762551 polymorphism and team sport athlete status and training adaptations.Mol Biol Rep. 2024 Jul 23;51(1):841. doi: 10.1007/s11033-024-09800-2. Mol Biol Rep. 2024. PMID: 39042267 Free PMC article.
References
-
- Curtis LH, Hammill BG, Bethel MA, Anstrom KJ, Gottdiener JS, et al. (2007) Costs of the metabolic syndrome in elderly individuals: findings from the Cardiovascular Health Study. Diabetes Care 30: 2553–2558. - PubMed
-
- Balkau B, Valensi P, Eschwege E, Slama G (2007) A review of the metabolic syndrome. Diabetes Metab 33: 405–413. - PubMed
-
- Obunai K, Jani S, Dangas GD (2007) Cardiovascular morbidity and mortality of the metabolic syndrome. Med Clin North Am 91: : 1169–1184, x. - PubMed
-
- Qiao Q, Gao W, Zhang L, Nyamdorj R, Tuomilehto J (2007) Metabolic syndrome and cardiovascular disease. Ann Clin Biochem 44: 232–263. - PubMed
Publication types
MeSH terms
Substances
Grants and funding
LinkOut - more resources
Full Text Sources
Other Literature Sources
Medical
Molecular Biology Databases
