. 2014 Jan 29:12:7.
doi: 10.1186/1741-7007-12-7.

Larval body patterning and apical organs are conserved in animal evolution

Affiliations

Larval body patterning and apical organs are conserved in animal evolution

Heather Marlow et al. BMC Biol. .

Abstract

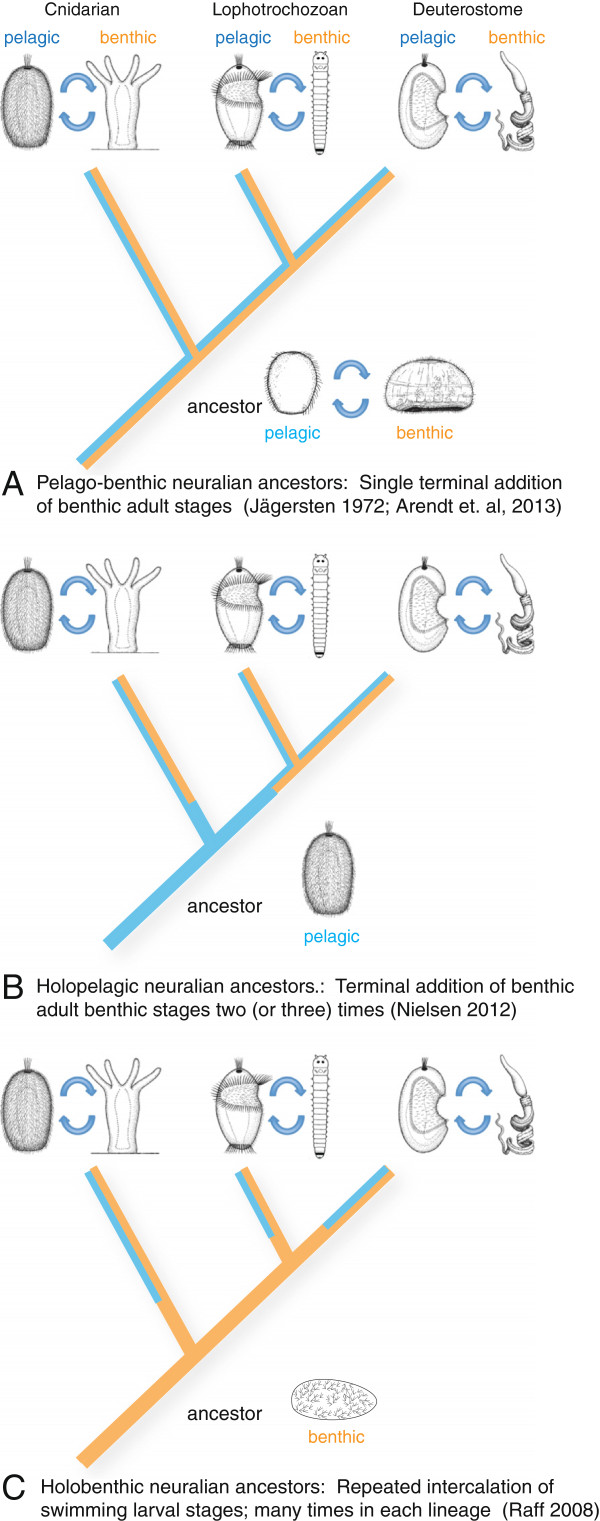
Background: Planktonic ciliated larvae are characteristic for the life cycle of marine invertebrates. Their most prominent feature is the apical organ harboring sensory cells and neurons of largely undetermined function. An elucidation of the relationships between various forms of primary larvae and apical organs is key to understanding the evolution of animal life cycles. These relationships have remained enigmatic due to the scarcity of comparative molecular data.

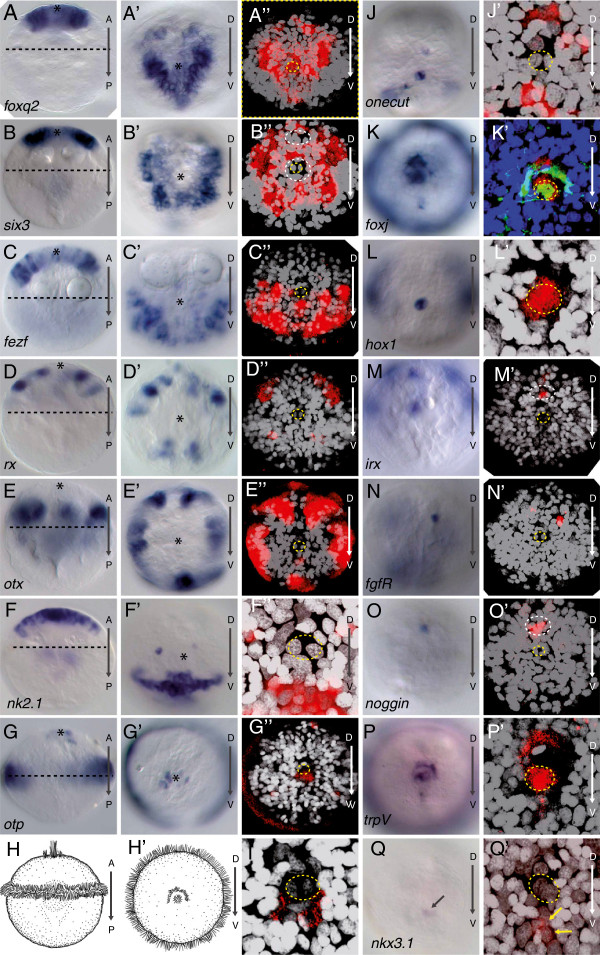
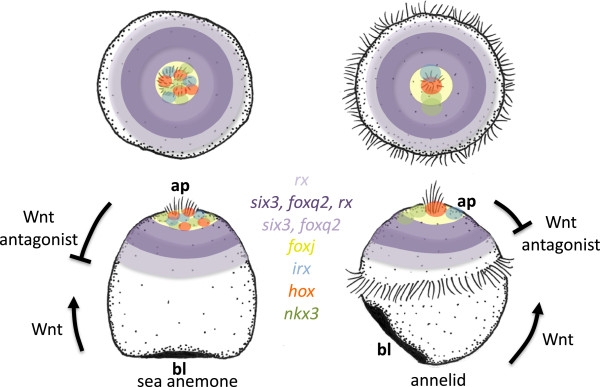
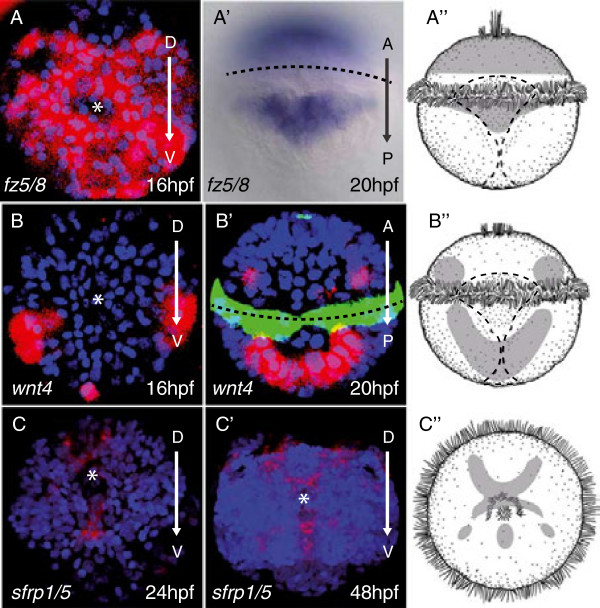
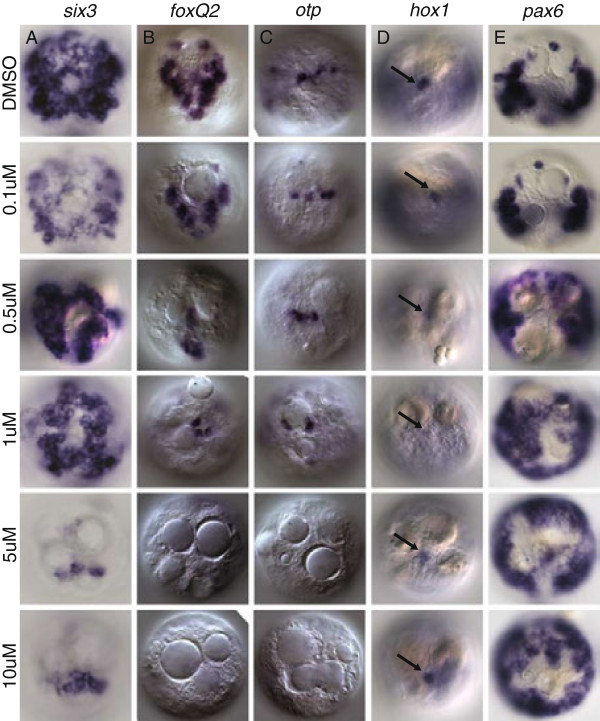
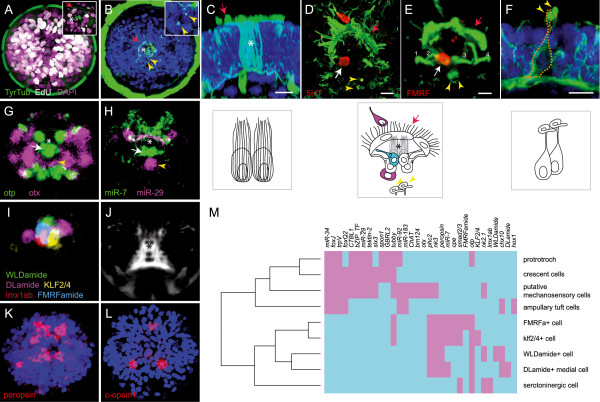
Results: To compare apical organs and larval body patterning, we have studied regionalization of the episphere, the upper hemisphere of the trochophore larva of the marine annelid Platynereis dumerilii. We examined the spatial distribution of transcription factors and of Wnt signaling components previously implicated in anterior neural development. Pharmacological activation of Wnt signaling with Gsk3β antagonists abolishes expression of apical markers, consistent with a repressive role of Wnt signaling in the specification of apical tissue. We refer to this Wnt-sensitive, six3- and foxq2-expressing part of the episphere as the 'apical plate'. We also unraveled a molecular signature of the apical organ--devoid of six3 but expressing foxj, irx, nkx3 and hox--that is shared with other marine phyla including cnidarians. Finally, we characterized the cell types that form part of the apical organ by profiling by image registration, which allows parallel expression profiling of multiple cells. Besides the hox-expressing apical tuft cells, this revealed the presence of putative light- and mechanosensory as well as multiple peptidergic cell types that we compared to apical organ cell types of other animal phyla.

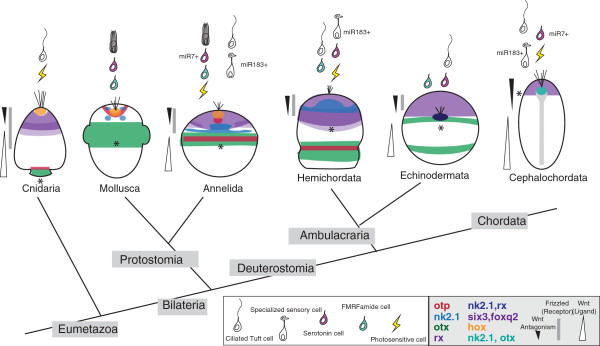
Conclusions: The similar formation of a six3+, foxq2+ apical plate, sensitive to Wnt activity and with an apical tuft in its six3-free center, is most parsimoniously explained by evolutionary conservation. We propose that a simple apical organ--comprising an apical tuft and a basal plexus innervated by sensory-neurosecretory apical plate cells--was present in the last common ancestors of cnidarians and bilaterians. One of its ancient functions would have been the control of metamorphosis. Various types of apical plate cells would then have subsequently been added to the apical organ in the divergent bilaterian lineages. Our findings support an ancient and common origin of primary ciliated larvae.


Figures

Figure 1
Figure 1
The three scenarios show the origin of the pelagic larval body plan, indicated by red arrows. The presence of pelagic forms is indicated by blue lines and that of benthic forms by brown lines. A single-coloured line indicates a monophasic life cycle that would be pelagic in scenario B and benthic in scenario C. Double lines (blue and brown) indicate a biphasic, pelago-benthic life cycle (with pelagic larval and benthic adult forms). Note that the biphasic life cycle is assumed to have evolved multiple times independently in scenario C. (A) The classical view implies homology of both ciliated larvae and benthic adults that, once evolved, have remained part of the eumetazoan life cycle [17]. (B) Nielsen [16] modified this view to propose that the holopelagic neuralian ancestors persisted beyond the initial divergence of the major neuralian clades, and that the biphasic life cycle with benthic adults arose independently in the cnidarians and once or twice in the bilaterians. (C) In stark contrast, other authors assume that today’s ciliated larvae arose convergently many times by the repeated intercalation of a pelagic dispersal larva into primarily monophasic, holobenthic life cycles and are thus evolutionarily unrelated. This view implies that the characteristics of today’s swimming larvae such as apical organs and equatorial ciliary bands evolved convergently [18].
Figure 2
Figure 2
Apical regional patterning mRNA expression in early trochophore larvae. (A-G) are ventral views, (A’-G’) and (J-Q) are apical views, and (A”-G”) and (J’-Q’) are apical views using confocal reflection microscopy of NBT/BCIP staining (red) following in situ mRNA and fluorescent DAPI staining of nuclei (white), allowing localization of individual cells in the apical Plate. F”, I, J’, K’, L’, P’ and Q’ are high magnification apical views. Ampullary cells are demarcated with yellow dashed circle. All images are of 24 hour post-fertilization (hpf) embryos, except C, C’, D, D’, E, E’, G, G’, L, M, O, O’, which are of 20 hpf embryos. Asterisks mark the tip of the apical pole. (A) Broad apical expression of foxq2 in 24 hpf trochophores. (B) Broad apical expression of six3, excluding area encompassing apical organ and a dorsal patch of cells (demarcated with white dashed lines). (C) Fezf ventrally in apical plate. (D) Rx in dorsal and ventral domains between the six3 domain and the prototroch. (E) Otx in ring-like domain adjacent to prototroch. (F) Nk2.1 in a ventral strip of cells and in two spots flanking the crescent cells. (G, I) Otp in apical cluster and in prototroch. (H, H’) Schematized ventral and apical views at 24 hpf depicting crescent and ampullary cells and prototroch. (J) Onecut in crescent cells and in cells ventral to the ampullary cells. (K) FoxJ in the ampullary cells, crescent cells and prototroch. (K) Antibody staining to acetylated tubulin (green) and DAPI-labeled nuclei (blue). (L) Hox1 in ampullary cells. (M) Irx in six3-negative territory and in an equatorial ring below the prototroch. (N) FgfR in a cell dorsal to the ampullary cells. (O) Noggin in a cell dorsal to the ampullary cells. (P) trpV in cells ventral to the ampullary cells. (Q) Nkx3 in a small patch of cells ventral to the ampullary cells. (Q’) Nkx3 in mechanoreceptor cells (yellow arrows).
Figure 3
Figure 3
Comparison of apical molecular territories in a sea anemone planula larva and an annelid trochophore. Apical (above) and lateral (below) views of a schematized planula larva of a sea anemone (left panel). Gene expression based on published data for Nematostella vectensis (for references see text). Apical (above) and lateral (below) views of a schematized annelid trochophore larva (right panel). Gene expression based on our data.
Figure 4
Figure 4
Wnt pathway members are expressed in the episphere and hyposphere during early development. The prototroch is marked with a dashed line. The tip of the apical plate is marked with an asterisk. Arrows indicate dorsal (D), ventral (V), anterior (A) and posterior (P). (A) Frizzled5/8 across the apical plate, 16 hours post-fertilization (hpf) apical view and a (A’) 20 hpf ventral view (inset shows a surface ventral view). (B) Wnt4 along the blastopore, 16 hpf lateral view. (B’) Confocal image of ventral view of Wnt4 expression in which antibody staining to acetylated tubulin is visible with a green secondary antibody, reflection signal of in situ hybridization is red and nuclei are visible, stained with DAPI, in blue. (C) Apical view of sfrp1/5 expression at 24 hpf and at (C’) 48 hpf. (A”, B” and C”) Schematic representations of the expression patterns in (A) and (B) and (C) and (A’) and (B’) and (C’).
Figure 5
Figure 5
Azakenpaullone treatment of embryos alters gene expression in the episphere in a dose-dependent manner. All images are apical views with dorsal at the top of the image and ventral at the bottom. (A) Six3 is severely reduced in embryos treated with azakenpaullone. (B) Foxq2 expression is lost in all but the most apical cells of the episphere in azakenpaullone treatments. (C) Fewer otp cells are stained at increasing concentrations of azakenpaullone and expression is entirely lost at 10 μM. (D) Hox1, a molecular marker of the ampullary cells (arrows), is not affected by azakenpaullone treatment. Ampullary cells are specified very early in development, earlier than the initiation of chemical treatments at 12 hours post-fertilization, prior to the differentiation of the remainder of the episphere. (E) Pax6 expression, which marks the ventral regions of the developing apical plate, is expanded in the episphere upon treatment with azakenpaullone. Counts of the embryos displaying wild-type, reduced or expanded expression domains for two replicates at 0, 1 and 5 μM concentrations are displayed in Figure S4.
Figure 6
Figure 6
Molecular fingerprint of Platynereis apical organ cell types. (A) EdU incorporation (white) in dividing cells between 22 and 24 hours post-fertilization (hpf) (apical view). Central EdU-negative cells (magenta) represent post-mitotic apical organ cells. Inset: 5 μm z-projection of apical organ. (B) Acetylated tubulin staining at 30 hpf, apical view. Crescent cells located dorsal to ampullary tuft cells. Inset: Cilia of the putative mechanosensory cells (arrowhead). (C) Lateral view of ampullary tuft cells, acetylated tubulin (green) and DAPI staining (blue), 30 hpf. (D) Serotoninergic cells of the apical organ stained with an anti-5HT antibody, 48 hpf. White arrow indicates serotonergic interneuron (magenta in schematic). (E) Four otp + peptidergic flask-shaped cell (numbers) at 48 hpf (apical view). One of these labeled by an FMRFamide antibody. In schematic, numbers indicate otp + cells and the FMRFamidergic cell is in cyan. (F) Lateral view of putative mechanosensory cells, 48 hpf (arrowheads: stiff curly tips of the sensory cilia). (G, H) Mutually exclusive gene expression at 48 hpf, 23 μm z-projection of averaged expression patterns obtained with profiling by image registration (PrImR). (I) Cell types of the otp + domain. The image shows non-overlapping expression of markers of each cell as deduced from PrImR, 11 μm z-projection of average expression patterns. (J) 4 μm z-projection of the average axonal scaffold at 48 hpf, showing the deep position of the two ampullary cells surrounded by neuropil. (K) Expression of peropsin at 24 hpf (L) Expression of c-opsin1 at 20 hpf. (M) Hierarchical clustering of the molecular fingerprint of individual cell types identified within the apical organ region and of the prototroch for comparison. Expression in magenta. Asterisk indicates the two ampullary tuft cells, red arrows indicate crescent cells and yellow arrowheads indicate cilia of two putative mechanosensory cells. In panels B-H, gene expression is in red, DAPI staining in blue and tubulin staining in green unless otherwise specified. Panels C-F, scale bar is 10 μm.
Figure 7
Figure 7
Larval molecular territories and cell types show global conservation of ancient larval patterning. For animals in which molecular data is available, spatial transcription factor expression data have been mapped onto the larval body plan (larvae as seen from the ventral side; amphioxus is pictured from a dorsal perspective). Morphologically described or ‘molecularly footprinted’ cells found in the apical organ are pictured above larval forms. The activity of Wnt signaling on larval body formation is pictured with bars flanking the larvae. Data is compiled from this and previous studies in Cephalochordata [45,59,65-73], Hemichordata [9,25,41,43,60,74-77], Echinodermata [26,32,36,37,42,48,78-83], Mollusca [24,84] and Cnidaria [30,40,44,64,85-90].

Similar articles

Cited by

References

    1. Young CM, Sewell MA. Atlas of Marine Invertebrate Larvae. Waltham, MA, USA: Academic Press; 2006.
    1. Nielsen C. Trochophora larvae: cell-lineages, ciliary bands, and body regions. 1. Annelida and mollusca. J Exp Zool (Mol Dev Evol) 2004;12:35–68. doi: 10.1002/jez.b.20001. - DOI - PubMed
    1. Nielsen C. Trochophora larvae: cell-lineages, ciliary bands and body regions. 2. Other groups and general discussion. J Exp Zool B Mol Dev Evol. 2005;12:401–447. - PubMed
    1. Jekely G. Origin and early evolution of neural circuits for the control of ciliary locomotion. Proc Biol Sci. 2011;12:914–922. doi: 10.1098/rspb.2010.2027. - DOI - PMC - PubMed
    1. Chia FS, Koss R. Fine-structural studies of the nervous-system and the apical organ in the planula larva of the sea-anemone Anthopleura elegantissima. J Morph. 1979;12:275–298. doi: 10.1002/jmor.1051600303. - DOI - PubMed

Publication types

MeSH terms

LinkOut - more resources