. 2014 Jan 30;505(7485):706-9.
doi: 10.1038/nature12946.

Landscape and variation of RNA secondary structure across the human transcriptome

Affiliations

Landscape and variation of RNA secondary structure across the human transcriptome

Yue Wan et al. Nature. .

Abstract

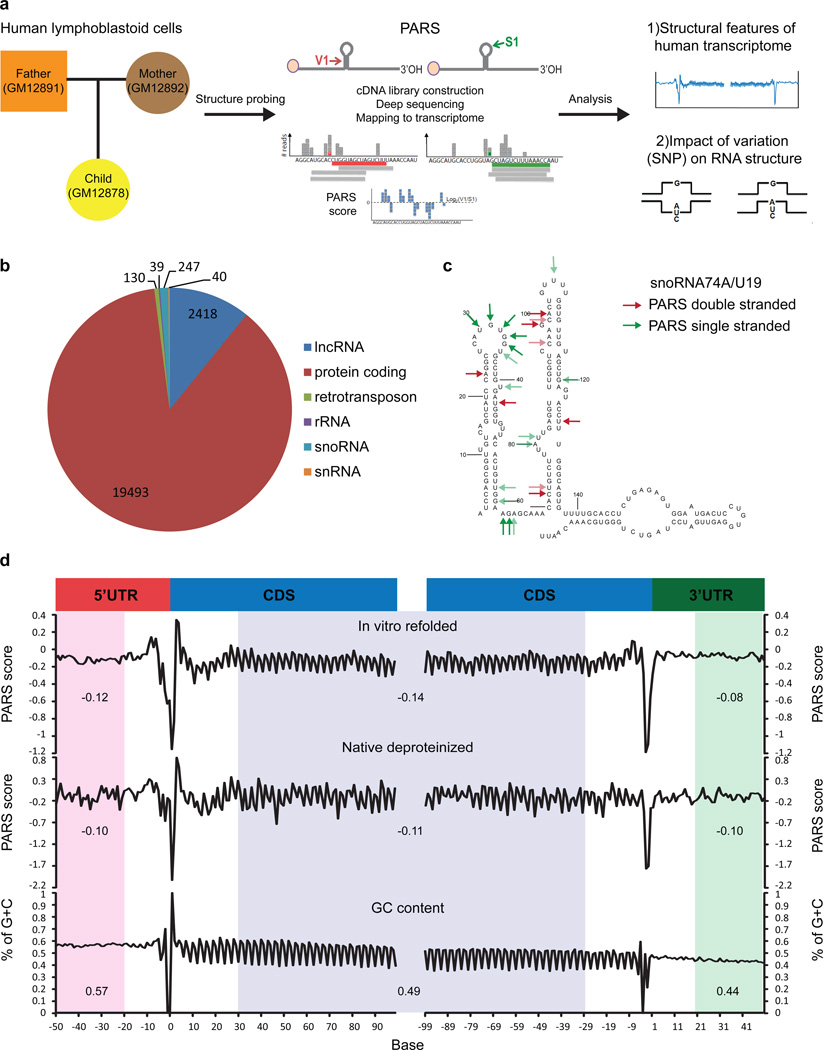
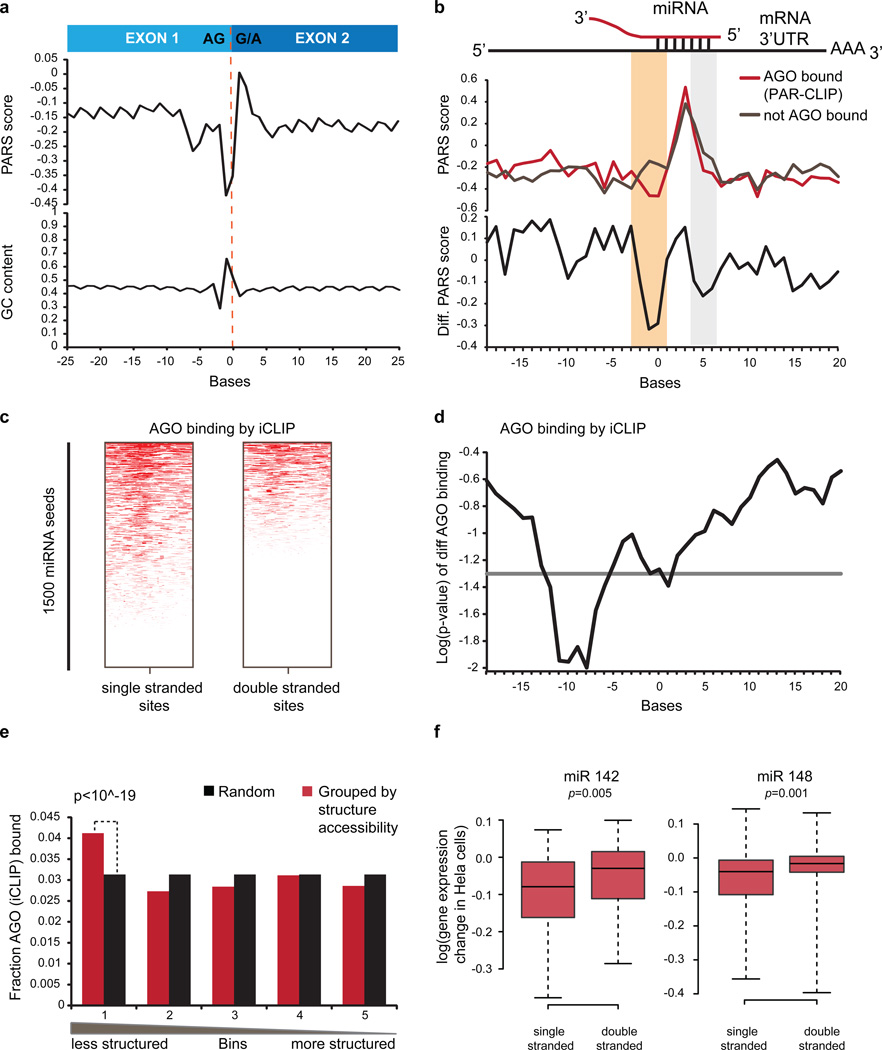
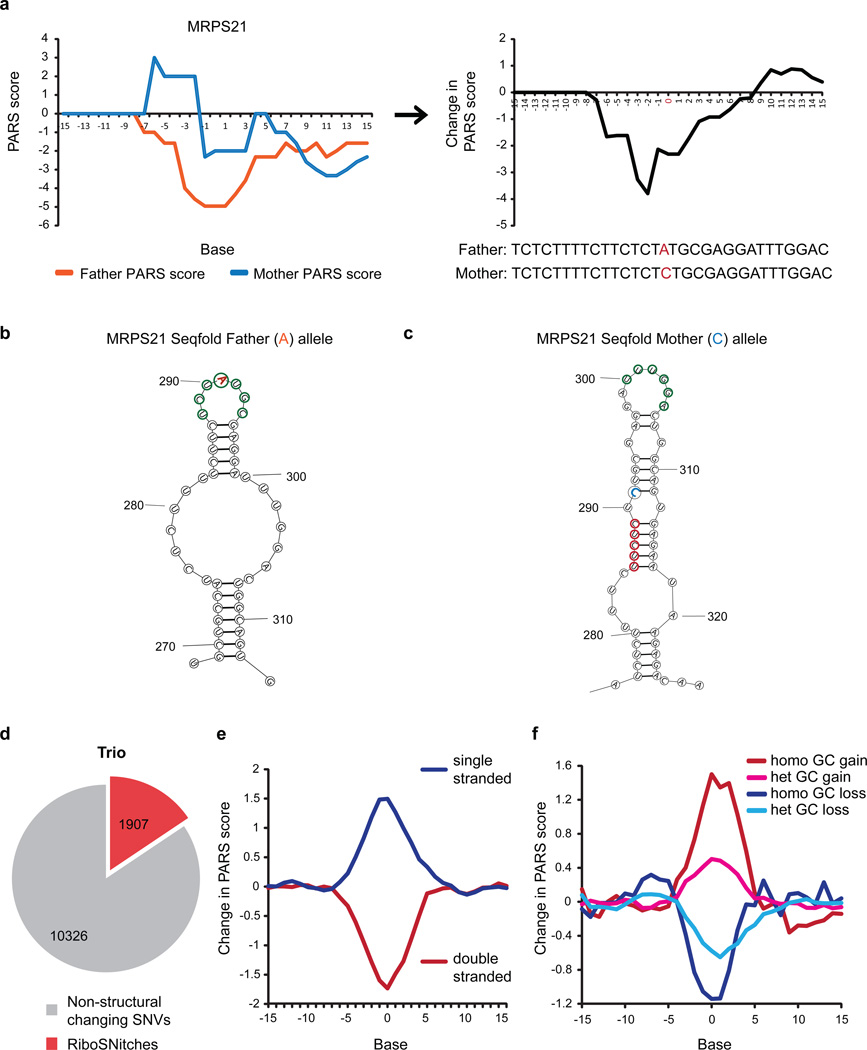
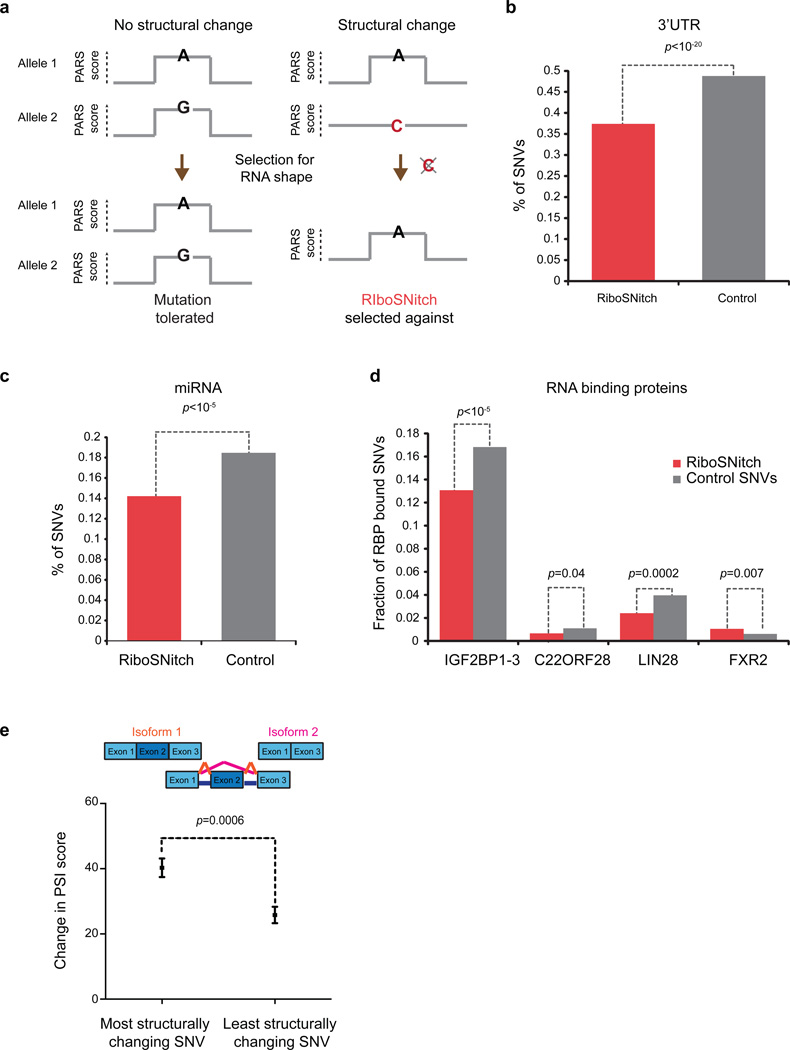
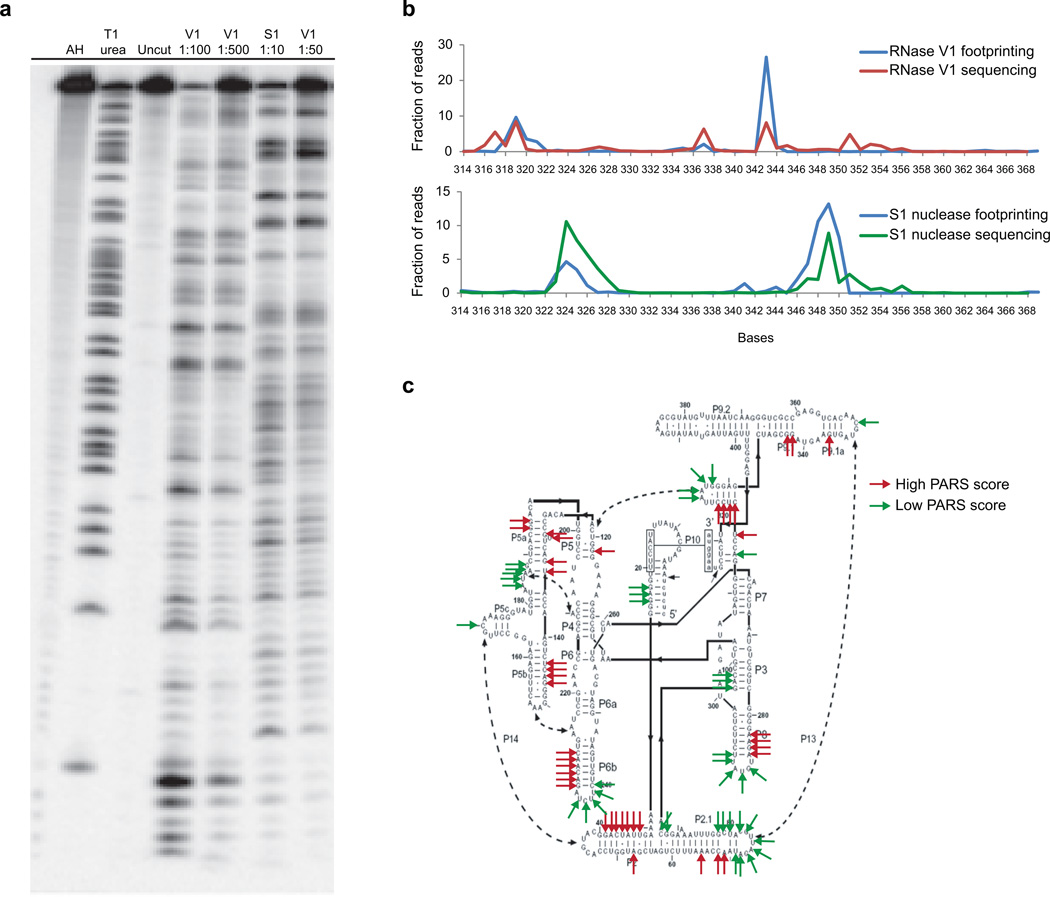
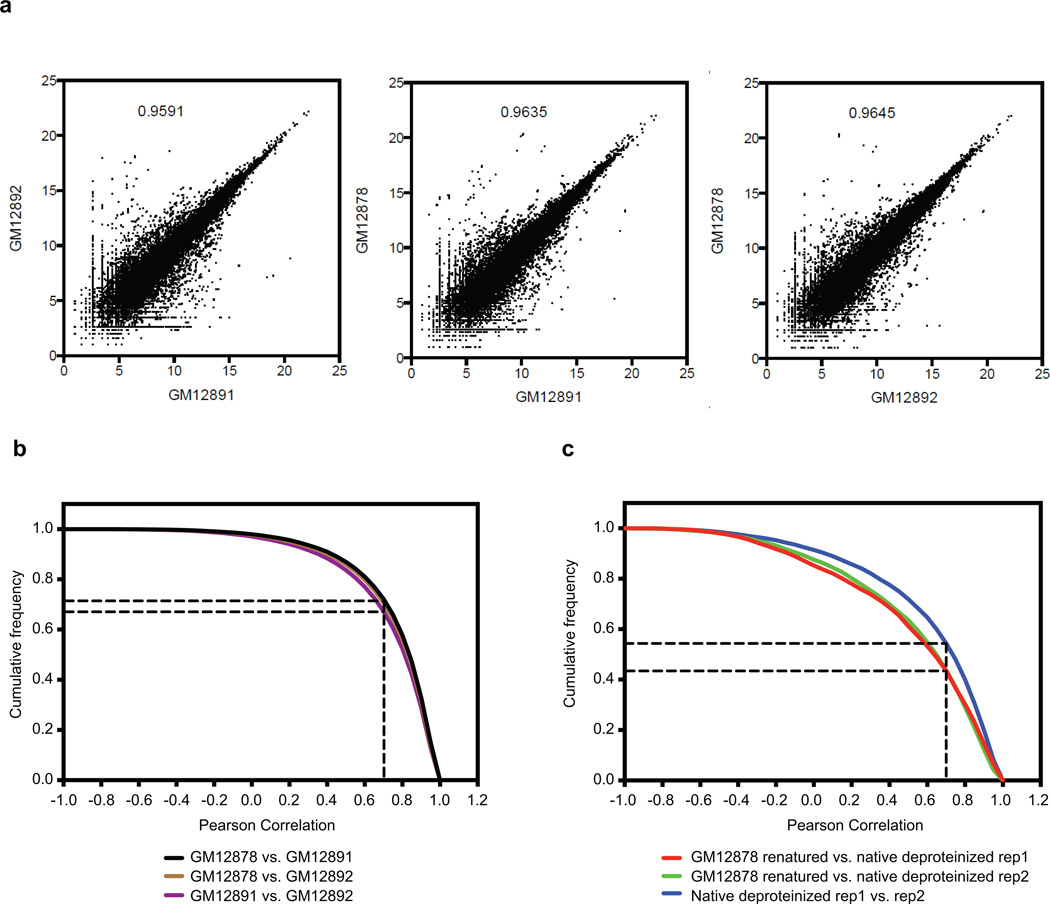
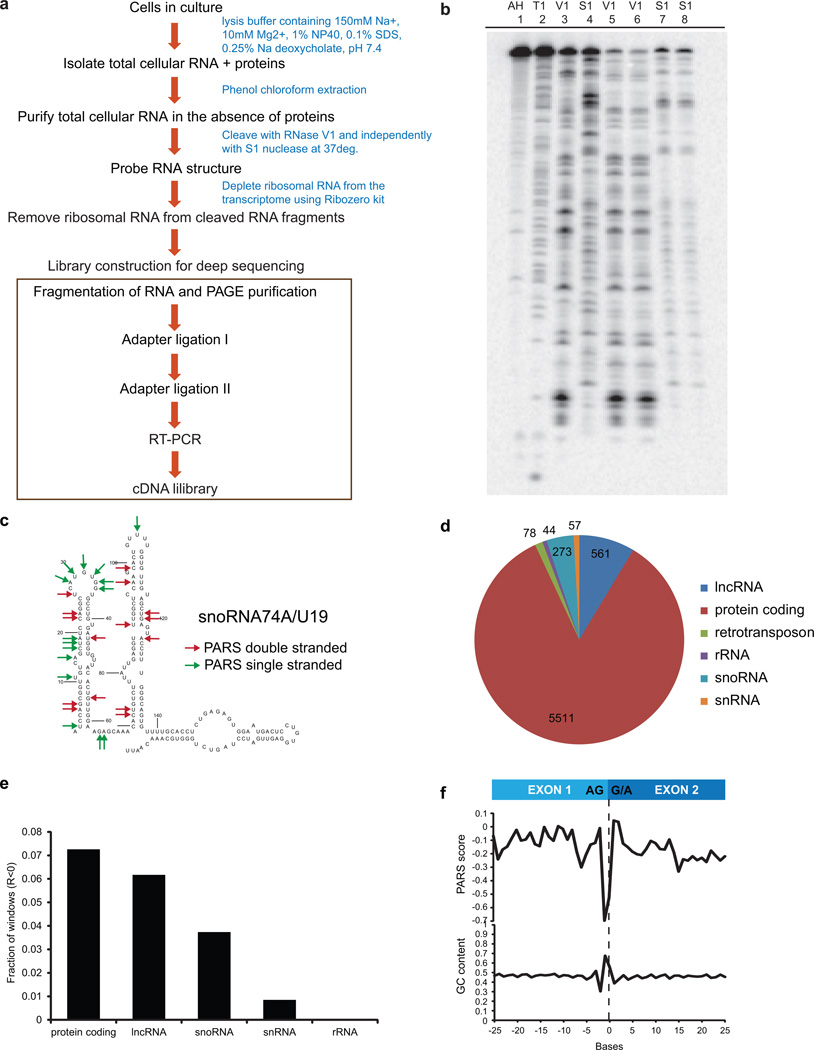
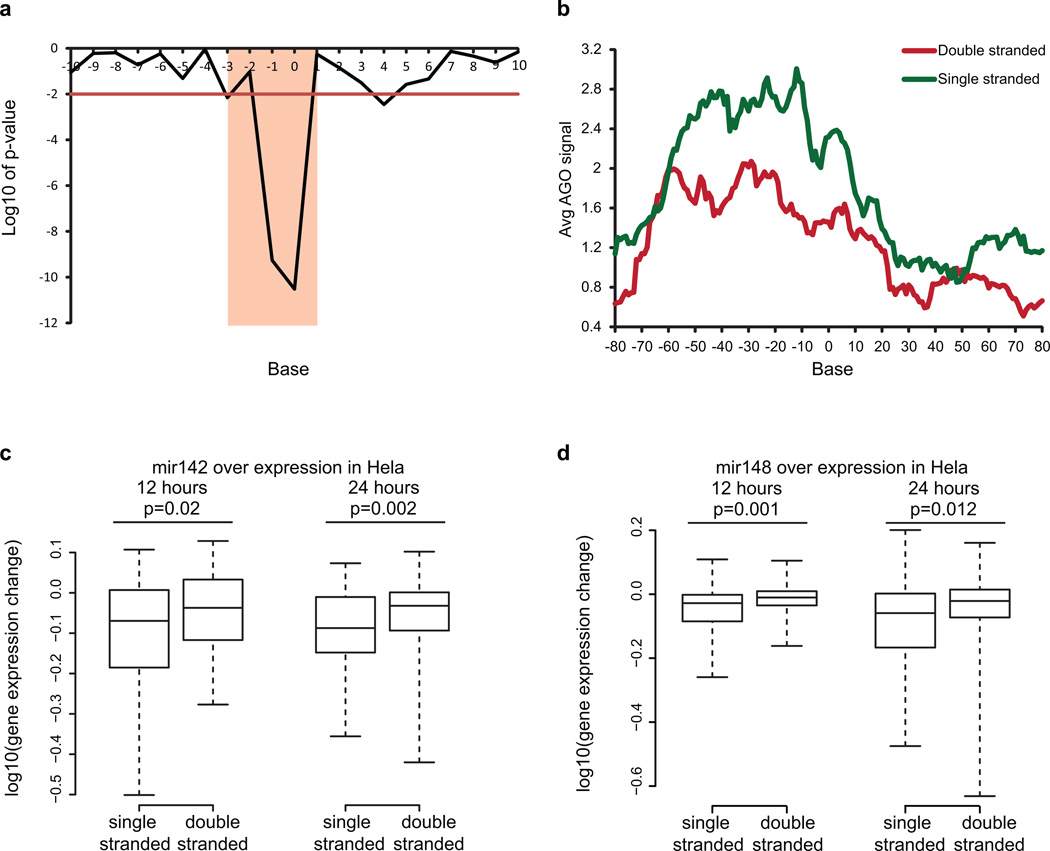
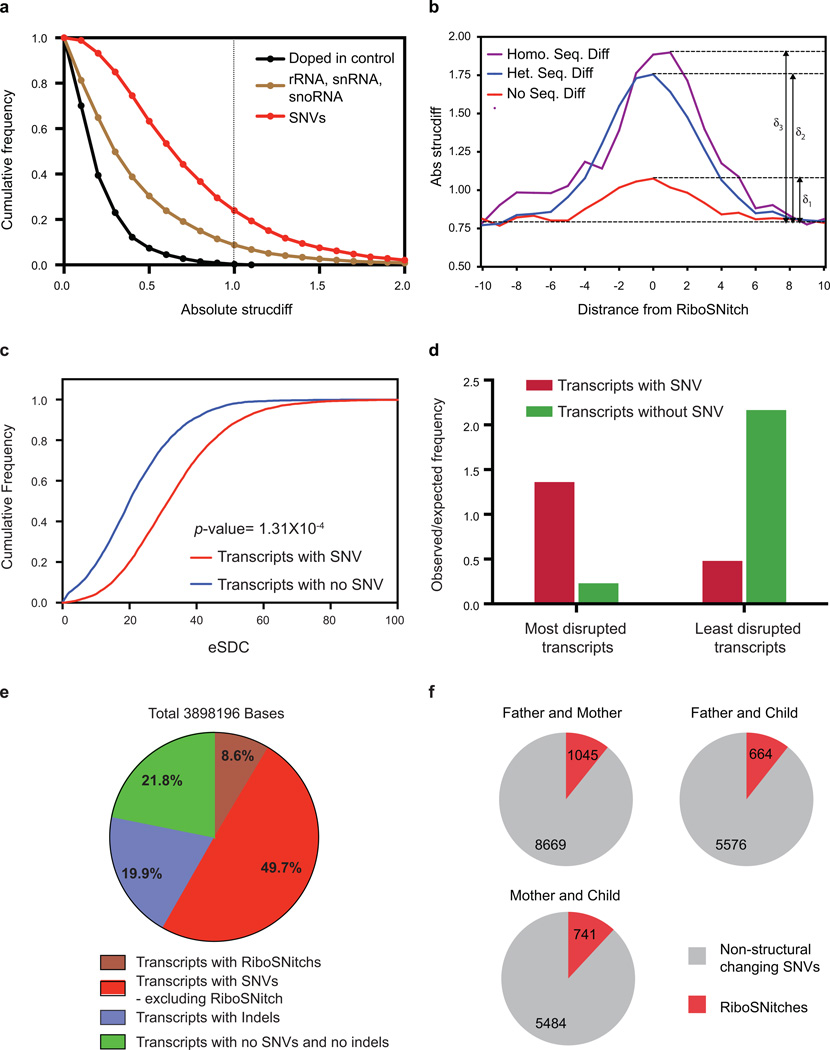
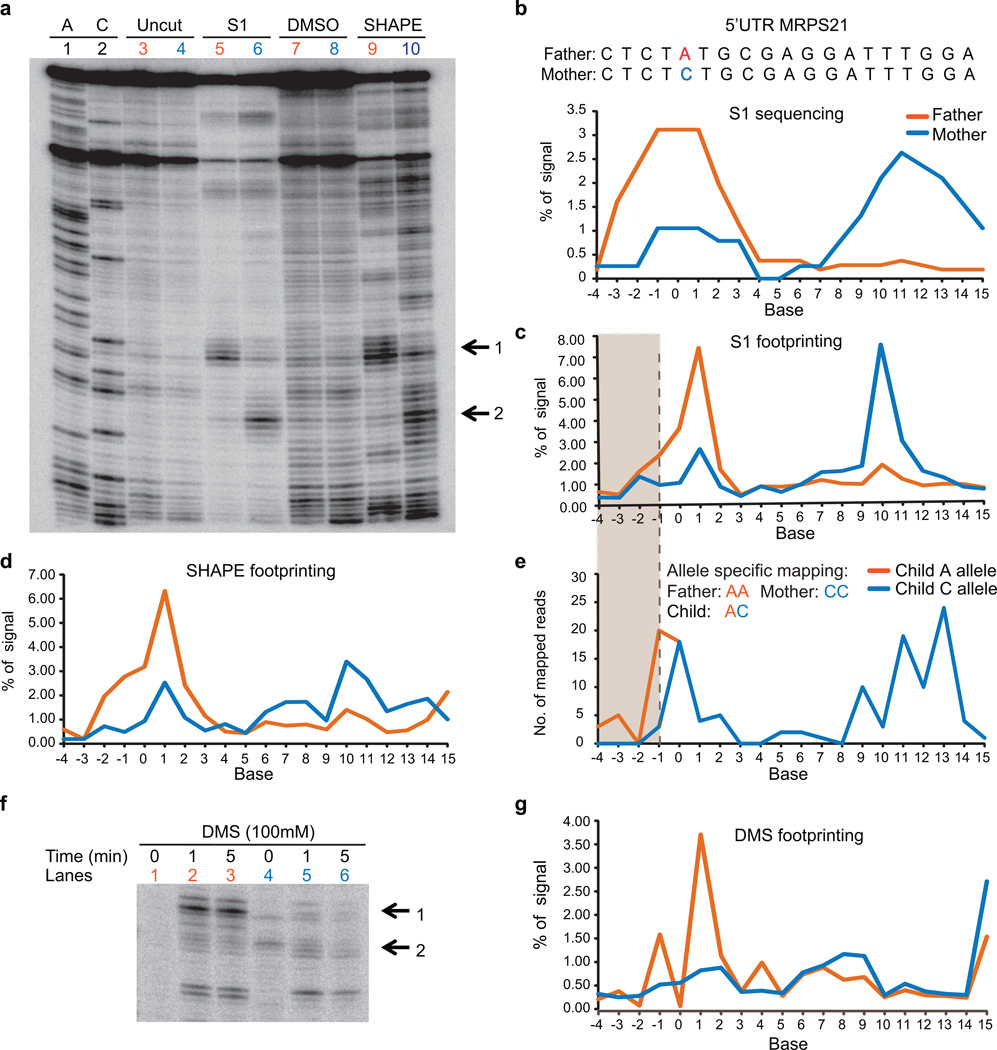
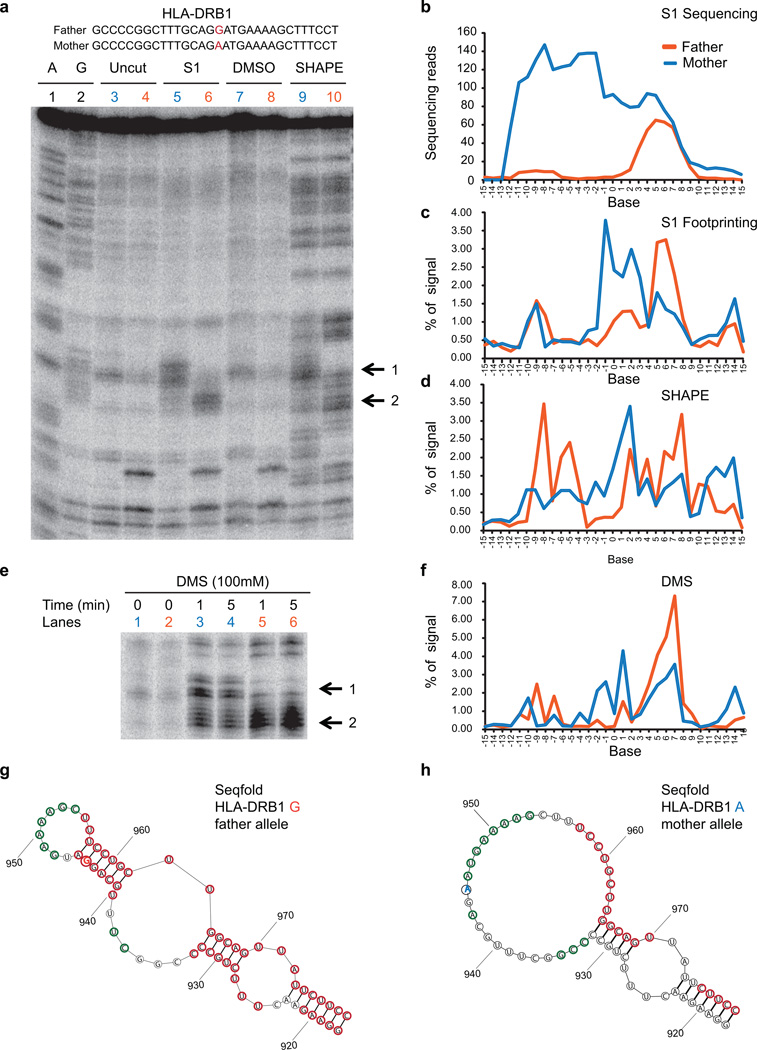
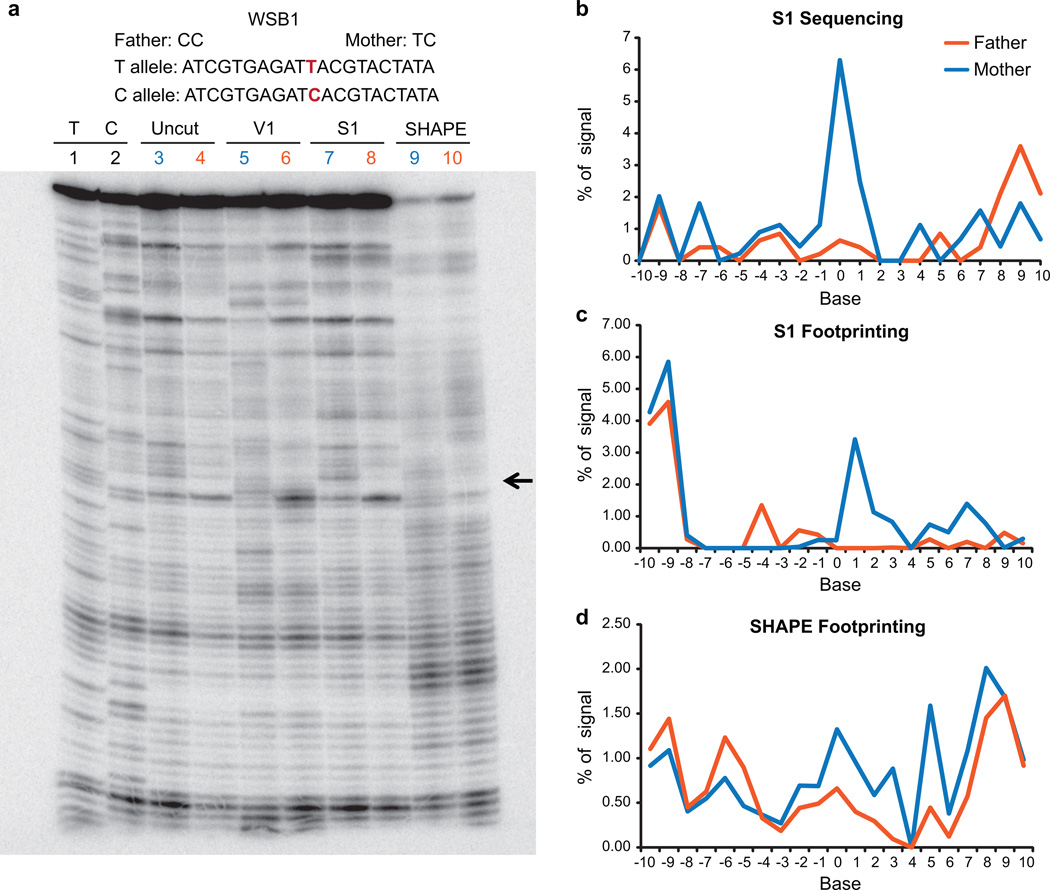
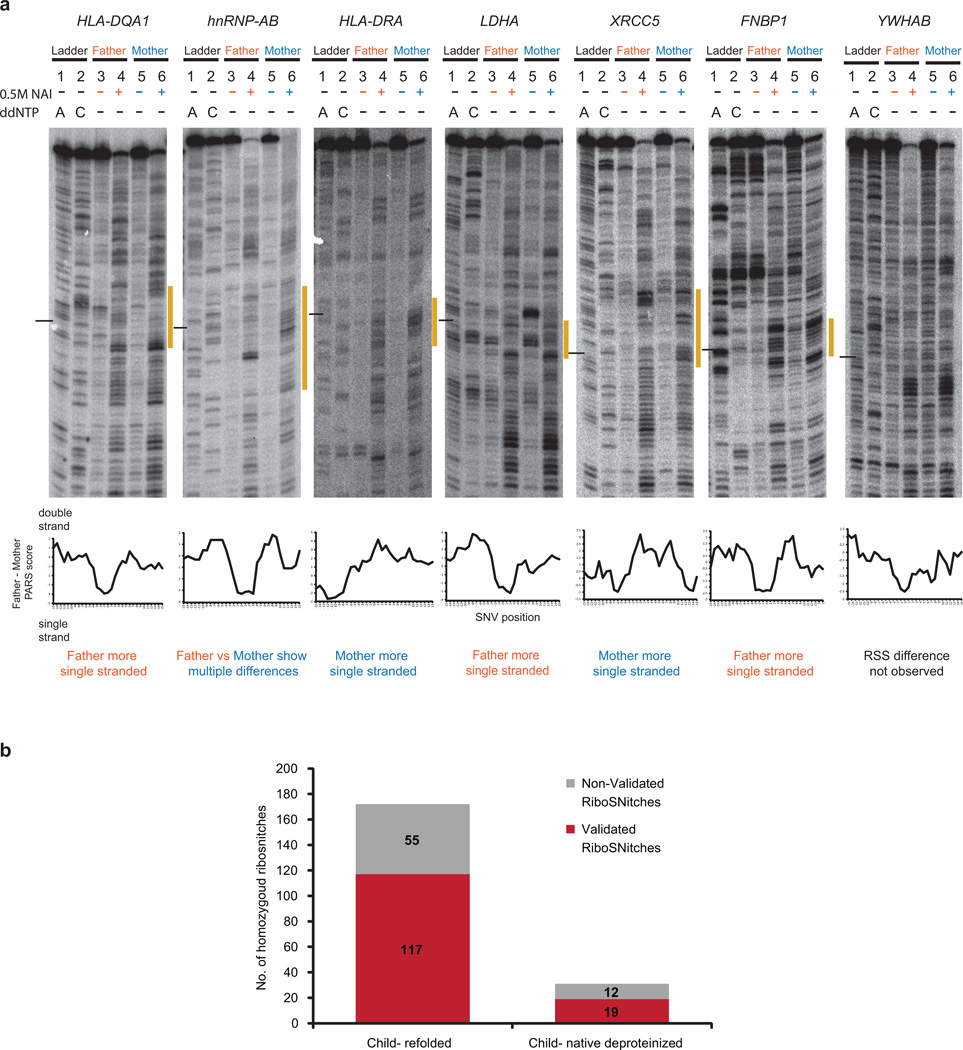
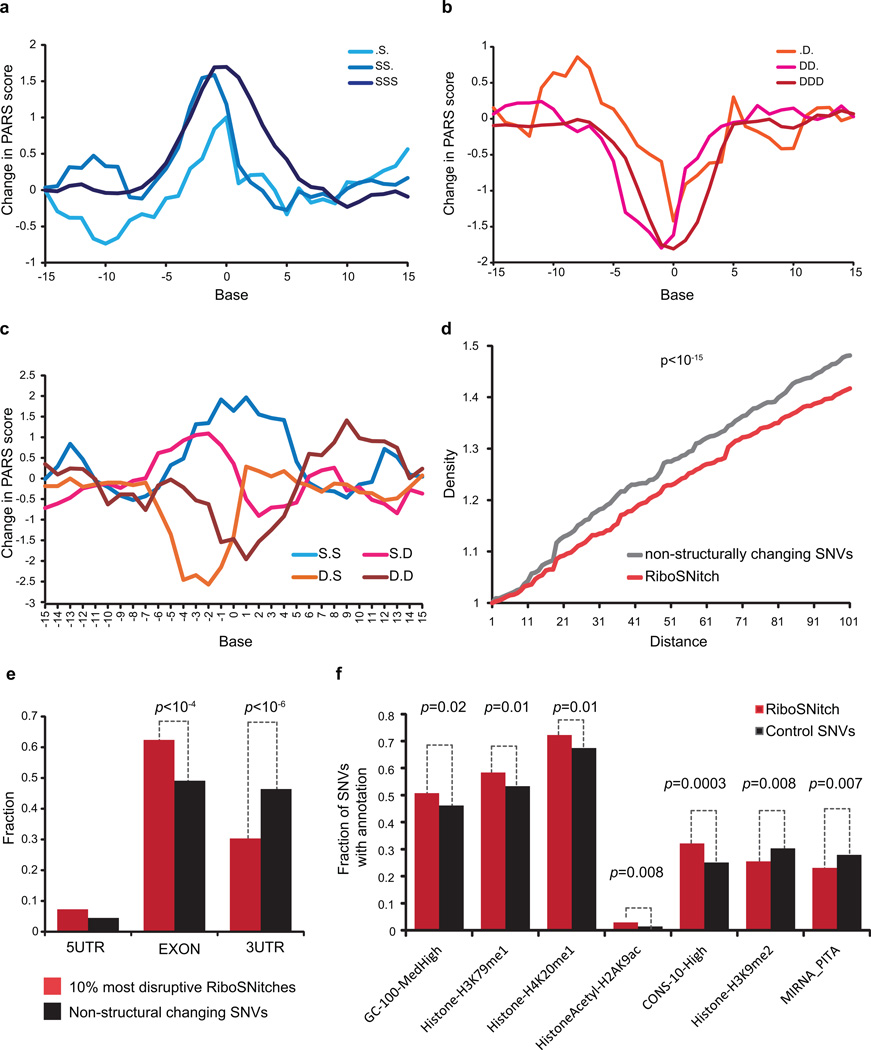
In parallel to the genetic code for protein synthesis, a second layer of information is embedded in all RNA transcripts in the form of RNA structure. RNA structure influences practically every step in the gene expression program. However, the nature of most RNA structures or effects of sequence variation on structure are not known. Here we report the initial landscape and variation of RNA secondary structures (RSSs) in a human family trio (mother, father and their child). This provides a comprehensive RSS map of human coding and non-coding RNAs. We identify unique RSS signatures that demarcate open reading frames and splicing junctions, and define authentic microRNA-binding sites. Comparison of native deproteinized RNA isolated from cells versus refolded purified RNA suggests that the majority of the RSS information is encoded within RNA sequence. Over 1,900 transcribed single nucleotide variants (approximately 15% of all transcribed single nucleotide variants) alter local RNA structure. We discover simple sequence and spacing rules that determine the ability of point mutations to impact RSSs. Selective depletion of 'riboSNitches' versus structurally synonymous variants at precise locations suggests selection for specific RNA shapes at thousands of sites, including 3' untranslated regions, binding sites of microRNAs and RNA-binding proteins genome-wide. These results highlight the potentially broad contribution of RNA structure and its variation to gene regulation.


Figures

Figure 1
Figure 1. PARS reveals the landscape of human RNA structure
a, Experimental overview. b, Pie chart showing the distribution of structure-probed RNAs with a coverage of at least one read per base. c, High (red arrows) and low (green arrows) PARS scores were mapped onto the secondary structure of snoRNA74A. d, PARS score (Top: renatured transcripts; Middle: native deproteinized transcripts) and GC content (Bottom) across the 5’UTR, the coding region, and the 3’UTR, averaged across all transcripts, aligned by translational start and stop sites. (averaged regions are shaded in pink, blue and green for 5’UTR, CDS and 3’UTR respectively).
Figure 2
Figure 2. RSS signatures of post-transcriptional regulation
a, Average PARS score and GC content across transcript exon-exon junctions. b, Average PARS score (Top) and PARS score difference (Bottom) across miRNA sites for AGO-bound (red) vs. non-AGO-bound sites (grey). Structurally different regions are in beige and light grey. c, AGO-iCLIP binding for single vs. double-stranded miRNA target sites. d, P-value for differential AGO-iCLIP binding (t-test, p=0.05 in grey). e, Observed vs. expected AGO binding (p-value, chi-square test). f, Expression changes of mRNAs with accessible and inaccessible miR142 (left) or miR148 (right) sites, upon miRNA over-expression (Wilcoxon Rank sum test).
Figure 3
Figure 3. PARS identifies RiboSNitches genome-wide
a, PARS score (Left) and PARS score difference (Right) of MRPS21 father and mother alleles. b,c, Seqfold models of MRPS21 A and C alleles (Single and double stranded bases circled in green and red respectively). d, Number of SNVs identified as RiboSNitches in the Trio. e,f, Average PARS score changes of RiboSNitches that (e) originally reside in double stranded (red) or single stranded regions (blue); or (f) undergo nucleotide changes from A/T to G/C (red, pink) or from G/C to A/T (dark and light blue). 0 indicates the position of SNV on the X-axis.
Figure 4
Figure 4. Genetic evidence for functional RSS elements in the transcriptome
a, Schematic of RSS selection test: Mutations that do not change the shape of an important RNA structure may be tolerated and accumulates (left), but a RiboSNitch that changes RNA shape will be evolutionarily selected against and removed. b–d, Selective depletion of RiboSNiches vs. structurally synonymous SNVs at b, 3’UTRs; c, predicted miRNA target sites; d, specific RBP binding sites. P-value is calculated using chi-square test. e, RiboSNitches impact splicing. PSI score is calculated to be the ratio of alternatively spliced isoform vs. total isoforms (Methods, p=0.0006, Student’s t-test).
Extended Data Figure 1
Extended Data Figure 1. PARS data accurately maps to known structures
a, RNase V1 and S1 nucleases were titrated to single hit kinetics in structure probing. Gel analysis of structure probing of yeast RNA in the presence of 1μg of total human RNA using different dilutions of RNase V1 (lanes 4, 5), and S1 nuclease (lanes 6,7), cleaved at 37°C for 15min. Additionally, RNase T1 ladder (lane 2), alkaline hydrolysis (lane 1), and no nuclease treatment (lane3) are shown. Dilution of V1 nuclease by 1:500 and S1 nuclease by 1:50 results in mostly intact RNA. b, PARS signal obtained for the P9-9.2 domain of Tetrahymena ribozyme using the double strand enzyme RNase V1 (red line) or the single strand enzyme S1 nuclease (green line) accurately matches the signals obtained by tranditional footprinting (blue lines). c, Top 10 percentile of PARS score (double stranded, red arrows) and bottom 10 percentile of PARS score (single stranded, green arrows) were mapped to the secondary structure of the Tetrahymena ribozyme.
Extended Data Figure 2
Extended Data Figure 2. PARS data is reproducible between biological replicates
a, Scatter plot of mRNA abundance between the cell lines GM12878, GM12891 and GM12892 indicates that gene expression between the cells are highly correlated (R>0.9). b, Cumulative frequency distribution of the Pearson correlation of PARS scores in 20 nucleotide windows, with a coverage of at least 10 reads/base, in transcripts between the cells GM12878 vs GM12891, GM12878 vs GM12892 and GM12891 vs GM12892. The black dotted lines indicate the fraction of windows that are positively correlated. c, Cumulative frequency distribution of the Pearson correlation of PARS scores in 20 nucleotide windows, with a coverage of at least 10 reads/base, between GM12878 refolded transcripts vs GM12878 native deproteinized replicate1 transcripts, GM12878 refolded transcripts vs GM12878 native deproteinized replicate2 transcripts, as well as native deproteinized replicate1 transcripts vs native deproteinized replicate2 transcripts.
Extended Data Figure 3
Extended Data Figure 3. PARS can be applied to native deproteinized RNAs
a, Schematic of PARS on native deproteinized transcripts. b, Gel analysis of structure probing of yeast RNA using RNase V1 in RNA structure buffer (lane 3), RNase V1 in lysis buffer containing 1% NP40, 0.1% SDS and 0.25% Na deoxycholate (lanes 5 and 6), S1 nuclease in RNA structure buffer (lane 4) and S1 nuclease in lysis buffer (Lanes 7 and 8). Additionally, RNase T1 ladder (lane 2) and alkaline hydrolysis (lane 1) are shown. The enzymes appear to cleave similarly in lysis buffer and in structure buffer. c, Structure probing of native deproteinized snoRNA74A. Top 10 percentile of PARS scores (high, red arrows) and bottom 10 percentile of PARS score (low, green arrows) were mapped onto the secondary structure model of snoRNA74A. d, Deep sequencing and mapping of PARS reads on native deproteinized transcripts provided structural information for thousands of transcripts, including coding and non-coding RNAs. e, We compared Pearson correlations of 20 nucleotide windows with a coverage of at least 100 reads (coverage >=5) between transcripts that were refolded and native deproteinized. The y-axis indicates the fraction of negatively correlated windows (R<0) over the total number of windows for each RNA class. f, PARS score across exon exon junctions, averaged across all native deproteinized transcripts (load>=1). Percentage of nucleotide C plus G was averaged across the transcripts.
Extended Data Figure 4
Extended Data Figure 4. Increased accessibility 5’ of miRNA target site influences AGO binding
a, Bases that show significantly different PARS score between AGO bound and non-bound sites in PAR-CLIP. Base 0 is the most 5’ position of the mRNA that is directly base-pairing with miRNA seed region. Y axis indicates log10 of p-value, calculated by Wilcoxon Rank Sum Test. b, Metagene analysis of the average AGO bound reads using iCLIP in predicted miRNA target sites that are single stranded (green) or double stranded (red) from bases −3 to 1. c,d, Average PARS score is calculated for bases −3 to 1 for each targetscan predicted site. Change in gene expression is plotted for genes with most accessible (100) and least accessible (100) sites, upon over expression of miRNA 142 (c) and miRNA 148 (d). P-value is calculatedusing Wilcoxon Rank Sum Test.
Extended Data Figure 5
Extended Data Figure 5. PARS identified RiboSNitches in the human transcriptome
a, Cumulative frequency plot of PARS score differences between SNVs (GM12891 vs. GM12892), doped in controls and structured RNAs including rRNAs, snRNAs and snoRNAs. Dotted black line indicated the threshold beyond which we call a SNV a RiboSNitch. X-axis indicates the absolute change in PARS score between GM12891 and GM12892. b, Absolute change in PARS score around heterozygous, homozygous RiboSNitches and biological noise. The red line indicates the change in PARS score between sequences that are the same (noise) across individuals. The blue line indicates the change in PARS score between 2 sequences that have a RiboSNitch. The purple line indicates the change in PARS score between homozygous RiboSNitches. c, Cumulative frequency plot of the experimental Structure Disruption Coefficient (eSDC) for transcripts that contain or do not contain SNVs eSDC = (1-Pearson correlation)* sqrt(transcript length). d, Transcripts are ranked according to eSDC score and classified into the top 2000 most and least structurally disrupted transcripts. The most structurally disrupted transcripts are more likely to contain SNVs while the least structurally disrupted transcripts are less likely to contain SNVs. e, Pie chart showing the distribution of structurally changing bases (p=0.05, FDR=0.1) in transcripts with SNVs, RiboSNitches, indels and no SNVs and no indels. 78.2% of these bases reside in transcripts with either SNVs or indels, indicating that nucleotide sequence is important for RNA structure. f, No. of RiboSNitches identified by PARS between each pair of individuals in the Trio. Grey indicates non-structurally changing SNVs, red indicates RiboSNitches.
Extended Data Figure 6
Extended Data Figure 6. Footprinting validation of a RiboSNitch in 5’UTR of MRPS21 identified by PARS
a, Gel analysis of 150mer fragments of MRPS21 RNA using S1 nuclease (lanes 5 (Father), 6 (Mother)), and SHAPE probing ((lanes 9 (Father), 10 (Mother)). Additionally, sequencing lanes (lanes 1,2), uncut (lane 3 (Father), lane 4 (Mother), and DMSO treated lanes (lane 7 (Father), lane 8, (Mother)) are also shown. Black arrows indicate the change in structure between the Father and Mother alleles. b, Top: The sequence of a portion of the transcript containing the RiboSNitch was shown. The RiboSNitch is in red. Bottom: Single strand profile by S1 sequencing of the father and mother allele. Y axis indicates the percentage of signal at each base over the total signal in the region. c,d, SAFA quantification of manual structure probing of both MRPS21 alleles using S1 nuclease (c) and SHAPE (d). e, S1 sequencing reads are mapped uniquely to either the A or C allele in the child. The grey box indicates the bases that show structural differences by allele speficic mapping in the child. f, Gel analysis of 150mer fragments of MRPS21 RNA using DMS footprinting (lanes 1,2 and 3 (Father), 4, 5 and 6 (Mother)). Black arrows indicate the change in structure between Father and Mother alleles. g, Quantification of DMS footprinting of both MRPS21 alleles using SAFA.
Extended Data Figure 7
Extended Data Figure 7. Footprinting validation of a RiboSNitch in HLA-DRB1 transcript identified by PARS
a, The sequence of a portion of the transcript containing the RiboSNitch was shown. The RiboSNitch is in red. Gel analysis of 2 fragments of HLA-DRB1 RNA A and G alleles using S1 nuclease (lanes 5 (Mother), 6 (Father)), and SHAPE probing ((lanes 9 (Mother), 10 (Father)). Additionally, sequencing lanes (lanes 1,2), uncut lanes (lane 3 (Mother), lane 4 (Father)), and DMSO treated lanes (lane 7 (Mother), lane 8, (Father)) are also shown. Black arrows indicate the change in structure between the Father and Mother alleles. b, S1 sequencing reads across the RiboSNitch for both Father and Mother. c,d, SAFA quantification of the RNA footprinting of both alleles using S1 nuclease (c) and SHAPE (d). e, Gel analysis of 2 fragments of HLA-DRB1 RNA A and G alleles using DMS (lanes 1,3 and 4 (Mother), 2, 5 and 6 (Father)). Black arrows indicate the change in structure between Father and Mother alleles. f, Quantification of DMS footprinting of both HLA-DRB1 alleles using SAFA. g,h, Secondary structure models of the G alelle (g) and A allele (h) of HLA-DRB1, using Seqfold guided by PARS data. The 2 alleles of the ribosnitch is shown in orange and blue respectively. The red and green circles indicate bases with PARS scores >=1 and <= −1 respectively.
Extended Data Figure 8
Extended Data Figure 8. Footprinting validation of a RiboSNitch in WSB1 transcript identified by PARS
a, The sequence of a portion of the WSB1 transcript containing the RiboSNitch was shown. The RiboSNitch is in red. Gel analysis of 2 fragments of WSB1 RNA T and C alleles using RNase V1 (lanes 5 (Mother), 6 (Father)), S1 nuclease (lanes 7 (Mother), 8 (Father)), and SHAPE probing ((lanes 9 (Mother), 10 (Father)). Additionally, sequencing lanes (lanes 1,2), DMSO uncut lanes (lane 3 (Mother), lane 4 (Father)) are also shown. Black arrow indicates the change in structure between the Father and Mother alleles. b, Fraction of S1 sequencing reads over total S1 sequencing reads in the region, across the RiboSNitch for both Father and Mother. c,d, SAFA quantification of the RNA footprinting of both alleles using S1 nuclease (c) and SHAPE (d).
Extended Data Figure 9
Extended Data Figure 9. Additional footprinting validation of RiboSNitches
a, Top: Gel analysis of fragments of Father and Mother alleles of HLA-DQA1, hnRNP-AB, HLA-DRA, LDHA, XRCC5, FNBP1, and YWHAB using SHAPE (lanes 4 (Father), 6 (Mother)). Additionally, DMSO controls (lanes 3 (Father),5 (Mother)) and ladder lanes (lanes 1 (T ladder), 2 (G ladder)) are also shown. The black line indicates the position of the SNV. The yellow bar along the side of the gel indicates the region that is changing between the father and mother alleles. Bottom: Difference in PARS signal between Father (GM12891) and Mother (GM12892), centred at the RiboSNitch. Positive PARS score indicates double stranded RNA, and should correspond to lower SHAPE signal. Negaitive PARS score indicates unpaired RNA with correspondingly higher SHAPE signal. 6 out of 7 cloned RNAs are validated by SHAPE in vitro. hnRNP-AB showed mulitple differences surrounding the SNV; SHAPE data confirmed the RiboSNitch and showed the structural rearrangement is more complex than indicated by PARS. SHAPE data of YWHAB did not show the predicted RSS difference. b, Bar graphs showing the number of homozygous SNVs in parents that are validated (in red) and not validated (grey) in the child by allele specific mapping. Homozygous RibiSNitches between the father and mother are mapped to both the renatured child RNA (in vitro-child) and the native deproteinized child RNA (native deproteinized-child). As the depth of coverage is lower in native deproteinized samples, we detect fewer (31) SNVs that were homozygously different in the parents.
Extended Data Figure 10
Extended Data Figure 10. Properties of Ribosnitches
a,b, Average PARS score difference around SNVs that originally reside in increasingly single stranded (a) or increasingly double stranded (b) region. c, Average PARS score difference around SNVs that were flanked by both double stranded bases, both single stranded bases, or one single and one double stranded base on each side. d, Density of other SNVs centered around RiboSNitches versus a control group of 2450 non-structure changing SNVs. P-value calculated by Kolmogorov-Smirnov Test. e, Distribution of top 10% most structurally disruptive RiboSNitches, calculated by biggest structural difference between the 2 alleles, versus a control group of 1855 SNVs that do not change structure in 5’UTRs, CDS and 3’UTRs. f, Different genomic features or annotations of 993 unique RiboSNitches are compared to 1009 control SNVs. For each genomic annotation, the fraction of RiboSNitches that reside in the genomic region covered by the annotation (e.g., histone mark) was compared to the fraction of control SNVs by Student’s t-test. A cutoff value of p=0.05 (T-test) was used.

Comment in

References

    1. Wan Y, Kertesz M, Spitale RC, Segal E, Chang HY. Understanding the transcriptome through RNA structure. Nat. Rev. Genet. 2011;12:641–655. - PMC - PubMed
    1. Kertesz M, et al. Genome-wide measurement of RNA secondary structure in yeast. Nature. 2010;467:103–107. - PMC - PubMed
    1. Li F, et al. Global analysis of RNA secondary structure in two metazoans. Cell. Rep. 2012;1:69–82. - PubMed
    1. Shabalina SA, Ogurtsov AY, Spiridonov NA. A periodic pattern of mRNA secondary structure created by the genetic code. Nucleic Acids Res. 2006;34:2428–2437. - PMC - PubMed
    1. Barash Y, et al. Deciphering the splicing code. Nature. 2010;465:53–59. - PubMed

References for full methods

    1. Lewis BP, Burge CB, Bartel DP. Conserved seed pairing, often flanked by adenosines, indicates that thousands of human genes are microRNA targets. Cell. 2005;120:15–20. - PubMed
    1. Chi SW, Zang JB, Mele A, Darnell RB. Argonaute HITS-CLIP decodes microRNA-mRNA interaction maps. Nature. 2009;460:479–486. - PMC - PubMed
    1. Konig J, et al. iCLIP reveals the function of hnRNP particles in splicing at individual nucleotide resolution. Nat. Struct. Mol. Biol. 2010;17:909–915. - PMC - PubMed
    1. Langmead B, Trapnell C, Pop M, Salzberg SL. Ultrafast and memory-efficient alignment of short DNA sequences to the human genome. Genome Biol. 2009;10:R25. - PMC - PubMed
    1. International HapMap Consortium. The International HapMap Project. Nature. 2003;426:789–796. - PubMed

Publication types

MeSH terms

Associated data