

Development of the Eating Choices Index (ECI): a four-item index to measure healthiness of diet
- PMID: 24477178
- PMCID: PMC10282271
- DOI: 10.1017/S1368980013003352
Development of the Eating Choices Index (ECI): a four-item index to measure healthiness of diet
Abstract
Objective: Current indices of diet quality generally include intakes of specific foods or nutrients. We sought to develop an index that discriminates healthy and unhealthy eating choices for use in large surveys as a short questionnaire and as a measure in existing studies with adequate dietary data.
Design: The Eating Choices Index (ECI) score included four components: (i) consumption of breakfast, (ii) consumption of two portions of fruit per day, (iii) type of milk consumed and (iv) type of bread consumed, each providing a score from 1 to 5. In analysis of 5 d food records, the ECI score was examined in relation to macronutrients, fibre, vitamin C, Fe, Ca and folate using Pearson correlations. Variation with sex, BMI, socio-economic status, marital status, smoking status and physical activity were also investigated.
Setting: Medical Research Council National Survey of Health and Development.
Subjects: Individuals (n 2256) aged 43 years.
Results: The ECI score (mean 12·3 (sd 3·5)) was significantly positively associated with protein, carbohydrate, fibre, vitamin C, Fe, Ca and folate (r = 0·2-0·5; P < 0·001) and significantly negatively associated with fat intake (r = -0·2; P < 0·001); ECI scores were not correlated with total energy intake. Individuals with a lower ECI score were more likely to be men (P < 0·001), overweight or obese (P < 0·001), have lower socio-economic status (P < 0·001), smoke more (P < 0·001) and be less physically active (P < 0·001).
Conclusions: ECI scores correlated with nutrient profiles consistent with a healthy diet. It provides a simple method to rank diet healthiness in large observational studies.
Figures
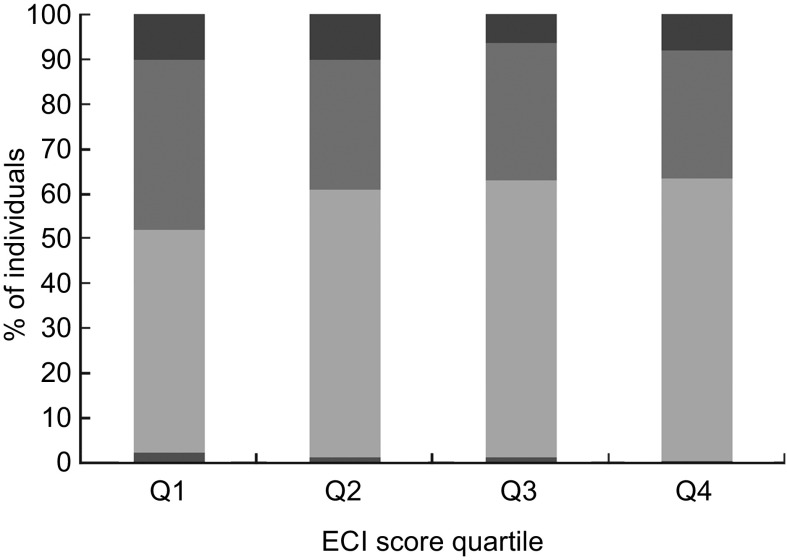
 , obese, BMI ≥ 30·0 kg/m2;
  , overweight, BMI = 25·0–29·9 kg/m2;
  , normal weight, BMI = 18·5–24·9 kg/m2;
  , underweight, BMI < 18·5 kg/m2; P for trend = 0·0 0 1) in 2243 individuals at age 43 years (in 1989), Medical Research Council National Health and Development Survey. n 517 for Q1 (ECI score < 10), n 682 for Q2 (ECI score = 10–12), n 415 for Q3 (ECI score = 12–14), n 629 for Q4 (ECI score > 14); for n 13 BMI is missing
References
-
- Waijers PM, Feskens EJ & Ocke MC (2007) A critical review of predefined diet quality scores. Br J Nutr 97, 219–231. - PubMed
-
- Wirt A & Collins CE (2009) Diet quality – what is it and does it matter? Public Health Nutr 12, 2473–2492. - PubMed
-
- Kant AK (1996) Indexes of overall diet quality: a review. J Am Diet Assoc 96, 785–791. - PubMed
-
- Kant AK (2004) Dietary patterns and health outcomes. J Am Diet Assoc 104, 615–635. - PubMed
-
- Maynard M, Ness AR, Abraham L et al. (2005) Selecting a healthy diet score: lessons from a study of diet and health in early old age (the Boyd Orr cohort). Public Health Nutr 8, 321–326. - PubMed
MeSH terms
Substances
Grants and funding
LinkOut - more resources
Full Text Sources
Other Literature Sources
