

Mad1 contribution to spindle assembly checkpoint signalling goes beyond presenting Mad2 at kinetochores
- PMID: 24477934
- PMCID: PMC3989695
- DOI: 10.1002/embr.201338114
Mad1 contribution to spindle assembly checkpoint signalling goes beyond presenting Mad2 at kinetochores
Abstract
The spindle assembly checkpoint inhibits anaphase until all chromosomes have become attached to the mitotic spindle. A complex between the checkpoint proteins Mad1 and Mad2 provides a platform for Mad2:Mad2 dimerization at unattached kinetochores, which enables Mad2 to delay anaphase. Here, we show that mutations in Bub1 and within the Mad1 C-terminal domain impair the kinetochore localization of Mad1:Mad2 and abrogate checkpoint activity. Artificial kinetochore recruitment of Mad1 in these mutants co-recruits Mad2; however, the checkpoint remains non-functional. We identify specific mutations within the C-terminal head of Mad1 that impair checkpoint activity without affecting the kinetochore localization of Bub1, Mad1 or Mad2. Hence, Mad1 potentially in conjunction with Bub1 has a crucial role in checkpoint signalling in addition to presenting Mad2.
Figures
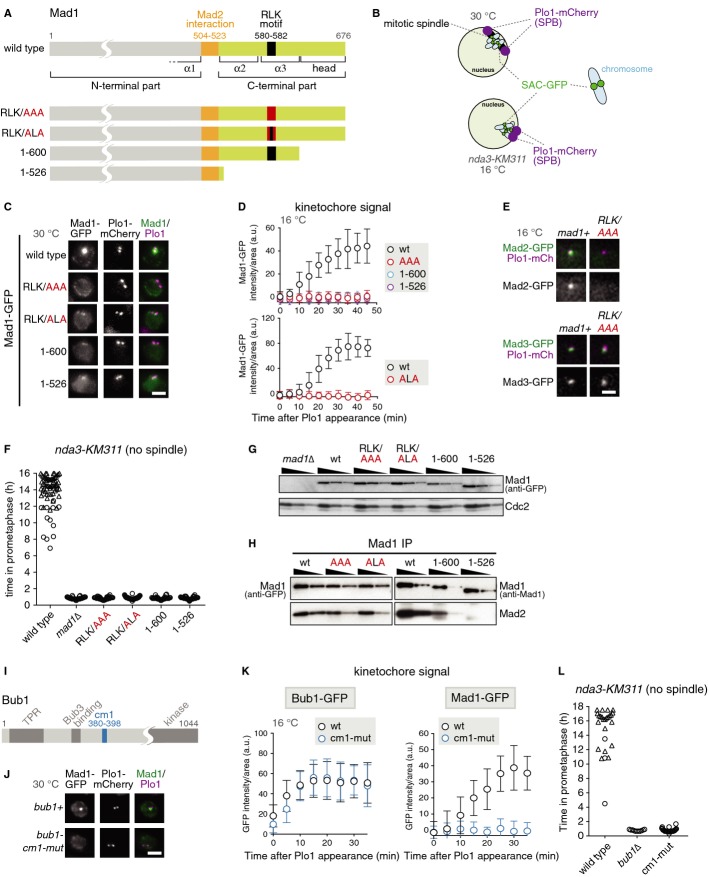
Domain structure of Mad1; point mutations and truncations employed in this study.
Schematic of fission yeast nuclei in prometaphase. Shown are the three chromosomes (light blue), the mitotic spindle (black) and kinetochores decorated with GFP-tagged SAC components (green). Plo1-mCherry (purple) is specifically recruited to spindle pole bodies (SPBs) in mitosis [37]. In interphase and early mitosis, kinetochores cluster at SPBs. In the conditional nda3-KM311 tubulin mutant, microtubule formation is impaired at restrictive temperature (16°C) and spindle pole bodies are unable to separate. Signals from the three chromosomes can typically not be microscopically resolved at early mitosis.
Cells expressing plo1+-mCherry, nda3-KM311 and the indicated Mad1-GFP fusion proteins were grown at the permissive temperature for nda3-KM311 (30°C). Representative nuclei of mitotic cells are shown; Plo1 was used as marker for mitosis (scale bar: 2 μm; see Supplementary Fig S1A for a larger field of view).
The same strains as in (C) were analysed at the restrictive temperature for nda3-KM311 (16°C), which prevents microtubule formation. Cells were followed by live-cell microscopy and the Mad1-GFP signals were quantified at the kinetochore as cells entered mitosis (a.u. = arbitrary units; error bars = s.d.; n ≥ 20 cells).
Cells expressing plo1+-mCherry, nda3-KM311, the indicated GFP fusion proteins and either wild-type Mad1 (mad1+) or mad1-RLK/AAA were imaged at 16°C. Representative nuclei of mitotic cells are shown. Scale bar: 2 μm.
Cells expressing plo1+-mCherry and nda3-KM311 and the indicated mutations or truncations in mad1 were analysed by live-cell imaging at 16°C. The time that each cell spent in prometaphase was determined by the localized Plo1-mCherry signal at SPBs (circle). Cells that had not yet exited mitosis when filming stopped are indicated by triangles.
Immunoblotting of cell extracts using anti-GFP (to detect the Mad1-GFP fusion proteins) and anti-Cdc2 (loading control) antibodies. A dilution series was loaded for each strain to compare intensities.
Anti-Mad1 immunoprecipitations of the indicated strains were analysed for the presence of Mad1 and Mad2 using anti-GFP (left), anti-Mad1 (right) and anti-Mad2 antibodies. Input and flow through are shown in Supplementary Fig S1C.
Domain structure of Bub1 (TPR: tetratricopeptide repeats; Bub3 binding: Bub3-binding motif, also called GLEBS; cm1: conserved motif 1; kinase: kinase domain).
Cells expressing mad1+-GFP, plo1+-mCherry, nda3-KM311 and either wild-type Bub1 (bub1+) or the Bub1-cm1-mutant (bub1-cm1-mut) were imaged at 30°C as in (C). Representative nuclei of mitotic cells are shown (scale bar: 2 μm; see Supplementary Fig S1H for a larger field of view). The Bub1-cm1 mutant contains aa changes S381A, T383A and T386A (alignment in Supplementary Fig S1E). The cellular abundance of wild-type and mutant Bub1-GFP was similar (Supplementary Fig S1F).
Bub1-GFP or Mad1-GFP signals were quantified at the kinetochore as in (D) (a.u. = arbitrary units; error bars = s.d.; n ≥ 24 cells for Bub1-GFP, n ≥ 18 cells for Mad1-GFP).
Checkpoint function of the indicated strains was analysed as in (F).
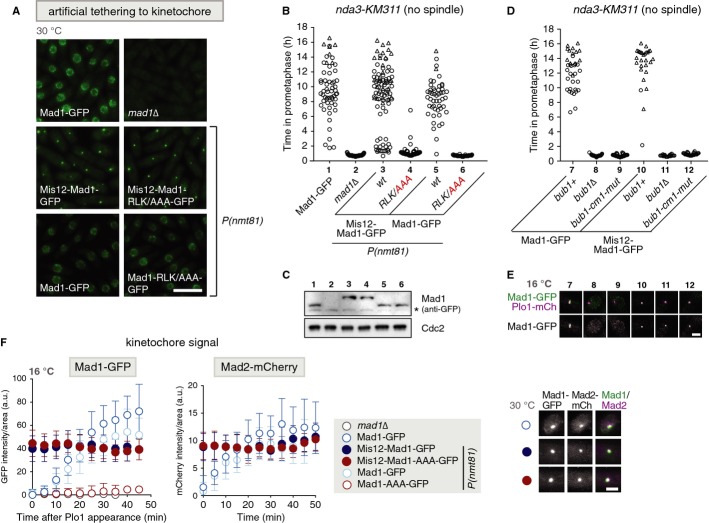
Representative images of cells expressing nda3-KM311 and the indicated GFP fusion proteins. Cells were imaged at the permissive temperature for nda3-KM311 (30°C). Fusion to the kinetochore protein Mis12 artificially tethers Mad1 to the kinetochore. Some constructs were expressed from the inducible nmt81 promoter, P(nmt81); the endogenous mad1 gene was deleted in these strains. Scale bar: 10 μm.
Checkpoint function of cells expressing plo1+-mCherry, nda3-KM311 and the indicated Mad1-GFP fusion proteins [same strains as in (A)] was analysed at 16°C as in Fig 1F.
Immunoblotting of cell extracts using anti-GFP and anti-Cdc2 (loading control) antibodies. Strains are the same as in (A) and (B). The asterisk indicates a cross-reaction of the antibody.
Checkpoint function of cells expressing plo1+-mCherry, nda3-KM311 and the indicated bub1 variants and Mad1-GFP fusion proteins was analysed as in Fig 1F.
Representative nuclei of mitotic cells of the strains analysed in (D). Scale bar: 2 μm.
Mad1-GFP (from cells in (B)) or Mad2-mCherry signals were quantified at the kinetochore as cells entered mitosis (a.u. = arbitrary units; error bars = s.d.; n ≥ 20 cells). Representative nuclei are shown on the right. (Scale bar: 2 μm; see Supplementary Fig S3C for a larger field of view).
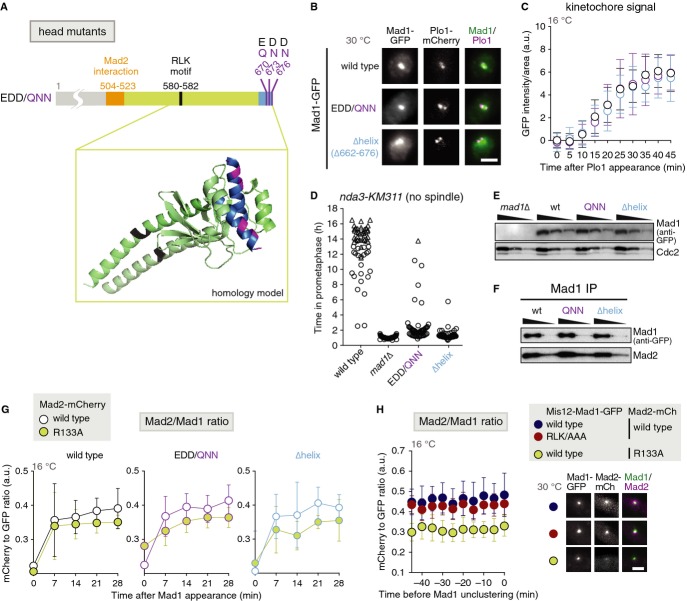
Position of the head mutations in Mad1. The inset shows a homology model of the C-terminus of Schizosaccharomyces pombe Mad1 (aa 562-676) based on the crystal structure of the dimeric H. sapiens Mad1 C-terminal domain (PDB code: 4ZDO, [12]). (black: RLK motif (aa 580-582); blue: last helix of the C-terminal head (aa 662-676); purple: aa E670/D673/D676).
Cells expressing plo1+-mCherry, nda3-KM311 and the indicated Mad1-GFP fusion proteins were imaged as in Fig 1C. Representative nuclei of mitotic cells are shown (scale bar: 2 μm; see Supplementary Fig S4B for a larger field of view).
The same strains as in (B) were analysed at the restrictive temperature for nda3-KM311 (16°C) as in Fig 1D. Mad1-GFP signals were quantified at the kinetochore as cells entered mitosis (a.u. = arbitrary units; error bars = s.d.; n ≥ 22 cells).
Checkpoint function of the indicated strains was analysed at 16°C as in Fig 1F.
Immunoblotting of cell extracts using anti-GFP and anti-Cdc2 (loading control) antibodies. A dilution series was loaded for each strain to compare intensities. Strains are the same as in (D).
Anti-Mad1 immunoprecipitations of the indicated strains were analysed for the presence of Mad1 and Mad2 using anti-GFP and anti-Mad2 antibodies. Input and flow through of the immunoprecipitation are shown in Supplementary Fig S4D.
Cells expressing nda3-KM311, the indicated mad1-GFP constructs and either mad2+-mCherry or mad2-R133A-mCherry were followed by live-cell imaging at 16°C. The Mad2-mCherry/Mad1-GFP ratio at kinetochores was determined as cells entered mitosis (a.u. = arbitrary units; error bars = s.d.). Mad1-wt + Mad2-wt: n = 13; Mad1-wt + Mad2-R133A: n = 21; Mad1-QNN + Mad2-wt: n = 16; Mad1-QNN + Mad2-R133A: n = 14; Mad1-Δhelix + Mad2-wt: n = 10; Mad1-Δhelix + Mad2-R133A: n = 8; statistical analysis in Supplementary Fig S4E. Representative images for Mad1-GFP and Mad2-mCherry localization in Supplementary Fig S4C.
Strains were followed by live-cell imaging as in (G) and Fig 2F. The Mad2-mCherry/Mad1-GFP ratio at kinetochores was determined as cells entered mitosis (a.u. = arbitrary units; error bars = s.d.; n ≥ 14 cells; statistical analysis in Supplementary Fig S4F). Representative nuclei are shown on the right (scale bar: 2 μm).
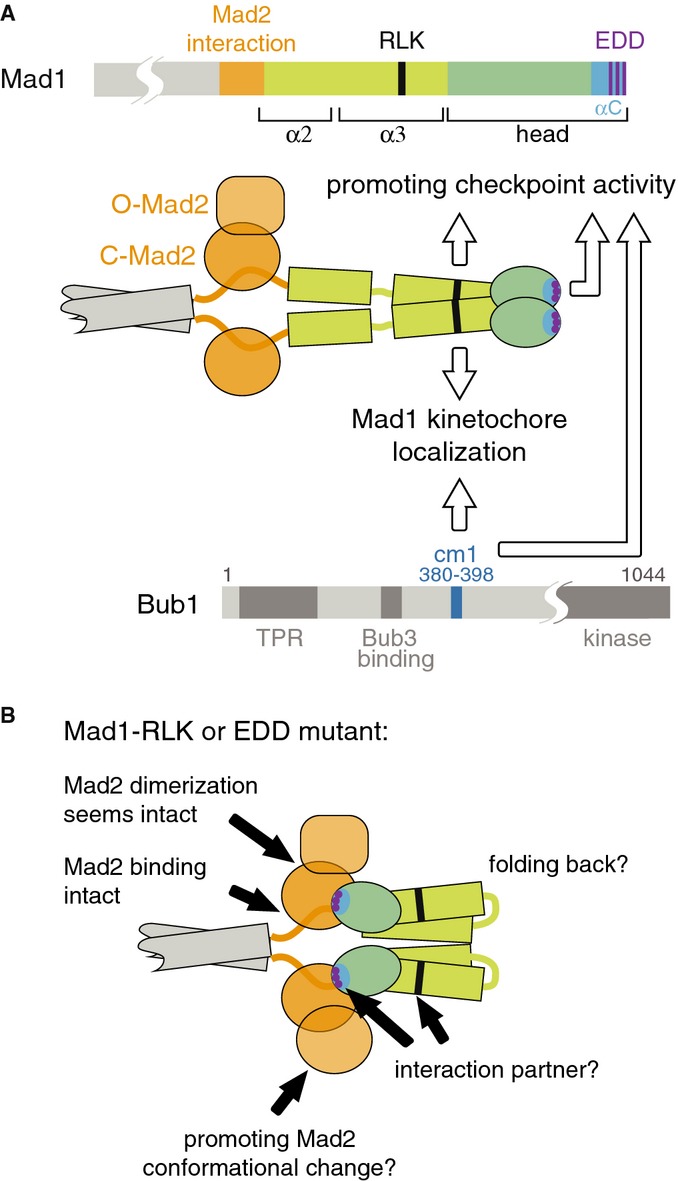
Schematic of the Mad1 and Bub1 proteins with suggested functions for the Mad1-RLK motif, the Mad1 C-terminal head and Bub1-cm1.
It is unknown how Mad1 α3 and head arrange with respect to α2. A straight conformation is shown in (A), folding back [2] is shown in (B). How the Mad1 C-terminus promotes checkpoint signalling remains unclear. Findings and ideas are indicated by black arrows and discussed in the text.
Comment in
-
When Mad met Bub.EMBO Rep. 2014 Apr;15(4):326-8. doi: 10.1002/embr.201438574. Epub 2014 Feb 21. EMBO Rep. 2014. PMID: 24562612 Free PMC article.
References
-
- Lara-Gonzalez P, Westhorpe FG, Taylor SS. The spindle assembly checkpoint. Curr Biol. 2012;22:R966–R980. - PubMed
-
- De Antoni A, Pearson CG, Cimini D, Canman JC, Sala V, Nezi L, Mapelli M, Sironi L, Faretta M, Salmon ED, Musacchio A. The Mad1/Mad2 complex as a template for Mad2 activation in the spindle assembly checkpoint. Curr Biol. 2005;15:214–225. - PubMed
-
- Chao WC, Kulkarni K, Zhang Z, Kong EH, Barford D. Structure of the mitotic checkpoint complex. Nature. 2012;484:208–213. - PubMed
Publication types
MeSH terms
Substances
LinkOut - more resources
Full Text Sources
Other Literature Sources
Molecular Biology Databases
