

Top-down protein identification of proteasome proteins with nanoLC-FT-ICR-MS employing data-independent fragmentation methods
- PMID: 24478249
- PMCID: PMC4045009
- DOI: 10.1002/pmic.201300339
Top-down protein identification of proteasome proteins with nanoLC-FT-ICR-MS employing data-independent fragmentation methods
Abstract
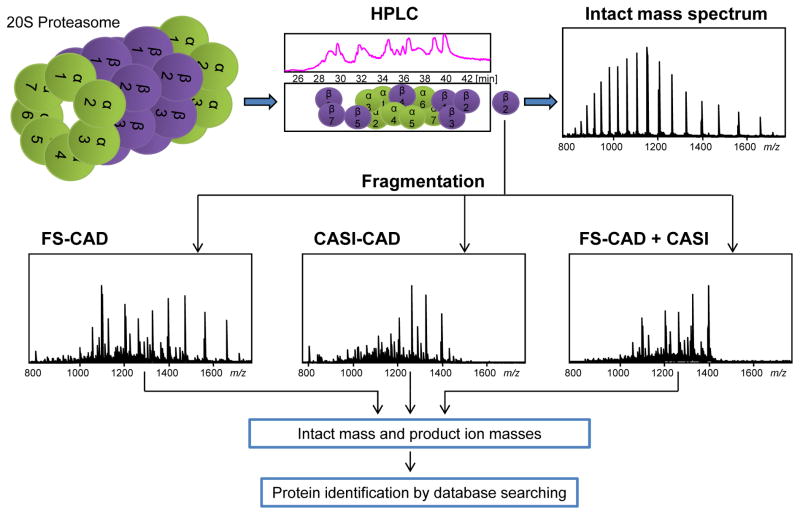
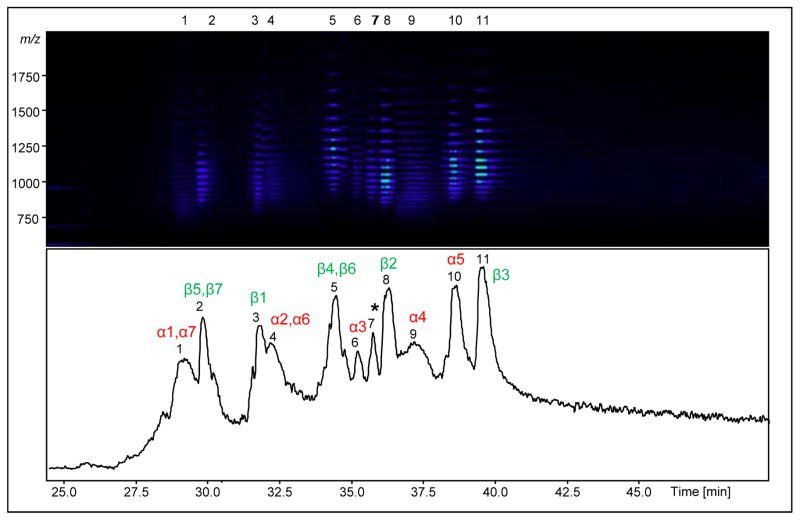
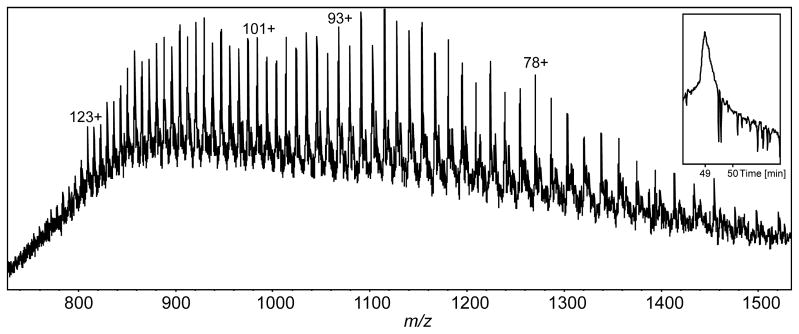
A comparison of different data-independent fragmentation methods combined with LC coupled to high-resolution FT-ICR-MS/MS is presented for top-down MS of protein mixtures. Proteins composing the 20S and 19S proteasome complexes and their PTMs were identified using a 15 T FT-ICR mass spectrometer. The data-independent fragmentation modes with LC timescales allowed for higher duty-cycle measurements that better suit online LC-FT-ICR-MS. Protein top-down dissociation was effected by funnel-skimmer collisionally activated dissociation (FS-CAD) and CASI (continuous accumulation of selected ions)-CAD. The N-termini for 9 of the 14 20S proteasome proteins were found to be modified, and the α3 protein was found to be phosphorylated; these results are consistent with previous reports. Mass-measurement accuracy with the LC-FT-ICR system for the 20- to 30-kDa 20S proteasome proteins was 1 ppm. The intact mass of the 100-kDa Rpn1 subunit from the 19S proteasome complex regulatory particle was measured with a deviation of 17 ppm. The CASI-CAD technique is a complementary tool for intact-protein fragmentation and is an effective addition to the growing inventory of dissociation methods that are compatible with online protein separation coupled to FT-ICR-MS.
Keywords: Electrospray ionization; Fourier transform-ion cyclotron resonance; Proteasome; Protein LC-MS; Technology; Top-down mass spectrometry.
© 2014 WILEY-VCH Verlag GmbH & Co. KGaA, Weinheim.
Conflict of interest statement
The authors have declared no conflict of interest.
Figures


Similar articles
-
A Top-Down Proteomics Platform Coupling Serial Size Exclusion Chromatography and Fourier Transform Ion Cyclotron Resonance Mass Spectrometry.Anal Chem. 2019 Mar 19;91(6):3835-3844. doi: 10.1021/acs.analchem.8b04082. Epub 2019 Feb 25. Anal Chem. 2019. PMID: 30758949 Free PMC article.
-
Fourier transform ion cyclotron resonance mass spectrometry with NanoLC/microelectrospray ionization and matrix-assisted laser desorption/ionization: analytical performance in peptide mass fingerprint analysis.J Am Soc Mass Spectrom. 2003 Jun;14(6):553-61. doi: 10.1016/S1044-0305(03)00138-7. J Am Soc Mass Spectrom. 2003. PMID: 12781456
-
Identification of the molecular composition of the 20S proteasome of mouse intestine by high-resolution mass spectrometric proteome analysis.Methods Mol Biol. 2009;564:173-86. doi: 10.1007/978-1-60761-157-8_10. Methods Mol Biol. 2009. PMID: 19544023
-
Towards analytically useful two-dimensional Fourier transform ion cyclotron resonance mass spectrometry.Anal Bioanal Chem. 2013 Jan;405(1):51-61. doi: 10.1007/s00216-012-6422-8. Epub 2012 Oct 18. Anal Bioanal Chem. 2013. PMID: 23076397 Review.
-
Screening of synthetic PDE-5 inhibitors and their analogues as adulterants: analytical techniques and challenges.J Pharm Biomed Anal. 2014 Jan;87:176-90. doi: 10.1016/j.jpba.2013.04.037. Epub 2013 May 6. J Pharm Biomed Anal. 2014. PMID: 23721687 Review.
Cited by
-
Proton Transfer Charge Reduction Enables High-Throughput Top-Down Analysis of Large Proteoforms.Anal Chem. 2019 Dec 17;91(24):15732-15739. doi: 10.1021/acs.analchem.9b03925. Epub 2019 Nov 22. Anal Chem. 2019. PMID: 31714757 Free PMC article.
-
Top-Down Protein Identification using a Time-of-Flight Mass Spectrometer and Data Independent Acquisition.Int J Mass Spectrom. 2019 Jan;435:136-144. doi: 10.1016/j.ijms.2018.10.023. Epub 2018 Oct 22. Int J Mass Spectrom. 2019. PMID: 31105465 Free PMC article.
-
Unsupervised Structural Classification of Dissolved Organic Matter Based on Fragmentation Pathways.Environ Sci Technol. 2022 Jan 18;56(2):1458-1468. doi: 10.1021/acs.est.1c04726. Epub 2022 Jan 4. Environ Sci Technol. 2022. PMID: 34981937 Free PMC article.
-
Fourier-transform ion cyclotron resonance mass spectrometry for characterizing proteoforms.Mass Spectrom Rev. 2022 Mar;41(2):158-177. doi: 10.1002/mas.21653. Epub 2020 Sep 7. Mass Spectrom Rev. 2022. PMID: 32894796 Free PMC article. Review.
References
-
- Kocher T, Pichler P, Swart R, Mechtler K. Analysis of protein mixtures from whole-cell extracts by single-run nanoLC-MS/MS using ultralong gradients. Nature Protocols. 2012;7:882–890. - PubMed
-
- Di Palma S, Hennrich ML, Heck AJ, Mohammed S. Recent advances in peptide separation by multidimensional liquid chromatography for proteome analysis. J Proteomics. 2012;75:3791–3813. - PubMed
-
- Zhang Z. Automated Precursor Ion Exclusion During LC-MS/MS Data Acquisition for Optimal Ion Identification. J Am Soc Mass Spectrom. 2012;23:1400–1407. - PubMed
-
- Kelleher NL, Lin HY, Valaskovic GA, Aaserud David J, et al. Top Down versus Bottom Up Protein Characterization by Tandem High-Resolution Mass Spectrometry. J Am Chem Soc. 1999;121:806–812.
-
- Loo JA, Edmonds CG, Smith RD. Primary sequence information from intact proteins by electrospray ionization tandem mass spectrometry. Science. 1990;248:201–204. - PubMed
Publication types
MeSH terms
Substances
Grants and funding
LinkOut - more resources
Full Text Sources
Other Literature Sources
Research Materials
Miscellaneous
