

Increased temperature variation poses a greater risk to species than climate warming
- PMID: 24478296
- PMCID: PMC3924069
- DOI: 10.1098/rspb.2013.2612
Increased temperature variation poses a greater risk to species than climate warming
Abstract
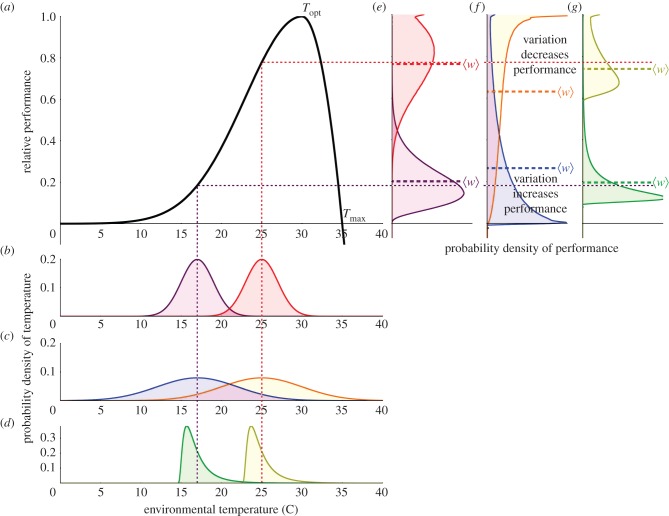
Increases in the frequency, severity and duration of temperature extremes are anticipated in the near future. Although recent work suggests that changes in temperature variation will have disproportionately greater effects on species than changes to the mean, much of climate change research in ecology has focused on the impacts of mean temperature change. Here, we couple fine-grained climate projections (2050-2059) to thermal performance data from 38 ectothermic invertebrate species and contrast projections with those of a simple model. We show that projections based on mean temperature change alone differ substantially from those incorporating changes to the variation, and to the mean and variation in concert. Although most species show increases in performance at greater mean temperatures, the effect of mean and variance change together yields a range of responses, with temperate species at greatest risk of performance declines. Our work highlights the importance of using fine-grained temporal data to incorporate the full extent of temperature variation when assessing and projecting performance.
Keywords: climate change; ectotherm; performance; temperature.
Figures

 of a species with thermal performance curve shown in figure 1 as a function of the mean, standard deviation and skewness (a–c) of a normal distribution environmental temperature. Relative performance values below −1 are shaded in dark grey and are not resolved as they decrease quickly beyond this point. Along σ = 0, where no environmental variation is present, contours are given exactly by the TPC. In regions to the left of the white lines, an increase in the mean temperature yields an increase in performance; to the right of the white line, an increase in mean temperature yields a decrease in performance. Exact values of
  are given by
  .
.
Similar articles
-
Fine-Scale Microclimatic Variation Can Shape the Responses of Organisms to Global Change in Both Natural and Urban Environments.Integr Comp Biol. 2016 Jul;56(1):45-61. doi: 10.1093/icb/icw016. Epub 2016 Apr 23. Integr Comp Biol. 2016. PMID: 27107292 Review.
-
Temperature tracking by North Sea benthic invertebrates in response to climate change.Glob Chang Biol. 2015 Jan;21(1):117-29. doi: 10.1111/gcb.12726. Epub 2014 Oct 13. Glob Chang Biol. 2015. PMID: 25179407
-
Potential for thermal tolerance to mediate climate change effects on three members of a cool temperate lizard genus, Niveoscincus.J Therm Biol. 2015 Aug;52:14-23. doi: 10.1016/j.jtherbio.2015.05.002. Epub 2015 May 6. J Therm Biol. 2015. PMID: 26267494
-
Climatic predictors of temperature performance curve parameters in ectotherms imply complex responses to climate change.Am Nat. 2011 Jun;177(6):738-51. doi: 10.1086/660021. Am Nat. 2011. PMID: 21597251
-
Life in the Frequency Domain: the Biological Impacts of Changes in Climate Variability at Multiple Time Scales.Integr Comp Biol. 2016 Jul;56(1):14-30. doi: 10.1093/icb/icw024. Epub 2016 Jun 1. Integr Comp Biol. 2016. PMID: 27252201 Review.
Cited by
-
Temperature fluctuations in a warmer environment: impacts on microbial plankton.Fac Rev. 2021 Jan 29;10:9. doi: 10.12703/r/10-9. eCollection 2021. Fac Rev. 2021. PMID: 33659927 Free PMC article. Review.
-
Simulating the germination response to diurnally alternating temperatures under climate change scenarios: comparative studies on Carex diandra seeds.Ann Bot. 2015 Feb;115(2):201-9. doi: 10.1093/aob/mcu234. Epub 2015 Jan 5. Ann Bot. 2015. PMID: 25564469 Free PMC article.
-
Can altered magnetic field affect the foraging behaviour of ants?PLoS One. 2019 Nov 25;14(11):e0225507. doi: 10.1371/journal.pone.0225507. eCollection 2019. PLoS One. 2019. PMID: 31765398 Free PMC article.
-
Temperature fluctuations and maternal estrogens as critical factors for understanding temperature-dependent sex determination in nature.J Exp Zool A Ecol Integr Physiol. 2018 Apr;329(4-5):177-184. doi: 10.1002/jez.2183. Epub 2018 May 28. J Exp Zool A Ecol Integr Physiol. 2018. PMID: 29806743 Free PMC article. Review.
-
Topography influences diurnal and seasonal microclimate fluctuations in hilly terrain environments of coastal California.PLoS One. 2024 Mar 29;19(3):e0300378. doi: 10.1371/journal.pone.0300378. eCollection 2024. PLoS One. 2024. PMID: 38551923 Free PMC article.
References
-
- Parmesan C, Yohe G. 2003. A globally coherent fingerprint of climate change impacts across natural systems. Nature 421, 37–42 (doi:10.1038/nature01286) - DOI - PubMed
-
- Tylianakis JM, Didham RK, Bascompte J, Wardle DA. 2008. Global change and species interactions in terrestrial ecosystems. Ecol. Lett. 11, 1351–1363 (doi:10.1111/j.1461-0248.2008.01250.x) - DOI - PubMed
-
- Lavergne S, Mouquet N, Thuiller W, Ronce O. 2010. Biodiversity and climate change: integrating evolutionary and ecological responses of species and communities. Annu. Rev. Ecol. Evol. Syst. 41, 321–350 (doi:10.1146/annurev-ecolsys-102209-144628) - DOI
-
- Thompson RM, Beardall J, Beringer J, Grace M, Sardina P. 2013. Means and extremes: building variability into community-level climate change experiments. Ecol. Lett. 16, 799–806 (doi:10.1111/ele.12095) - DOI - PubMed
-
- Deutsch CA, Tewksbury JJ, Huey RB, Sheldon KS, Ghalambor CK, Haak DC, Martin PR. 2008. Impacts of climate warming on terrestrial ectotherms across latitude. Proc. Natl Acad. Sci. USA 105, 6668–6672 (doi:10.1073/pnas.0709472105) - DOI - PMC - PubMed
Publication types
MeSH terms
LinkOut - more resources
Full Text Sources
Other Literature Sources
Medical
