. 2014 Jan 29;34(5):1701-9.
doi: 10.1523/JNEUROSCI.4445-13.2014.

Trans-spinal direct current stimulation alters muscle tone in mice with and without spinal cord injury with spasticity

Affiliations

Trans-spinal direct current stimulation alters muscle tone in mice with and without spinal cord injury with spasticity

Zaghloul Ahmed. J Neurosci. .

Abstract

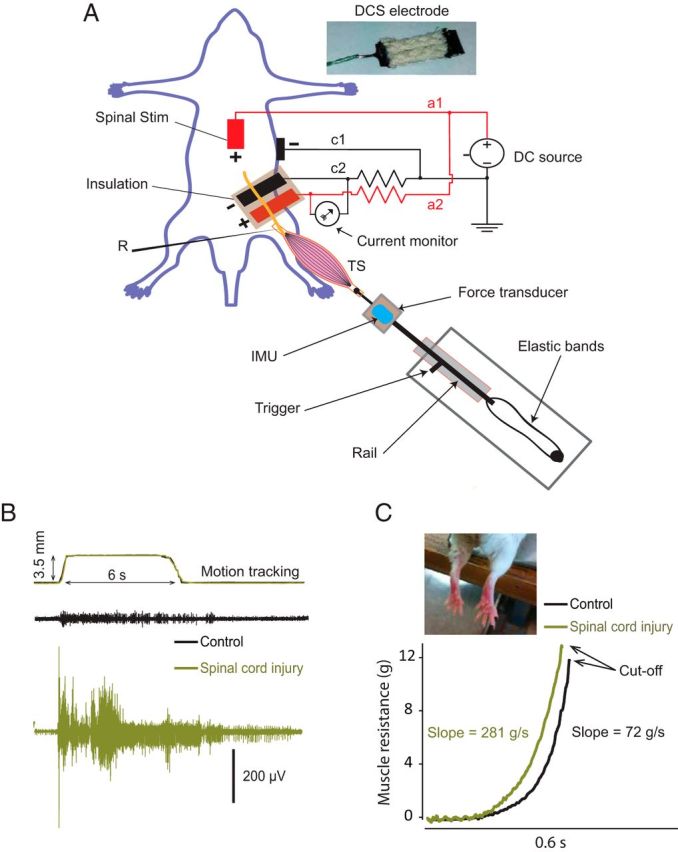
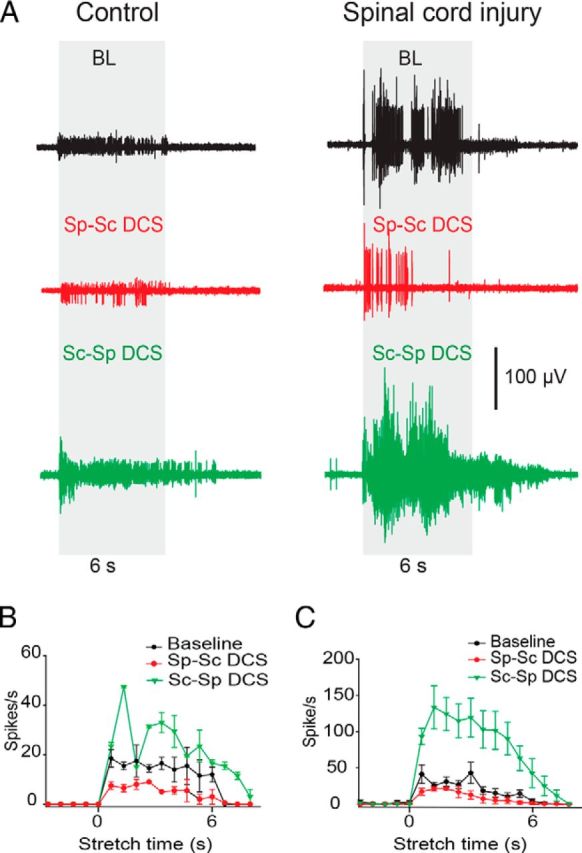
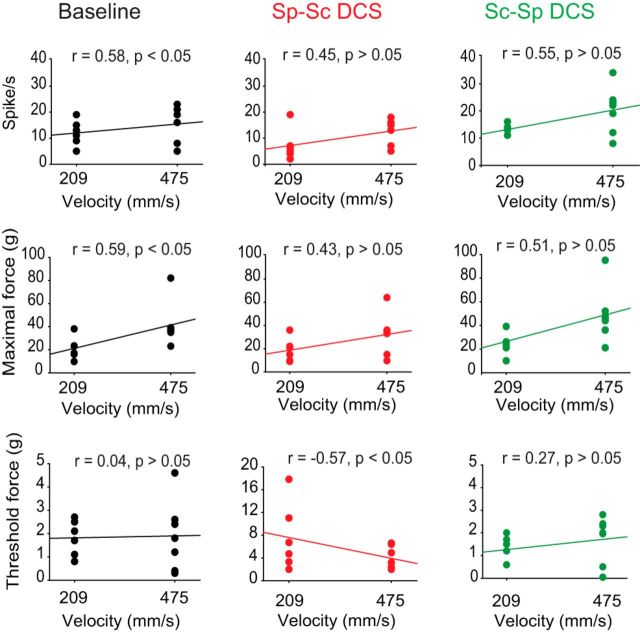
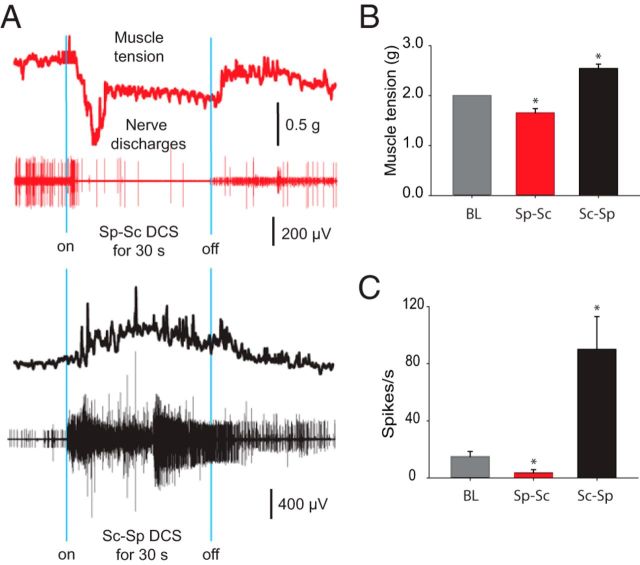
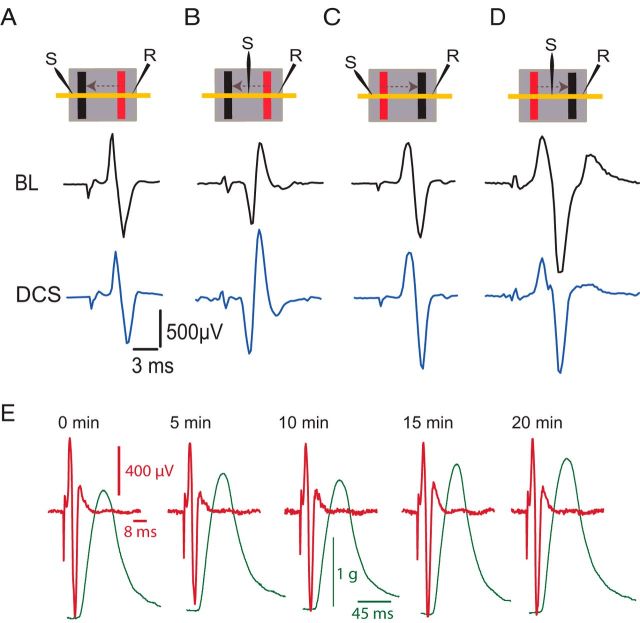
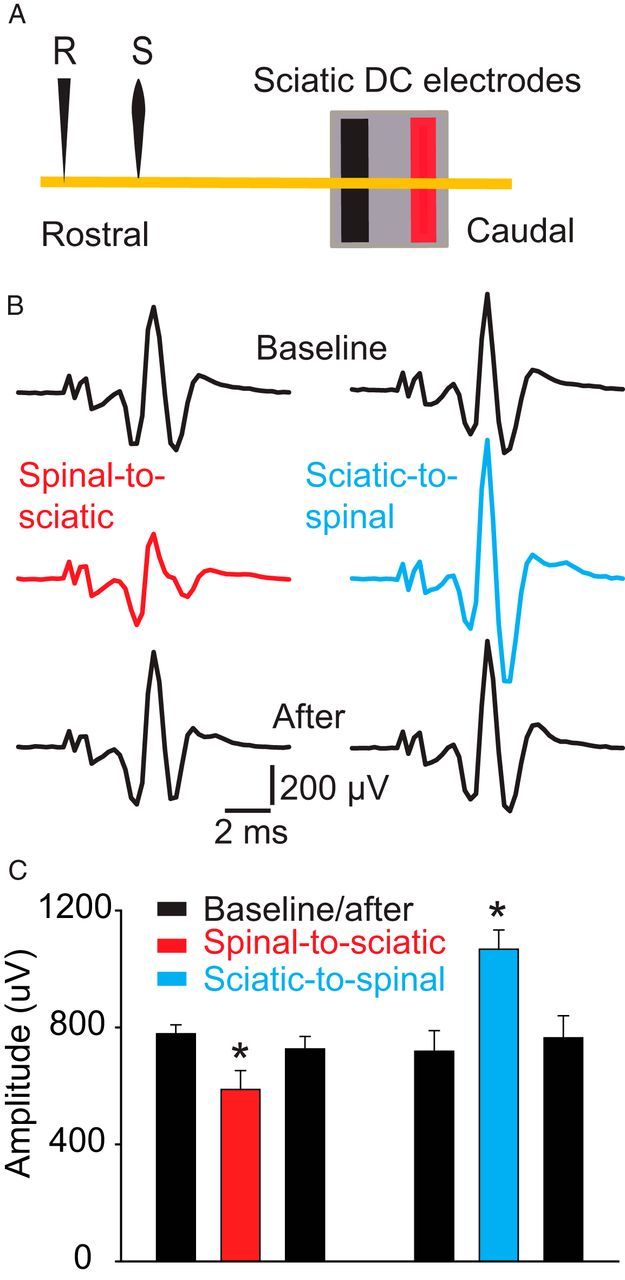
Muscle tone abnormalities are associated with many CNS pathologies and severely limit recovery of motor control. Muscle tone depends on the level of excitability of spinal motoneurons and interneurons. The present study investigated the following hypotheses: (1) direct current flowing from spinal cord to sciatic nerve [spinal-to-sciatic direct current stimulation (DCS)] would inhibit spinal motor neurons and interneurons, hence reducing muscle tone; and (2) direct current flowing in the opposite direction (sciatic-to-spinal DCS) would excite spinal motor neurons and interneurons, hence increasing muscle tone. Current intensity was biased to be ~170 times greater at the spinal column than at the sciatic nerve. The results showed marked effects of DCS on muscle tone. In controls and mice with spinal cord injuries with spasticity, spinal-to-sciatic DCS reduced transit and steady stretch-induced nerve and muscle responses. Sciatic-to-spinal DCS caused opposite effects. These findings provide the first direct evidence that trans-spinal DCS can alter muscle tone and suggest that this approach could be used to reduce both hypotonia and hypertonia.

Keywords: direct current; sciatic nerve; spasticity; spinal cord.


Figures

Figure 1.
Figure 1.
A, Experimental setup to stretch the TS muscle, record tibial nerve compound action potential (R), and deliver spinal-to-sciatic DCS. The anode (+) is split into a1, which carries unattenuated current to the thoracolumbar spinal column, and a2, which carries attenuated current through a 10 MΩ resistor to a stainless steel electrode plate. The cathode was divided into c1, which carries unattenuated current to the abdominal skin, and c2, which carries attenuated current through a 10 MΩ resistor to the sciatic nerve. The stretch apparatus consists of a rail and a carriage. A number of elastic bands are attached between the rail and the base. A force transducer and IMU are fixed to the carriage. The carriage can be stopped at any position by a handle (trigger). Inset (top) shows tsDC electrode, covered with wick fabric. B, Top, A recording (two traces) from the IMU tracking the movement of the stretch apparatus, showing that the stretch apparatus movements are identical. The bottom two panels show samples of stretch responses recorded from the tibial nerve in control (black) and SCI animals (green). Note that no DCS was applied during these recordings. C, Two examples of reflex force traces were recorded by the force transducer during 209 mm/s lengthening velocity: control animal (black trace) and spinal cord injured animal (green trace). The mean slope of the rising phase (5–50% after initiation) is shown, and the cutoff is at peak force or the end of the dynamic phase of stretches. The inset shows a photograph of the hindlimbs of an animal with SCI, showing signs of spastic patterns. Stim, Stimulation.
Figure 2.
Figure 2.
DCS altered slow-velocity, stretch-induced nerve discharges in control and injured animals. A, Examples of stretch-induced discharges during the following three conditions: (1) no-DCS [baseline (BL)], top (black); (2) spinal-to-sciatic (Sp-Sc) DCS, middle (red); and (3) sciatic-to-spinal (Sc-Sp) DCS, bottom (green). B, Summary plot showing stretch-induced discharges in control animals. C, Summary plot showing stretch-induced discharges in animals with SCI. Data are shown as the mean ± SEM.
Figure 3.
Figure 3.
DCS altered the slope of muscle resistance during the dynamic phase of stretch. A, Traces of muscle resistance recorded during low-velocity stretches in control animals. Cutoff ends at peak force. B, Summary plot showing that the slope of muscle resistance in control animals was reduced by spinal-to-sciatic (Sp-Sc) DCS and increased by sciatic-to-spinal (Sc-Sp) DCS. C, Traces of muscle resistance recorded during low-velocity stretches in animals with SCI. D, Summary plot showing that the slope of muscle resistance in animals with SCI was reduced by spinal-to-sciatic DCS and increased by sciatic-to-spinal DCS. *p < 0.05. Data are shown as the mean ± SEM.
Figure 4.
Figure 4.
Scatter plots showing the effects of lengthening velocity and DCS on maximal force, firing rate, and threshold force in mice with SCI. At baseline (left panels, black trace), both maximal force and firing rate were velocity dependent; however, threshold force was velocity independent. During spinal-to-sciatic (Sp-Sc) DCS (middle panels, red trace), both maximal force and firing rate were velocity independent; however, threshold force was velocity dependent. During sciatic-to-spinal (Sc-Sp) DCS (right panels, green trace), maximal force, firing rate, and threshold force were velocity independent.
Figure 5.
Figure 5.
Effects of DCS on steady-state muscle tension. TS muscle was slightly stretched (2 g tension). A, Representative muscle force traces and concurrent nerve discharges during DCS. Top (red trace), Spinal-to-sciatic (Sp-Sc) DCS reduced muscle tension and nerve discharges. Bottom (black trace), Sciatic-to-spinal (Sc-Sp) DCS increased muscle tension and nerve discharges. B, Summary plot showing that muscle tension was decreased by spinal-to-sciatic DCS, but was increased by sciatic-to-spinal DCS. *p < 0.05. C, Summary plot showing that nerve discharges were decreased by spinal-to-sciatic DCS, but were increased by sciatic-to-spinal DCS. *p < 0.05. Data are shown as the mean ± SEM.
Figure 6.
Figure 6.
Effects of DCS on local nerve excitability. A, DCS-induced changes at the nerve. Insets at the top of the figure show the arrangement of stimulating (S) and recording (R) electrodes, and DC electrodes (cathode, black; anode, red) on the sciatic nerve (yellow horizontal line). Arrows indicate the direction of current. Note that the recording electrode is located caudal to the body, and the stimulating electrode rostral to the body. The dark background represents the silicone rubber that isolates the nerve and electrodes from the rest of the body. The lower panels show traces of nerve compound action potential recorded during baseline (BL), and during spinal-to-sciatic DCS. B, Spinal-to-sciatic DCS increased nerve compound action potential evoked by test stimulation between the two DCS electrodes. C, Sciatic-to-spinal DCS increased nerve compound action potential evoked by distal test stimulation. D, Spinal-to-sciatic DCS reduced nerve compound action potential evoked by test stimulation between the two sciatic DCS electrodes. E, Examples of nerve compound action potentials (red) and concurrent muscle twitches (green) recorded after DCS (0–20 min). This shows no damaging effect of DCS protocols used in the present study.
Figure 7.
Figure 7.
Effects of DCS on the proximal segment of the sciatic nerve. A, Schematic diagram showing the experimental setup. The yellow line represents the sciatic nerve. Note that the recording electrode (R) was located ∼2 cm rostral to the sciatic nerve DC electrode. The stimulating electrode (S) was ∼7 mm caudal to the recording electrode. B, Examples of nerve compound action potentials recorded antidromically. C, Summary plot showing that the nerve compound action potential was reduced during spinal-to-sciatic DCS and increased during sciatic-to-spinal DCS. *p < 0.05. Data are shown as the mean ± SEM.

References

    1. Adams MM, Hicks AL. Spasticity after spinal cord injury. Spinal Cord. 2005;43:577–586. doi: 10.1038/sj.sc.3101757. - DOI - PubMed
    1. Agnew WF, McCreery DB, Yuen TG, Bullara LA. Histologic and physiologic evaluation of electrically stimulated peripheral nerve: considerations for the selection of parameters. Ann Biomed Eng. 1989;17:39–60. doi: 10.1007/BF02364272. - DOI - PubMed
    1. Ahmed Z. Trans-spinal direct current stimulation modulates motor cortex-induced muscle contraction in mice. J Appl Physiol. 2011;110:1414–1424. doi: 10.1152/japplphysiol.01390.2010. - DOI - PubMed
    1. Ahmed Z. Electrophysiological characterization of spino-sciatic and cortico-sciatic associative plasticity: modulation by trans-spinal direct current and effects on recovery after spinal cord injury in mice. J Neurosci. 2013a;33:4935–4946. doi: 10.1523/JNEUROSCI.4930-12.2013. - DOI - PMC - PubMed
    1. Ahmed Z. Effects of cathodal trans-spinal direct current stimulation on mouse spinal network and complex multijoint movements. J Neurosci. 2013b;33:14949–14957. doi: 10.1523/JNEUROSCI.2793-13.2013. - DOI - PMC - PubMed

Publication types