. 2014 Jan 29;34(5):1949-62.
doi: 10.1523/JNEUROSCI.2966-13.2014.

Cerebellar potentiation and learning a whisker-based object localization task with a time response window

Affiliations

Cerebellar potentiation and learning a whisker-based object localization task with a time response window

Negah Rahmati et al. J Neurosci. .

Abstract

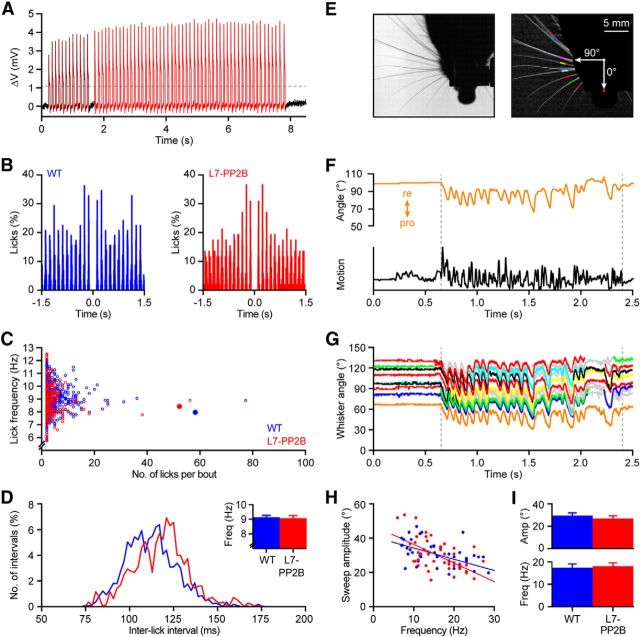
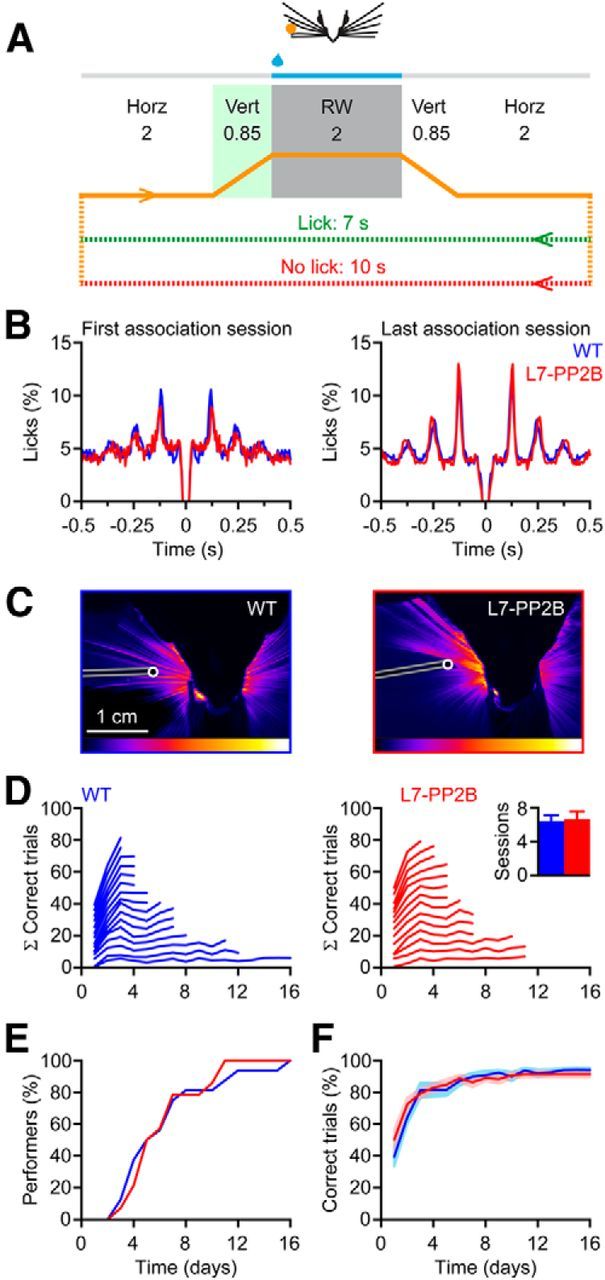
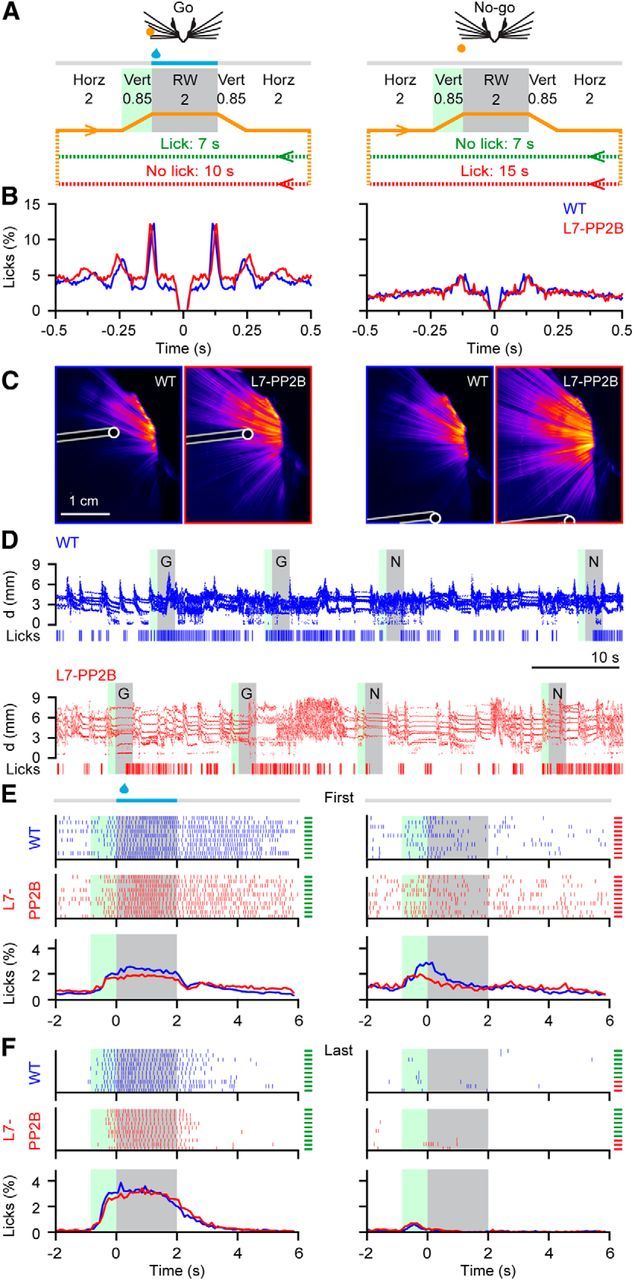
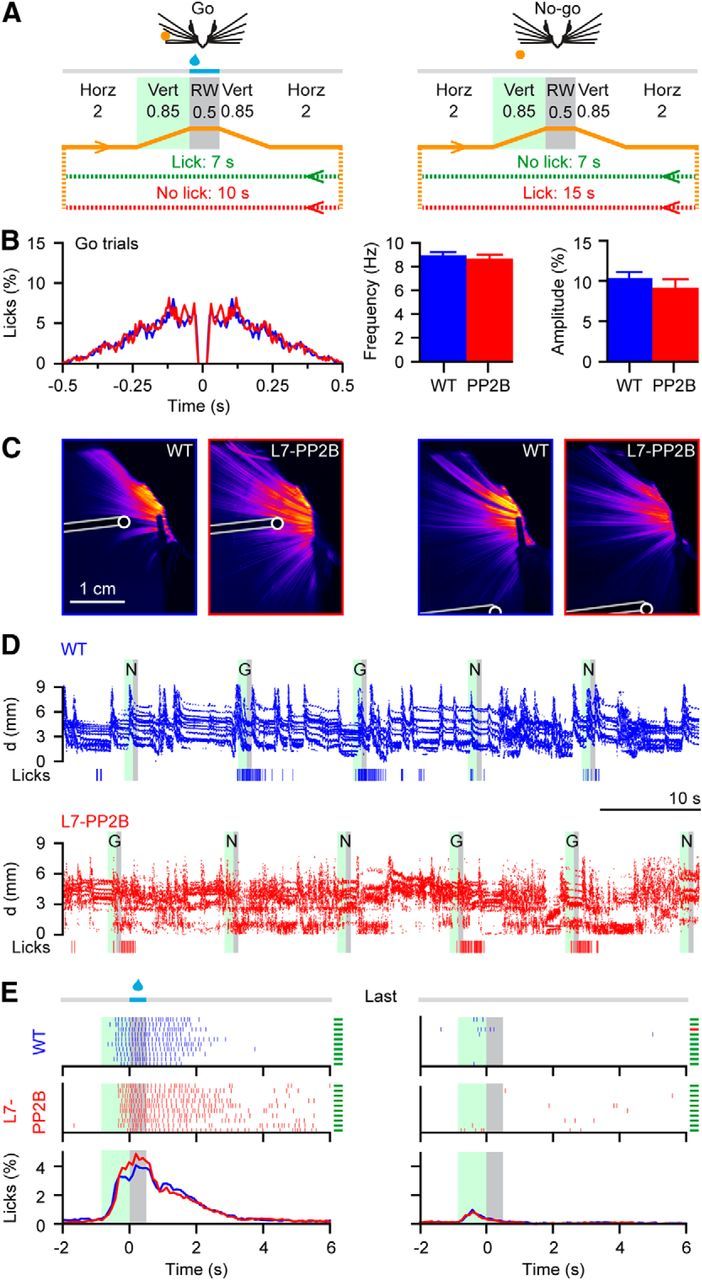
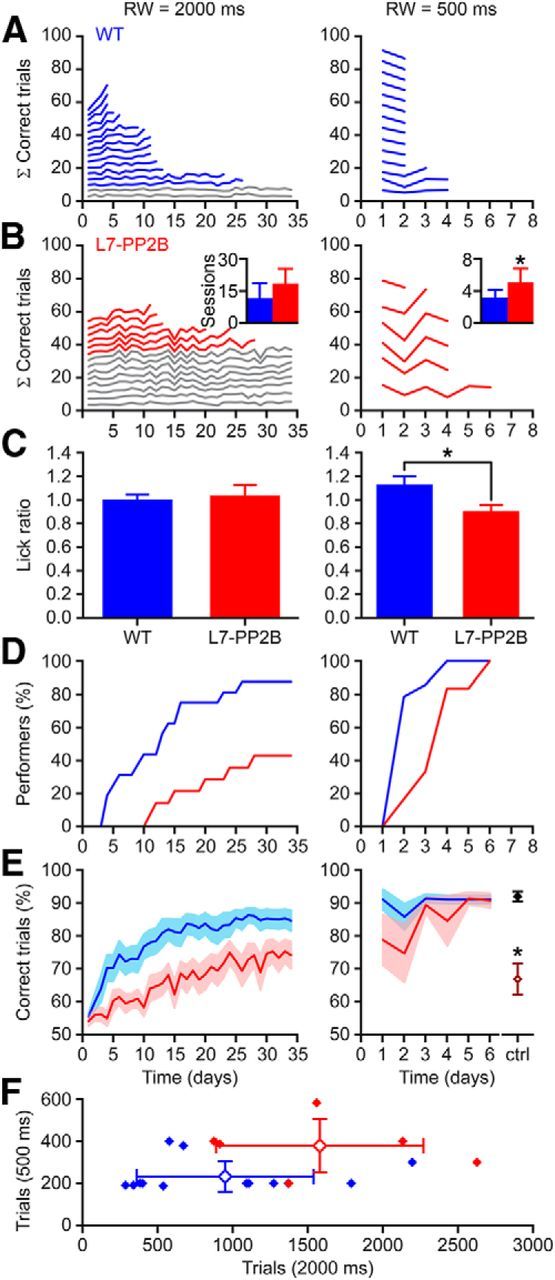
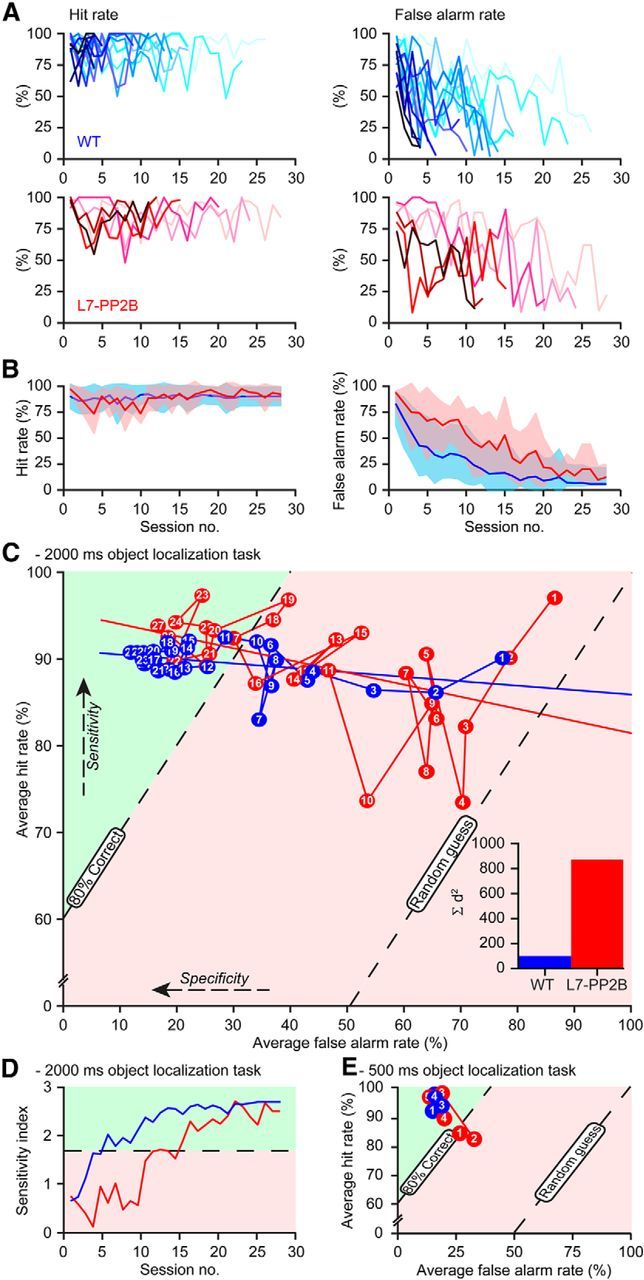
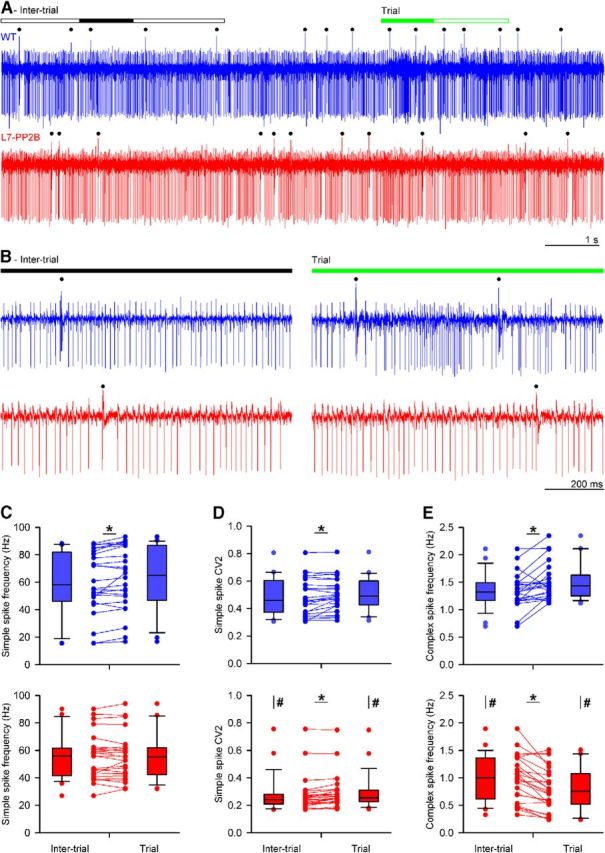
Whisker-based object localization requires activation and plasticity of somatosensory and motor cortex. These parts of the cerebral cortex receive strong projections from the cerebellum via the thalamus, but it is unclear whether and to what extent cerebellar processing may contribute to such a sensorimotor task. Here, we subjected knock-out mice, which suffer from impaired intrinsic plasticity in their Purkinje cells and long-term potentiation at their parallel fiber-to-Purkinje cell synapses (L7-PP2B), to an object localization task with a time response window (RW). Water-deprived animals had to learn to localize an object with their whiskers, and based upon this location they were trained to lick within a particular period ("go" trial) or refrain from licking ("no-go" trial). L7-PP2B mice were not ataxic and showed proper basic motor performance during whisking and licking, but were severely impaired in learning this task compared with wild-type littermates. Significantly fewer L7-PP2B mice were able to learn the task at long RWs. Those L7-PP2B mice that eventually learned the task made unstable progress, were significantly slower in learning, and showed deficiencies in temporal tuning. These differences became greater as the RW became narrower. Trained wild-type mice, but not L7-PP2B mice, showed a net increase in simple spikes and complex spikes of their Purkinje cells during the task. We conclude that cerebellar processing, and potentiation in particular, can contribute to learning a whisker-based object localization task when timing is relevant. This study points toward a relevant role of cerebellum-cerebrum interaction in a sophisticated cognitive task requiring strict temporal processing.


Figures

Figure 1.
Figure 1.
L7-PP2B mice do not have motor deficits preventing normal rhythmic licking and whisking. A, A period of rhythmic licking in a freely moving L7-PP2B mouse. Licks can be seen as positive deflections of the junction potential between the spout of the drinking bottle and an aluminum floor plate in the home cage. This licking period consisted of two individual licking bouts, as indicated by two colors. The dashed line indicates the threshold used for automated lick detection. B, Auto-correlograms of licking bouts in a WT mouse (left) and an L7-PP2B mouse (right). The right panel is the auto-correlogram of the second licking bout (depicted in red) in A. The bins were normalized with respect to the center bin that was removed to improve visibility. C, Both WT and L7-PP2B mice displayed short and long licking bouts with lick frequencies predominantly between 6 and 12 Hz. Shorter licking bouts tended to vary more in lick frequency than long bouts in both genotypes. The auto-correlograms shown in B are taken from the bouts that are indicated with larger, filled symbols. D, Histograms of all interlick intervals within licking bouts showed similar distributions in WT and L7-PP2B mice, indicating that L7-PP2B mice had no motor deficits preventing them from licking rhythmically. The histograms were made with a bin size of 2 ms, and the area under the plot was normalized to 100%. Inset, Licking frequency ± SEM averaged per mouse (n = 9 WT mice and 10 L7-PP2B mice; p = 0.773). E, Whisker movements were quantified from high-speed video recordings. In each frame, the proximal parts of the whiskers were tracked with small line segments (colored lines in the right plot). Whisker angles were measured relative to the body axis. F, Whisker motion during a whisking bout was tracked manually (top) and characterized using the motion detection algorithm (bottom; see Materials and Methods). It can be seen that the motion detection reliably captured the duration of the whisker movements. G, The same fragment was subsequently analyzed using automated line detection and subsequent post-processing to detect movements of individual whiskers (see Materials and Methods); tracks with >500 data points are shown with randomly assigned colors, while shorter tracks are shown in gray. The orange trace refers to the same whisker that had been tracked manually (top trace in F). H, There is a clear negative correlation between the frequency and amplitude of a whisker bout: the higher the frequency, the smaller the movements. Linear regression lines of WT mice (n = 47 bouts from 10 mice) and L7-PP2B mice (n = 46 bouts from 11 mice) data were not significantly different from each other (z = 1.579; p = 0.114). I, Neither the amplitude nor the frequency of whisker bouts was significantly different between WT and L7-PP2B mice (p = 0.378 and p = 0.784, respectively).
Figure 2.
Figure 2.
Mice learn to lick after feeling a stimulus bar in their whisker field. A, Learning paradigm. During the association task, mice were subjected only to go trials and learned to lick following whisker contact with a metal bar (orange dot) within a 2000 ms RW. Once the stimulation bar completed the horizontal movement from the (neutral) resting position to the go position, it moved vertically into the whisker field. Whisker contact with the stimulation bar became possible approximately half way through the time interval allotted for the vertical movement. To indicate this, we marked the time period of the vertical movement with a green shading. The RW started after the completion of the vertical movement and is indicated with a gray shading. Correct responses triggered a water reward; incorrect responses postponed the next trial. B, Mice licked rhythmically during the RW of the association phase. Over the sessions, the mice increased their licking rhythmicity, as demonstrated by the increase of the amplitudes of the side peaks at approximately 125 ms [corresponding to a dominant lick frequency of 8 Hz; compare with naive mice (during the first association session) in the left panel and trained mice (during the last association session) in the right panel]. The auto-correlograms were made with a bin size of 5 ms and were normalized to the center peak (which is not shown to improve clarity). C, SD projection plot showing a representative example of whisker movement during the RW. The color bar at the bottom indicates the amount of movement (black, no change; white, maximal change). It can be seen that both mice moved their whiskers actively during the RW and touched the stimulus bar. D, Summed learning curves during the association phase (see Materials and Methods). The inset shows the average number of sessions required to reach the criterion. Error bars indicate SD. E, Cumulative histogram of the percentage of mice that reached criterion, showing that WT and L7-PP2B mice learned the association task at a similar rate. F, The fraction of correct trials over the sessions. Dark lines show the averages, and the shaded areas cover the average ± SEM.
Figure 3.
Figure 3.
Motor behavior during the object localization task with an RW of 2000 ms. A, Learning paradigm. During the object localization task, mice were subjected not only to go trials, but also to no-go trials. The mice had to learn to lick during the RW of the go trials, but not during that of the no-go trials. Once the stimulation bar completed the horizontal movement from the (neutral) resting position to the go or the no-go position, it moved vertically into (go) or just in front of (no-go) the whisker field. Whisker contact with the stimulation bar became possible at approximately half way through the time interval allotted for the vertical movement. To indicate this, we marked the time period of the vertical movement with a green shading. The RW started after the completion of the vertical movement and is indicated with a gray shading. Licks during the RW of go trials triggered a water reward; incorrect responses postponed the next trial. B, Mice licked rhythmically during the RW. Rhythmic licking was more prevalent during the go trials, when there was water, than during no-go trials, when there was no water. C, SD projection plots showing representative examples of whisker movement during the RW. It can be seen that both mice moved their whiskers actively during the RW and touched the stimulus bar, in both the go and the no-go trials. D, Whisker movements during the first association phase illustrating that mice of both genotypes whisk often during the task. Plotted are the rostrocaudal positions of the center whiskers at ∼3 mm from the snout. Gray areas indicate the RW, and green areas indicate the periods of the preceding vertical movement. Go trials are indicated with a “G,” no-go trials with an “N.” Longer intertrial intervals indicate incorrect responses. E, Raster plots of lick times showing the first 10 go (left) and no-go trials (right) of representative experiments during the first session of the 2000 ms object localization task. The two top panels show raster plots for a single individual per genotype. The lines at the right border of the plot indicate whether the trial was performed correctly (green) or incorrectly (red). The bottom panel shows the histograms of the relative timing of the licks over all trials averaged for all performers. The green area (850 ms) refers to the interval during which the stimulation bar moved vertically, either into (go trials) or in front of (no-go trials) the resting position of the whisker field. The gray area indicates the response window (2000 ms). F, Same as in E for the last session of the 2000 ms.
Figure 4.
Figure 4.
Motor behavior during the object localization task with an RW of 500 ms. A, Learning paradigm. Once the stimulation bar completed the horizontal movement from the (neutral) resting position to the go or the no-go position, it moved vertically into (go) or just in front of (no-go) the whisker field. Whisker contact with the stimulation bar became possible approximately around half way during the time interval allotted for the vertical movement. To indicate this, we marked the time period of the vertical movement with a green shading. The RW started after the completion of the vertical movement and is indicated with gray shading. Licks during the RW of go trials triggered a water reward; incorrect responses postponed the next trial. B, Mice licked rhythmically during the RW of go trials of the last 500 ms object localization session. At this stage, the mice performed so well that licking during no-go trials was really sparse and that there were not enough licks during the RW of no-go trials to permit quantitative analysis. C, SD projection plot showing a representative example of whisker movement during the RW. It can be seen that both mice moved their whiskers actively during the RW and touched the stimulus bar, both in the go and in the no-go trials. D, Example traces of whisker movements during the last session of the 500 ms object localization task, illustrating that mice of both genotypes whisk often during the task. Plotted are the rostrocaudal positions of the center whiskers at ∼3 mm from the snout. Intertrial whisking occurs less often in trained mice than in naive mice (compare Fig. 3D). Licks are indicated in the bottom rows. Go trials are indicated with a “G,” no-go trials with an “N.” A longer intertrial interval indicates an incorrect response. E, Raster plots of lick times showing the last 10 go (left) and no-go trials (right) of representative experiments during the first session of the 500 ms object localization task. The two top panels show raster plots for a single individual per genotype. The lines at the right border of the plot indicate whether the trial was performed correctly (green) or incorrectly (red). The bottom panel shows the histograms of the relative timing of the licks over all trials averaged for all performers. The green area (850 ms) refers to the interval during which the stimulation bar moved vertically, either into (go trials) or in front of (no-go trials) the resting position of the whisker field. The gray area indicates the response window (500 ms).
Figure 5.
Figure 5.
The absence of PP2B in cerebellar Purkinje cells impairs learning of a whisker-based object localization task. A, Summed learning curves of WT mice during the 2000 ms (left) and the 500 ms (right) object localization task across consecutive sessions (x-axis). The number of trials per session was normalized to 100% (for details, see Materials and Methods). Upon reaching a success rate of ≥80% during two consecutive sessions, mice continued to the next phase. Performers and nonperformers are indicated in blue and gray, respectively. B, Same as A for L7-PP2B mice (performers are indicated in red). Insets, Averaged number of sessions ± SD that performers needed to complete the entire object localization task; *p < 0.017 (t test). C, The fine timing of the lick responses at the end of the 100 ms period preceding the RW and at the first 100 ms period of the RW suggests a cerebellar role in the timing of the decision process to lick. We compared the number of licks during the first 100 ms of the RW and the 100 ms before the start of the RW, and thus the ratio of licks just after the availability of water and the licks just before the availability of water. This ratio equaled 1 during the last session of the 2000 ms object localization task (left), but was increased in trained WT mice (but not in L7-PP2B mice) during the last 500 ms object localization task (right); *p < 0.02. D, Cumulative histograms of the percentage of mice that reached criterion showing that more WT mice were able to learn the object localization task than L7-PP2B and that WT performers were faster than L7-PP2B performers. E, The fraction of correct trials over the sessions. Dark lines show the averages, and the shaded areas cover the average ± SEM. For a control, we clipped the whiskers of 10 mice (8 WT mice and 2 L7-PP2B mice) following successful completion of the 500 ms object localization task. Their performance level during the subsequent session (dark red open symbol) was comparable to that of naive mice and was much lower than that during the last session with intact whiskers (black closed symbol); *p < 0.001 (paired t test). F, The average numbers of trials the L7-PP2B mice needed to learn the 500 and 2000 ms object localization tasks were significantly greater than those in WT mice (p < 0.05).
Figure 6.
Figure 6.
WT mice have more efficient learning trajectories than L7-PP2B mice. A, The hit rates (licking during the RW of go trials; left) and the false alarm rates (licking during the RW of no-go trials; right) of all WT (top) and L7-PP2B (bottom) performers over the sessions of the 2000 ms object localization task. B, Averaged hit (left) and false alarm (right) rates of all performers. Dark lines indicate the average, and the shaded area the average ± SD. C, Average false alarm rates versus average hit rates in ROC space during the 2000 ms object localization task. Perfect classification of both the go trials and the no-go trials would be 0% false alarms and 100% hits. Successful trials (≥80% correct) can be found in the green area. Plotted are the averages of all WT (blue) and L7-PP2B (red) performers for 28 sessions (the session number is indicated on each symbol), which was the maximum number of sessions required to master the 2000 ms object localization task. Linear regression lines are indicated. Note that the WT mice decrease the number of false alarms from the beginning on, while the L7-PP2B mice first generally reduce the licking responses, regardless of the trial type. The linear regression lines of WT and L7-PP2B mice are not significantly different (z = 1.498; p = 0.134). Inset, Summed least-squares differences between the first 28 sessions and the linear regression lines for WT and L7-PP2B performers during the 2000 ms object localization task. D, The d′ of all animals (0 = chance performance; 1.68 = 80% correct trials). E, The same plot as C, but for the 500 ms object localization task. Note that the WT mice are in the green area from the start on, while the L7-PP2B mice initially show a decreased performance relative to the previous phases of the object localization tasks.
Figure 7.
Figure 7.
Differential Purkinje cell activity during the object localization task. A, Example single-unit traces of a WT (top) and a L7-PP2B (bottom) Purkinje cell in crus 1/crus 2 area of the cerebellum ipsilateral to the stimulus location in trained mice. The recording was divided into a trial period (consisting of the RW and the flanking periods of vertical movement of the stimulation bar) and an intertrial period (excluding the trial period and the flanking periods of horizontal movement of the stimulation bar; see Fig. 3A). The filled lines indicate the periods that are enlarged in B. Complex spikes are indicated with a black dot above the trace. The other downward deflections are the simple spikes. C–E, The firing characteristics of 24 WT and 25 L7-PP2B Purkinje cells are summarized with box plots for the simple spike frequency (C), simple spike CV2 (D), and complex spike frequency (E). Recordings were made after finishing the object localization training. The simple spike frequency was not significantly different between WT and L7-PP2B Purkinje cells. Only in WT Purkinje cells was there a modest, but significant, increase in simple spike frequency during the trial periods compared with the intertrial periods. The local variation (CV2) in simple spike firing was reduced in L7-PP2B compared with WT Purkinje cells. Yet, in both types of Purkinje cells the CV2 was increased during the trial periods. The complex spike frequency was reduced in L7-PP2B compared with WT Purkinje cells. The WT Purkinje cells showed an increase in complex spike firing during trial periods, whereas the L7-PP2B Purkinje cells showed a decrease during trial periods. #p < 0.05 (WT vs L7-PP2B); *p < 0.05 (trial vs intertrial).

References

    1. Aronoff R, Matyas F, Mateo C, Ciron C, Schneider B, Petersen CC. Long-range connectivity of mouse primary somatosensory barrel cortex. Eur J Neurosci. 2010;31:2221–2233. doi: 10.1111/j.1460-9568.2010.07264.x. - DOI - PubMed
    1. Axelrad H, Crepel F. Représentation sélective des vibrisses mystaciales au niveau des cellules de Purkinje du cervelet par la voie de fibres grimpantes chez le rat. C R Acad Sci Hebd Seances Acad Sci D. 1977;284:1321–1324. - PubMed
    1. Barski JJ, Dethleffsen K, Meyer M. Cre recombinase expression in cerebellar Purkinje cells. Genesis. 2000;28:93–98. doi: 10.1002/1526-968X(200011/12)28:3/4<93::AID-GENE10>3.0.CO;2-W. - DOI - PubMed
    1. Berg RW, Kleinfeld D. Rhythmic whisking by rat: retraction as well as protraction of the vibrissae is under active muscular control. J Neurophysiol. 2003;89:104–117. - PubMed
    1. Bosman LW, Koekkoek SK, Shapiro J, Rijken BF, Zandstra F, van der Ende B, Owens CB, Potters JW, de Gruijl JR, Ruigrok TJ, De Zeeuw CI. Encoding of whisker input by cerebellar Purkinje cells. J Physiol. 2010;588:3757–3783. doi: 10.1113/jphysiol.2010.195180. - DOI - PMC - PubMed

Publication types

MeSH terms

Substances