. 2011 Jul 11;18(3):1059-1072.
doi: 10.1109/JSTQE.2011.2161460.

Lensfree On-Chip Microscopy and Tomography for Bio-Medical Applications

Affiliations

Lensfree On-Chip Microscopy and Tomography for Bio-Medical Applications

Serhan O Isikman et al. IEEE J Sel Top Quantum Electron. .

Abstract

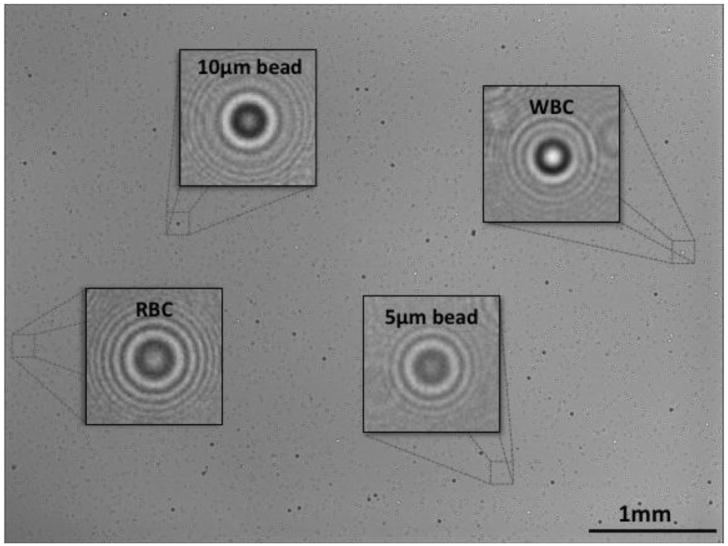
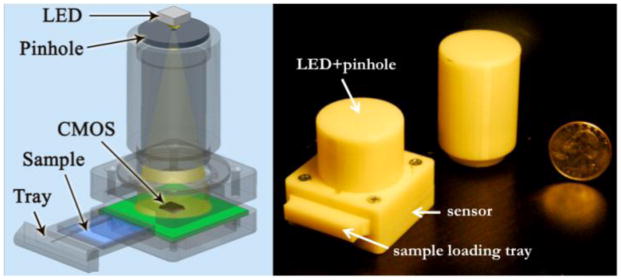
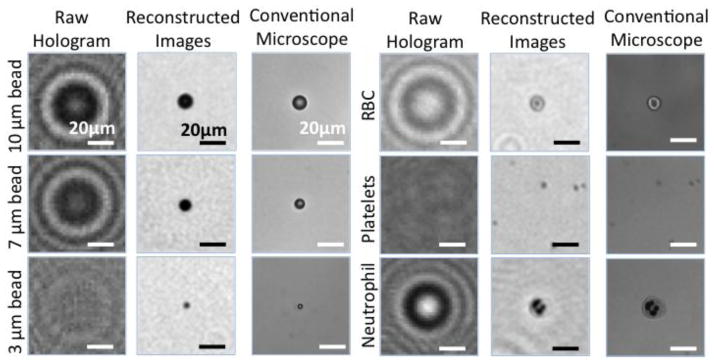
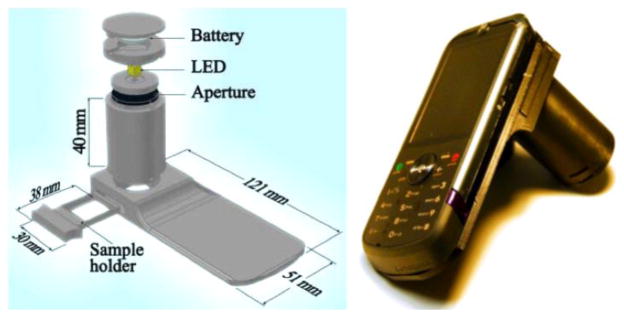
Lensfree on-chip holographic microscopy is an emerging technique that offers imaging of biological specimens over a large field-of-view without using any lenses or bulky optical components. Lending itself to a compact, cost-effective and mechanically robust architecture, lensfree on-chip holographic microscopy can offer an alternative toolset addressing some of the emerging needs of microscopic analysis and diagnostics in low-resource settings, especially for telemedicine applications. In this review, we summarize the latest achievements in lensfree optical microscopy based on partially coherent on-chip holography, including portable telemedicine microscopy, cell-phone based microscopy and field-portable optical tomographic microscopy. We also discuss some of the future directions for telemedicine microscopy and its prospects to help combat various global health challenges.

Keywords: cell-phone microscopy; global health; holographic pixel super-resolution; lensfree imaging; lensfree tomography; lensless on-chip imaging; telemedicine microscopy.


Figures

Fig. 1
Fig. 1
Schematic illustration of the lensfree on-chip holography platform is illustrated. The objects are placed directly on a digital sensor array with typically z2<5 mm distance to its active area. A partially-coherent light source, such as an LED, is placed z1~4–10 cm away from the objects, and filtered by a pinhole of diameter d~0.05–0.1 mm to record the digital inline holograms of objects with unit fringe magnification over a large field-of-view (FOV), e.g., 24 mm2.
Fig. 2
Fig. 2
A typical full FOV hologram of a heterogeneous sample recorded using an optoelectronic sensor array with 5 Mega Pixels (pixel size is 2.2 μm). The total imaging area of the above hologram is ~24 mm2, which is more than 10 times larger than the FOV of a standard 10× objective lens. The insets show holograms for a 10 μm micro-particle, a white blood cell (WBC), a red blood cell (RBC) and a 5 μm micro-particle. The holograms exhibit circular fringes, which are formed through the interference of the background illumination and the scattered object waves.
Fig. 3
Fig. 3
An illustration (left) and a photograph (right) of a lensfree telemedicine microscope that employs a single LED butt-coupled to a large pinhole (diameter ~0.1 mm) and an optoelectronic sensor. The cylindrical structure is simply a hollow tube within which the filtered LED light propagates before impinging on the objects, which are loaded onto the sensor-chip using the sample tray. Light tubes of different lengths can be interchangeably employed to tailor the degree of spatial coherence in the sensor plane depending on the requirements of the application.
Fig. 4
Fig. 4
Measured holograms and reconstructed lensfree images (using the microscope of Fig. 3) of different types of micro-objects including micro-beads, RBCs, WBCs and platelets are presented, and the results are compared against 40× objective-lens (NA: 0.65) images of the same FOV.
Fig. 5
Fig. 5
(a) Shows the results for automated holographic counting of RBCs in the hologram domain (pink curve) and the reconstructed image domain (blue curve) validated against manual microscope counts. (b) Shows automated counting of WBCs with <4% error for 8× and 12× diluted blood is shown. (c) Shows calculated volume histogram of RBCs validated against a Coulter counter result. (d) Shows hemoglobin density calculations for six different blood samples (blue dots) with <3% error as validated against commercial hematology analyzer (red curve) results.
Fig. 6
Fig. 6
(Left) Lensfree holographic imaging results (obtained with the microscope in Fig. 3) of homogeneous and heterogeneous samples of G. Lamblia cyst and C. Parvum are shown. Holographic reconstruction results (middle column) show very good agreement with the corresponding images obtained using a 40× objective-lens (NA-0.65) shown on the third column. Since conventional transmission microscope images of C. Parvum are rather faint, we used yellow colored arrows to point to their locations. (Right) Automated counting results for G. Lamblia cysts for 4 different water samples with different (and known) parasite concentrations are shown.
Fig. 7
Fig. 7
CAD drawing (left) and photography (right) of the holographic cell-phone microscope based on partially-coherent lensfree on-chip holography. The mechanical attachment, which converts a regular cell-phone with a CMOS sensor to a telemedicine microscope, weighs ~38 grams.
Fig. 8
Fig. 8
Summarizes our de-Bayering algorithm developed to create monochrome holographic images from Bayer patterned raw outputs of our lensfree cellphone microscope [36].
Fig. 9
Fig. 9
Imaging performance of our cellphone microscope is demonstrated by imaging micro-particles (3 μm and 7 μm diameter), RBCs, WBCs (monocyte and granulocytes) as well as G. Lamblia cysts. (Right column) Microscope images obtained with 10× objective lens; (Middle column) digitally reconstructed lensfree images, (Left column) Lensfree holograms.
Fig. 10
Fig. 10
A CAD drawing (left) and a photograph (right) of the lensfree super-resolution microscope (weighing ~95 grams) are shown. 23 multimode fiber-optic cables are individually butt-coupled to 23 LEDs without the use of any lenses or other opto-mechanical components. Using an inexpensive micro-controller, each LED is sequentially turned on to create lensfree holograms of the objects on a CMOS sensor-array, which can be digitally processed to achieve pixel super-resolution. Both the LEDs and the sensor-chip are powered through a USB connection.
Fig. 11
Fig. 11
A raw (LR) lensfree hologram (middle image) captured by the sensor- array is under-sampled due to relatively large pixel size (2.2 μm) of the sensor chip. Multiple shifted lensfree LR holograms are processed through our pixel SR algorithm to generate a higher resolution hologram (right image) where spatial aliasing is resolved. Sub-pixel shift amounts between different frames are also shown on the left plot with dots.
Fig. 12
Fig. 12
A comparison of the phase images obtained by reconstructing a raw lensfree hologram vs. the SR hologram shown in Fig. 11 is provided for a micro-pattern that is etched into glass. A 40× bright-field microscope image of the same pattern is also provided for visual comparison. A cross-section of the phase image across the letter ‘L’ and its 1D spatial derivative suggests a resolution of <1 μm. The spacing between the letters ‘U’ and ‘C’ in this micro-pattern is ~1 μm, and the two letters are clearly resolved using the SR microscope further supporting sub-micron resolution.
Fig. 13
Fig. 13
Reconstructed images of standard thin smears of RBCs infected with malaria parasites (Plasmodium falciparum) are demonstrated using our lensfree super-resolution microscope shown in Fig. 10. The parasites are clearly visible in both amplitude and phase images of our lensfree microscope. Bright-field microscope images (0.65-NA, 40×) of the same samples are also provided for comparison purposes.
Fig. 14
Fig. 14
(a1) shows the reconstructed image of a 2μm diameter micro-sphere in x–y plane using a LR hologram. (a2–a3) show the y–z and x–z cross sections for the same particle obtained by reconstructing a LR hologram at different planes along the optic axis (i.e., z). (b1) shows the reconstructed image of the same micro-particle in x–y plane using a SR hologram. (b2–b3) show the y–z and x–z cross sections for the same micro-particle obtained by reconstructing a SR hologram for the same particle. (c1–c3) show the sectional images (tomograms) through the centre of the same micro-particle in x–y, y–z, x–z and x–z planes, respectively, obtained by using the field-portable tomographic microscope shown in Fig. 15.
Fig. 15
Fig. 15
A CAD drawing (left) and a photograph (right) of the field-portable lensfree tomographic microscope (weighing ~110 grams) are shown. 24 LEDs, sequentially turned on by a micro-controller, are butt-coupled to individual optical fibers, which are mounted along an arc to provide multi-angle illumination within an angular range of ±50°. The fibers are electro-magnetically actuated to record multiple sub-pixel shifted holograms for each angle to digitally synthesize pixel super-resolved projection holograms of the objects on the chip.
Fig. 16
Fig. 16
(a1–a3) Our hologram recording geometry is illustrated for three different angles of θ= 44°, 0° and −44°. (b1–b3) Pixel super-resolved (SR) projection holograms for the corresponding angles are shown. These holograms are cropped from a much larger FOV. (c1–c3) Projection images obtained by reconstructing the SR holograms shown in (b1–b3) are shown for the corresponding angles. These projections images are registered with respect to the bead at the center of the FOV.
Fig. 17
Fig. 17
(a1–a5) Bright-field microscope images (40×, 0.65-NA) for different depth sections of a chamber filled with randomly distributed micro-beads with 5μm diameter. (b1–b5) lensfree computed tomograms for the corresponding layers, demonstrating successful depth sectioning performance of our field-portable tomographic microscope. The solid arrows in each image show the beads that are in-focus at a given depth. The inset in the figure, enclosed with the dashed rectangle, shows optical sectioning of two axially overlapping micro-beads, shown by the dashed circles in (a1) and (b5), both by lensfree tomography and conventional microscopy (40×, 0.65-NA), further validating our sectional imaging performance.
Fig. 18
Fig. 18
(a1–a3) 40X microscope images of a H. Nana egg are shown for visual comparison. (b1–b3) Computed tomograms for different depths of the same H. Nana egg are shown.
Fig. 19
Fig. 19
CAD drawing of our next generation field-portable lensfree optical tomographic microscope is shown. This platform will utilize a dual-axis illumination scheme to acquire more projection images of the sample, together with an improved tomographic reconstruction algorithm to account for diffraction within the object to achieve better 3D resolution.
Fig. 20
Fig. 20
(Left) Different views of the cell-phone microscope that can perform wide-field fluorescent and dark-field imaging are shown. This entire attachment (middle image) to the cell-phone weighs ~28 grams and has dimensions of ~3.5 × 5.5 × 2.4 cm. This compact and lightweight unit can be easily and repeatedly attached to and detached from the cell-phone body without the need for fine alignment. (Right) Recorded cell-phone images of labeled WBCs (cropped), compressively-decoded images and conventional fluorescence microscope images of the same labeled WBCs are provided from top to bottom of the panel, respectively [42]. Arrows point to WBCs that are resolved by CS. Note that this fluorescent imaging performance is achieved over a large FOV of ~81 mm2.

References

    1. Murphy DB. Fundamentals of Light Microscopy and Digital Imaging. Wiley-Liss; New York: 2001.
    1. Waller L, Luo Y, Yang S, Barbastathis G. Transport of Intensity phase imaging in a Volume Holographic Microscope. Opt Lett. 2010;35:2961–2963. - PubMed
    1. Kou SS, Waller L, Barbastathis G, Sheppard CJR. Transport-of-intensity approach to differential interference contrast (TI-DIC) microscopy for quantitative phase imaging. Opt Lett. 2010;35:447–449. - PubMed
    1. Leith EN, Upatnieks J, Haines KA. Microscopy by Wavefront Reconstruction. J Opt Soc Am. 1965;55:981–986.
    1. Garcia-Sucerquia J, Xu W, Jericho SK, Klages P, Jericho MH, Kreuzer HJ. Digital in-line holographic microscopy. Appl Opt. 2006;45:836–850. - PubMed

LinkOut - more resources