. 2013 Oct 25:7:71.
doi: 10.3389/fnsys.2013.00071. eCollection 2013.

Compensatory changes in cortical resource allocation in adults with hearing loss

Affiliations

Compensatory changes in cortical resource allocation in adults with hearing loss

Julia Campbell et al. Front Syst Neurosci. .

Abstract

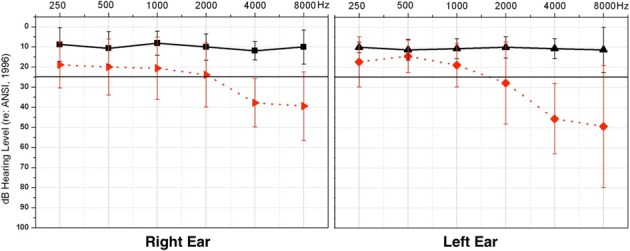
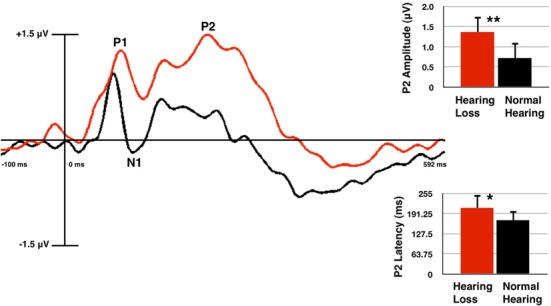
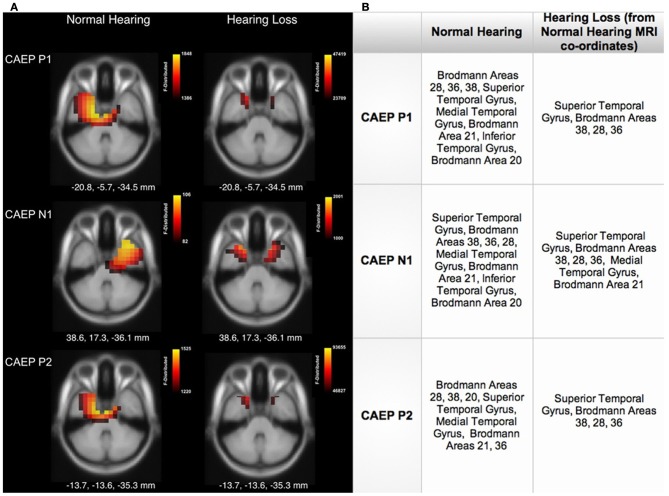
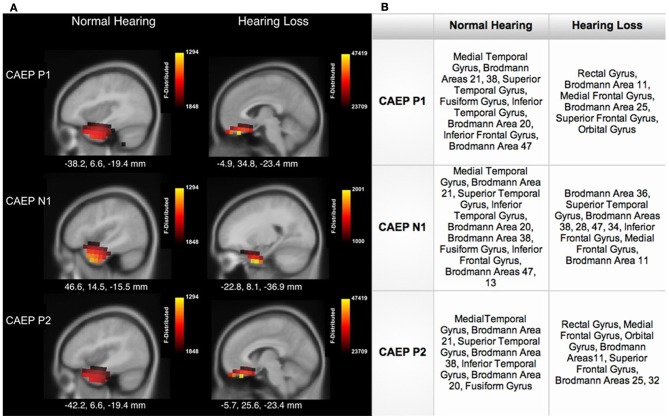
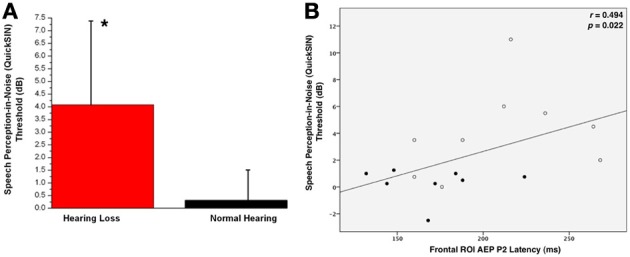
Hearing loss has been linked to many types of cognitive decline in adults, including an association between hearing loss severity and dementia. However, it remains unclear whether cortical re-organization associated with hearing loss occurs in early stages of hearing decline and in early stages of auditory processing. In this study, we examined compensatory plasticity in adults with mild-moderate hearing loss using obligatory, passively-elicited, cortical auditory evoked potentials (CAEP). High-density EEG elicited by speech stimuli was recorded in adults with hearing loss and age-matched normal hearing controls. Latency, amplitude and source localization of the P1, N1, P2 components of the CAEP were analyzed. Adults with mild-moderate hearing loss showed increases in latency and amplitude of the P2 CAEP relative to control subjects. Current density reconstructions revealed decreased activation in temporal cortex and increased activation in frontal cortical areas for hearing-impaired listeners relative to normal hearing listeners. Participants' behavioral performance on a clinical test of speech perception in noise was significantly correlated with the increases in P2 latency. Our results indicate that changes in cortical resource allocation are apparent in early stages of adult hearing loss, and that these passively-elicited cortical changes are related to behavioral speech perception outcome.

Keywords: adult; cortical auditory evoked potential; cortical resource allocation; sensorineural hearing loss; source localization.


Figures

Figure 1
Figure 1
Average pure tone thresholds across clinical test frequencies (X-axis) for right and left ears, respectively. Intensity of frequency presentation level is shown on the Y-axis. The normal hearing group (NH) thresholds are depicted in solid black, and the hearing loss (HL) group thresholds in dashed red. Vertical black bars indicate standard deviation. The solid black line illustrates the criterion for normal hearing, at 25 dB HL.
Figure 2
Figure 2
Grand averaged cortical auditory evoked potentials (CAEPs) from the frontal region of interest (ROI) for the normal hearing (NH, in black) and hearing loss (HL, in red) groups. P2 amplitude is significantly higher and P2 latency is significantly longer in the HL group as shown in the waveform and mean amplitude bar graphs. Two asterisks indicate significance at p < 0.01, one asterisk indicates significance at p < 0.05. Vertical bars on the graph show standard deviation.
Figure 3
Figure 3
(A) Current density reconstructions (CDR) showing cortical activation at the P1, N1, and P2 CAEP peak components on axial MRI slices for the normal hearing (NH) and hearing loss (HL) groups. The scale of the F Distribution is shown in the upper right corner ranging from red to yellow (yellow is highest level of activation), and the Montreal Neurological Institute (MNI) coordinates are listed below each MRI slice. (B) A table describing activated anatomical cortical areas for the CAEP components for each group, listed in approximate order of highest level of activation.
Figure 4
Figure 4
(A) Current density reconstructions (CDR) showing cortical activation at the P1, N1, and P2 CAEP peak components on sagittal MRI slices for the normal hearing (NH) and hearing loss (HL) groups. The scale of the F Distribution is shown in the upper right corner ranging from red to yellow (yellow is highest level of activation), and the Montreal Neurological Institute (MNI) coordinates are listed below each MRI slice. (B) A table describing activated anatomical cortical areas for the CAEP components for each group, listed in approximate order of highest level of activation.
Figure 5
Figure 5
(A) Mean QuickSIN™ scores for normal hearing (NH, in black) and hearing loss (HL, in red) groups. Standard deviations are shown as vertical bars. One asterisk reflects a significant difference at p < 0.05. (B) The correlation of the CAEP P2 component latency as a function of QuickSIN™ scores. The Spearman's rank order correlation coefficient value and significance level are indicated in the right upper corner.

References

    1. Anderson S., Kraus N. (2010). Sensory-cognitive interaction in the neural encoding of speech in noise: a review. J. Am. Acad. Audiol. 21, 575–585 10.3766/jaaa.21.9.3 - DOI - PMC - PubMed
    1. Arlinger S., Lunner T., Lyxell B., Pichora-Fuller M. K. (2009). The emergence of cognitive hearing science. Scand. J. Psychol. 50, 371–384 10.1111/j.1467-9450.2009.00753.x - DOI - PubMed
    1. Bertoli S., Probst R., Bodmer D. (2011). Late auditory evoked potentials in elderly long-term hearing-aid users with unilateral or bilateral fittings. Hear. Res. 280, 58–69 10.1016/j.heares.2011.04.013 - DOI - PubMed
    1. Boyle P. A., Wilson R. S., Schneider J. A., Bienias J. L. (2008). Processing resources reduce the effect of Alzheimer pathology on other cognitive systems. Neurology 70, 1534–1542 10.1212/01.wnl.0000304345.14212.38 - DOI - PMC - PubMed
    1. Buckley K. A., Tobey E. A. (2011). Cross-modal plasticity and speech perception in pre- and postlingually deaf cochlear implant users. Ear Hear. 32, 2–15 10.1097/AUD.0b013e3181e8534c - DOI - PubMed

LinkOut - more resources