. 2014 Jan 21:4:315.
doi: 10.3389/fphys.2013.00315. eCollection 2013.

A comparative study of Whi5 and retinoblastoma proteins: from sequence and structure analysis to intracellular networks

Affiliations

A comparative study of Whi5 and retinoblastoma proteins: from sequence and structure analysis to intracellular networks

Md Mehedi Hasan et al. Front Physiol. .

Abstract

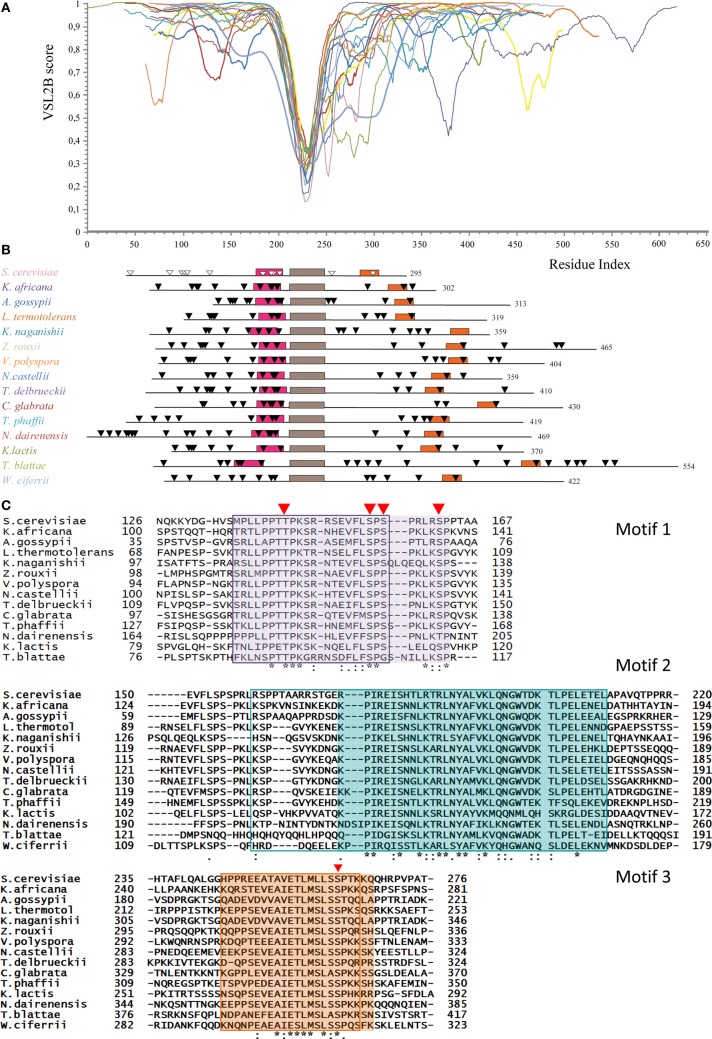
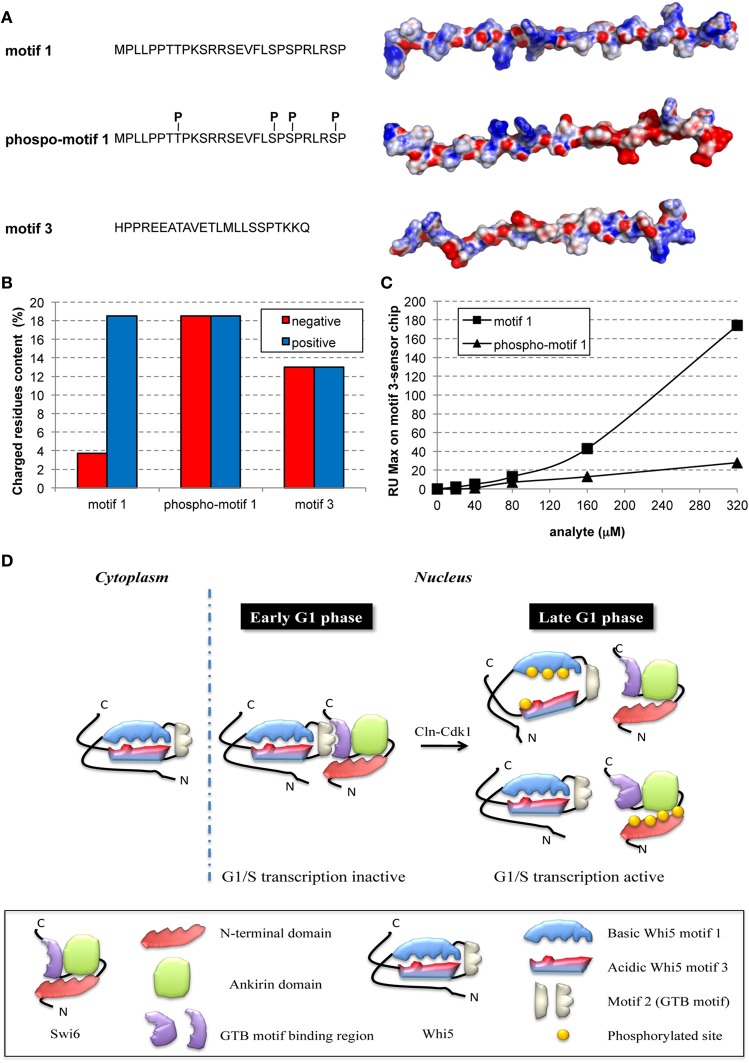
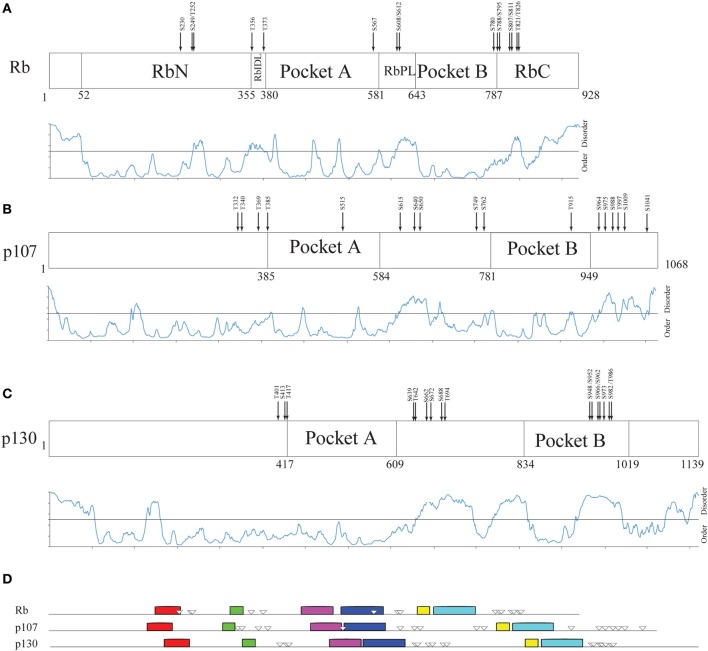
Cell growth and proliferation require a complex series of tight-regulated and well-orchestrated events. Accordingly, proteins governing such events are evolutionary conserved, even among distant organisms. By contrast, it is more singular the case of "core functions" exerted by functional analogous proteins that are not homologous and do not share any kind of structural similarity. This is the case of proteins regulating the G1/S transition in higher eukaryotes-i.e., the retinoblastoma (Rb) tumor suppressor Rb-and budding yeast, i.e., Whi5. The interaction landscape of Rb and Whi5 is quite large, with more than one hundred proteins interacting either genetically or physically with each protein. The Whi5 interactome has been used to construct a concept map of Whi5 function and regulation. Comparison of physical and genetic interactors of Rb and Whi5 allows highlighting a significant core of conserved, common functionalities associated with the interactors indicating that structure and function of the network-rather than individual proteins-are conserved during evolution. A combined bioinformatics and biochemical approach has shown that the whole Whi5 protein is highly disordered, except for a small region containing the protein family signature. The comparison with Whi5 homologs from Saccharomycetales has prompted the hypothesis of a modular organization of structural disorder, with most evolutionary conserved regions alternating with highly variable ones. The finding of a consensus sequence points to the conservation of a specific phosphorylation rhythm along with two disordered sequence motifs, probably acting as phosphorylation-dependent seeds in Whi5 folding/unfolding. Thus, the widely disordered Whi5 appears to act as a hierarchical, "date hub" that has evolutionary assayed an original way of modular organization before being supplanted by the globular, multi-domain structured Rb, more suitable to cover the role of a "party hub".

Keywords: cell cycle; date hub; multisite phosphorylation; party hub; protein evolution; protein hub; structural disorder; systems biology.


Figures

Figure 1
Figure 1
Compositional and sequence analysis of Whi5Sc. (A) Secondary structure prediction for Whi5Sc. A simplified output of Proteus 2.0 shows only secondary structure elements predicted with confidence ≥5, in the range 0–9. The blue box corresponds to the Pfam “Whi5 domain” signature. (B) Composition profiling of Whi5Sc. The plot is the output of Composition Profiler tool and shows the fractional difference in amino acid composition of Whi5Sc (gray bars) and of a set of intrinsically disordered proteins (light blue bars) relative to a reference set of ordered, globular proteins. The fractional difference is calculated as (CX-Corder)/Corder, where CX is the content in a given amino acid of Whi5Sc (or of the set of intrinsically disordered proteins) and Corder is the corresponding value in the set of ordered proteins. Negative fractional difference indicates depletion, while positive difference indicates enrichment, in the corresponding amino acid. Amino acids are arranged on the x axis from the most rigid to the most flexible according to the Vihinen's flexibility scale (Vihinen, 1987). The error bars correspond to the confidence intervals evaluated by the 10,000 bootstrap iterations in the definition of the reference protein sets. (C) Charge-hydropathy plot of Whi5Sc (green diamond). The plot is an empirical graph representing data of net charge and mean hydrophobicity for a set of globular proteins (blue square) and a set of disordered proteins (red circle). The two groups are separated by a straight line <charge> = 2.743 <hydropathy> −1.109 (Oldfield et al., 2005). (D) Cumulative plot of disorder prediction. (E) SDS-PAGE analysis of proteolysis kinetics on recombinant, IMAC-purified Whi5Sc and SlyD, a copurified E. coli globular protein serving as a control. Trypsin and its substrates were mixed in a weight ratio of 1:2000 and the digestion products withdrawn to be assayed at different time points (1–60 min). Recombinant Whi5Sc was markedly degraded after 20-min incubation, while SlyD is resistant to proteolysis even after 60-min incubation (F) Analytical size-exclusion chromatogram of recombinant Whi5Sc. Calibration curve was obtained with the following globular proteins: BSA (66 kDa), ovalbumin (43 kDa), chimotrypsin (23 kDa), myoglobin (17 kDa), and cytochrome C (13.6 kDa).
Figure 2
Figure 2
Conservation of structural disorder among Whi5 homologs in Fungi. (A) The plots represent the prediction of structural disorder by VSL2B for Whi5 homologs from the same yeast species listed in the panel B, in the same color code; the plots were superimposed by aligning the deepest downward spike. This conserved sequence corresponds to the brown box (motif 2) in the panel B. (B) Pattern of conserved motifs found by the MEME algorithm (search for 3 motifs) in Whi5 homologs from different yeast species. Boxes represent the amino acid sequences of manually refined motifs (see panel C). The positions of Cdk1-phosphorylatable residues are indicated by triangles, empty for experimentally determined (Whi5Sc), black for computationally predicted ones (see text). (C) Amino acid sequences of conserved motifs. For each motif, sequences are listed according to the ClustalW2 alignment order. Identical residues are marked with an asterisk, conserved residues with a dot, and conserved similar residues with double dots. Red triangles indicate the position of experimentally confirmed Cdk-phosphorylatable sites in Whi5Sc. The sequences found for each motif by the MEME algorithm are boxed. The manually refined motifs are in shaded cages. In Whi5Sc, motif 1 (fuchsia box in panel B) spans from amino acid 136 to 162, motif 2 from amino acid 173 to 209 (brown box in panel B), and motif 3 (orange box in panel B) from amino acid 245 to 267.
Figure 3
Figure 3
Phosphorylation hampers in-vitro interaction between peptides representing motifs 1 and 3 of Whi5Sc. (A) Amino acid sequence and electrostatic potential surface of Whi5Sc-derived peptides representing conserved motifs and assayed in SPR experiments: motif 1 (136–162), phospho-motif 1 (136–162), and motif 3 (245–267). Phospho-motif 1 peptide differs from motif 1 only for the presence of specific phosphorylated residues of tyrosine and serine indicated as pT and pS. The electrostatic potential maps are projected on the solvent accessible surface of the peptides. The molecular surface of the negatively and positively charged residues is colored in red and blue, respectively, with the intensity of the color proportional to the local potential (range −10 kTe−1 to +10 kTe−1). (B) Content of charged residues of each peptide, displayed as percentage of residues over the total sequence length. (C) Maximal Resonance Units (RU Max) derived from SPR experiments performed using motif 3-immobilized sensor chip and different concentrations of phospho-motif 1 and motif 1 peptides. (D) Model of regulation of G1/S transcription by multisite phosphorylation on Whi5 and Swi6.
Figure 4
Figure 4
Structural organization of human Rb along the evolution of multicellular Eukarya. (A) The domain organization of human Rb and a scheme summarizing the structurally determined regions, as obtained by a literature survey. Gray shadow indicates experimentally determined coiled coil regions, pink shadow indicates unsolved 3D structures. (B) The profile of structural disorder predicted by PONDR-FIT. (C) Conserved motifs found by a MEME search for ten motifs along the amino acid sequences of homologs. Triangles indicate the position of Cdk-phosphorylatable residues. Empty triangles refer to experimentally determined sites.
Figure 5
Figure 5
Structural organization of human Rb-like proteins. (A–C) PONDR-FIT disorder prediction combined with functional domain organization for paralogs Rb (A), p107 (B), and p130 (C). (D) The pattern of 10 conserved sequence motifs searched by MEME in human Rb and its paralogs p107 and p130 with experimentally determined Cdk-phosphorylation sites.
Figure 6
Figure 6
Functional classification of Whi5Sc and Rb interactors. (A) The interaction network of Whi5Sc includes both physical and genetic interactors. Functional classification of interactors was derived from the classification model of Costanzo et al. (2004). The interaction network is hierarchical. The panel shows proteins physically binding to Whi5Sc (inner circle, first level interactors), genetic interactors physically binding to first level interactors (second circle, second level interactors), genetic interactors physically binding to second level interactors (third circle, third level interactors), and genetic interactors that do not interact with any second and third level interactors of Whi5 (outer circle). (B) The interaction network of Rb consists only of physical interactors, since all genetic interactors are also physical interactors. The functional classification of interaction network was derived from database and literature search and color-coded according to function.
Figure 7
Figure 7
GO term enrichment of Whi5, Rb and common interactors. Treemap of GO term enrichment of Whi5 (A), Rb (B) and common (C) interactors generated by the web service Revigo based on p-value of GO term enrichment of Biological Process.
Figure 8
Figure 8
Functional classification and GO term enrichment map of physical interactors of Rb-like proteins. (A) The functional classification of p107 (RBL1) and p130 (RBL2) interaction network was derived from database and literature search and color-coded according to function. (B) According to BioGRID database, Rb, p107, and p130 have some unique interactors and also shared interaction partners. (C, D) Treemaps of GO term enrichment of p107 (C) and p130 (D) interactors generated by the web service Revigo based on p-value of GO term enrichment of Biological Process. (E) The table contains a short description of the 25 shared interactors.
Figure 9
Figure 9
Concept map of Whi5 function. The model has been designed in order to include all first-, second- and third-level Whi5Sc interactors. The map is divided in four major modules: Whi5 synthesis and subcellular localization, Whi5 post-translational processing, Gene silencing, and Gene expression of SBF-dependent genes. Maps detailing hypothetical relation with Atg1 (belonging to the autophagy pathway), Tpk1 (cAMP/PKA nutrient signaling pathway), and Yck1 (cell polarity/morphogenesis) are in supplementary Figures S7–S9, respectively. The list of SBF-target genes derives from Ferrezuelo et al. (2010).

References

    1. Alberghina L., Porro D. (1993). Quantitative flow cytometry: analysis of protein distributions in budding yeast. A mini-review. Yeast 9, 815–823 10.1002/yea.320090802 - DOI - PubMed
    1. Alberghina L., Mavelli G., Drovandi G., Palumbo P., Pessina S., Tripodi F., et al. (2012). Cell growth and cell cycle in Saccharomyces cerevisiae: basic regulatory design and protein-protein interaction network. Biotechnol. Adv. 30, 52–72 10.1016/j.biotechadv.2011.07.010 - DOI - PubMed
    1. Altschul S. F., Gish W., Miller W., Myers E. W., Lipman D. J. (1990). Basic local alignment search tool. J. Mol. Biol. 215, 403–410 10.1016/S0022-2836(05)80360-2 - DOI - PubMed
    1. Bailey T. L., Elkan C. (1994). Fitting a mixture model by expectation maximization to discover motifs in biopolymers. Proc. Int. Conf. Intell. Syst. Mol. Biol. 2, 28–36 - PubMed
    1. Bailey T. L., Boden M., Buske F. A., Frith M., Grant C. E., Clementi L., et al. (2009). MEME SUITE: tools for motif discovery and searching. Nucleic Acids Res. 37, W202–W208 10.1093/nar/gkp335 - DOI - PMC - PubMed

LinkOut - more resources