. 2014 Jan 30:7:8.
doi: 10.1186/1755-8794-7-8.

Integrative genomic analysis identifies epigenetic marks that mediate genetic risk for epithelial ovarian cancer

Affiliations

Integrative genomic analysis identifies epigenetic marks that mediate genetic risk for epithelial ovarian cancer

Devin C Koestler et al. BMC Med Genomics. .

Abstract

Background: Both genetic and epigenetic factors influence the development and progression of epithelial ovarian cancer (EOC). However, there is an incomplete understanding of the interrelationship between these factors and the extent to which they interact to impact disease risk. In the present study, we aimed to gain insight into this relationship by identifying DNA methylation marks that are candidate mediators of ovarian cancer genetic risk.

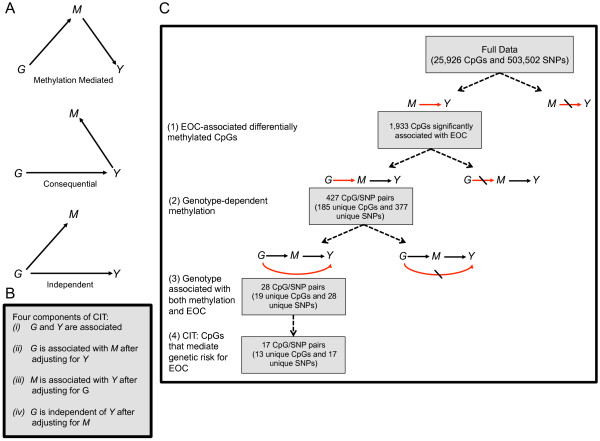
Methods: We used 214 cases and 214 age-matched controls from the Mayo Clinic Ovarian Cancer Study. Pretreatment, blood-derived DNA was profiled for genome-wide methylation (Illumina Infinium HumanMethylation27 BeadArray) and single nucleotide polymorphisms (SNPs, Illumina Infinium HD Human610-Quad BeadArray). The Causal Inference Test (CIT) was implemented to distinguish CpG sites that mediate genetic risk, from those that are consequential or independently acted on by genotype.

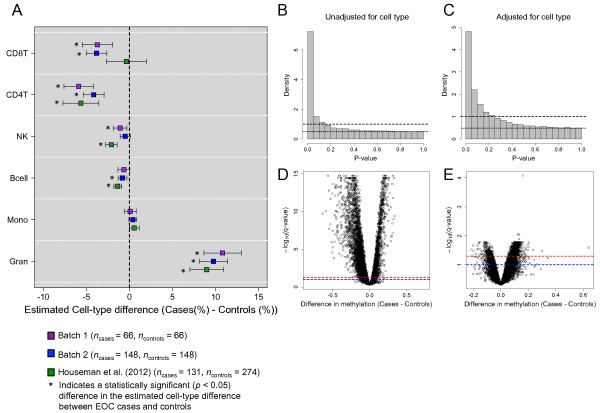
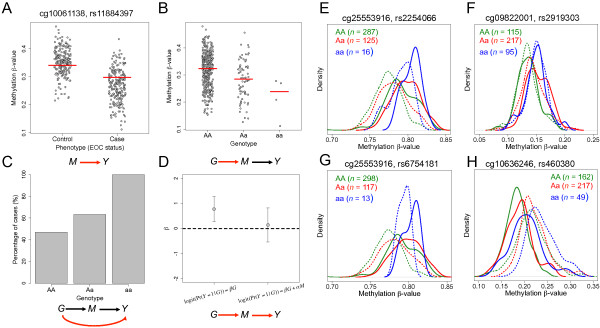
Results: Controlling for the estimated distribution of immune cells and other key covariates, our initial epigenome-wide association analysis revealed 1,993 significantly differentially methylated CpGs that between cases and controls (FDR, q < 0.05). The relationship between methylation and case-control status for these 1,993 CpGs was found to be highly consistent with the results of previously published, independent study that consisted of peripheral blood DNA methylation signatures in 131 pretreatment cases and 274 controls. Implementation of the CIT test revealed 17 CpG/SNP pairs, comprising 13 unique CpGs and 17 unique SNPs, which represent potential methylation-mediated relationships between genotype and EOC risk. Of these 13 CpGs, several are associated with immune related genes and genes that have been previously shown to exhibit altered expression in the context of cancer.

Conclusions: These findings provide additional insight into EOC etiology and may serve as novel biomarkers for EOC susceptibility.


Figures

Figure 1
Figure 1
Identification of epigenetically mediated genetic risk factors for EOC. (A) Directed acyclic graphs (DAGs) depicting the possible relationships between a causal factor (G), a potential mediator (M), and an outcome (Y). Top, DAG for the methylation-mediated relationship, wherein G acts on Y through M. Middle, DAG for the methylation-consequential (reverse causality) relationship, in which changes in M arise as a consequence of Y. Bottom, DAG for the methylation-independent relationship, wherein G acts on M and Y independently. (B) The four components of the CIT. (C) Flow diagram illustrating the various filtering steps, and ensuing results, used to identify methylation sites that are candidates for mediators of genetic risk for EOC.
Figure 2
Figure 2
Differential cell distributions in EOC cases. (A) Estimated difference in leukocyte subtypes (i.e., CD8+ T-lymphocytes (CD8T), CD4+ T-lymphocytes (CD4T), natural killer cells (NK), B cells (Bcell), monocytes (Mono), and granulocytes (Gran)) between EOC cases and controls. Bars reflect the 95% confidence interval for the difference in cell distributions between EOC cases and controls. (B, C) Histograms of P-values obtained from examining the association between DNAm and EOC case/control status, (B) unadjusted for estimated cell distribution and (C) adjusted for the estimated cell distribution. Dashed line is the density histogram that is expected if all CpGs were null (not differentially methylated) and the dotted line is at the height of our estimate of the proportion of null p-values. (D, E) Volcano plots of –log10(q-value) against the estimated difference in methylation between EOC cases and controls, (D) unadjusted for estimated cell distribution and (E) adjusted for the estimated cell distribution. Red and blue dashed lines indicate –log10(q = 0.05) and –log10(q = 0.10), respectively. Each model was fit to the combined data from the Batch 1 and 2 samples (n = 428) and were adjusted for age, smoking status, alcohol consumption, study enrollment year, location of residence, parity, and population substructure.
Figure 3
Figure 3
Genotype-dependent candidate CpGs that mediate genetic risk for EOC. (Left) Plot depicting the DNAm status of cg10061138, associated with gene STAB1, between (A) EOC cases and controls and by genotype at SNP rs11884397(B). Red lines denote the median methylation levels. (C) Percentage of EOC cases by the number of minor alleles for SNP rs11884397. (D) Coefficient (β) reflects the log-odds of EOC for a one-unit increase in the number of minor alleles for SNP rs11884397 with and without adjustment for the methylation levels of cg10061138. Bars represent the 95% CI for the estimate of the log-odds (i.e., β). (E-H) Density plots of DNAm by genotype (AA = green, Aa = red, and aa = blue) for four EOC–associated CpGs; solid lines indicate the methylation distribution for EOC cases and dotted lines indicate the methylation distribution for controls.

References

    1. Siegel R, Naishadham D, Jemal A. Cancer statistics, 2013. CA Cancer J Clin. 2013;7(1):11–30. doi: 10.3322/caac.21166. - DOI - PubMed
    1. Bodurka-Bevers D, Sun CC, Gershenson DM. Pharmacoeconomic considerations in treating ovarian cancer. Pharmacoeconomics. 2000;7(2):133–150. doi: 10.2165/00019053-200017020-00003. - DOI - PubMed
    1. Mariotto AB, Yabroff KR, Shao Y, Feuer EJ, Brown ML. Projections of the cost of cancer care in the United States: 2010-2020. J Natl Cancer Inst. 2011;7(2):117–128. doi: 10.1093/jnci/djq495. - DOI - PMC - PubMed
    1. Cicek MS, Koestler DC, Fridley BL, Kalli KR, Armasu SM, Larson MC, Wang C, Winham SJ, Vierkant RA, Rider DN. et al.Epigenome-wide ovarian cancer analysis identifies a methylation profile differentiating clear-cell histology with epigenetic silencing of the HERG K + channel. Hum Mol Genet. 2013;7(15):3038–3047. doi: 10.1093/hmg/ddt160. - DOI - PMC - PubMed
    1. Bauerschlag DO, Ammerpohl O, Brautigam K, Schem C, Lin Q, Weigel MT, Hilpert F, Arnold N, Maass N, Meinhold-Heerlein I. et al.Progression-free survival in ovarian cancer is reflected in epigenetic DNA methylation profiles. Oncology. 2011;7(1–2):12–20. - PubMed

Publication types