. 2014 Apr 1;276(1):55-62.
doi: 10.1016/j.taap.2014.01.013. Epub 2014 Jan 28.

Glucocorticoid induced leucine zipper inhibits apoptosis of cardiomyocytes by doxorubicin

Affiliations

Glucocorticoid induced leucine zipper inhibits apoptosis of cardiomyocytes by doxorubicin

David Aguilar et al. Toxicol Appl Pharmacol. .

Abstract

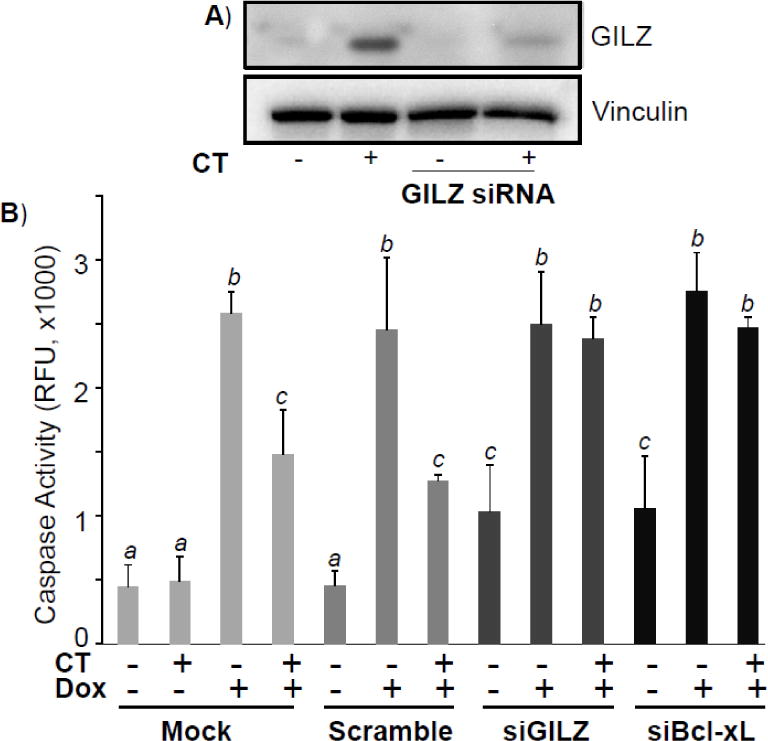
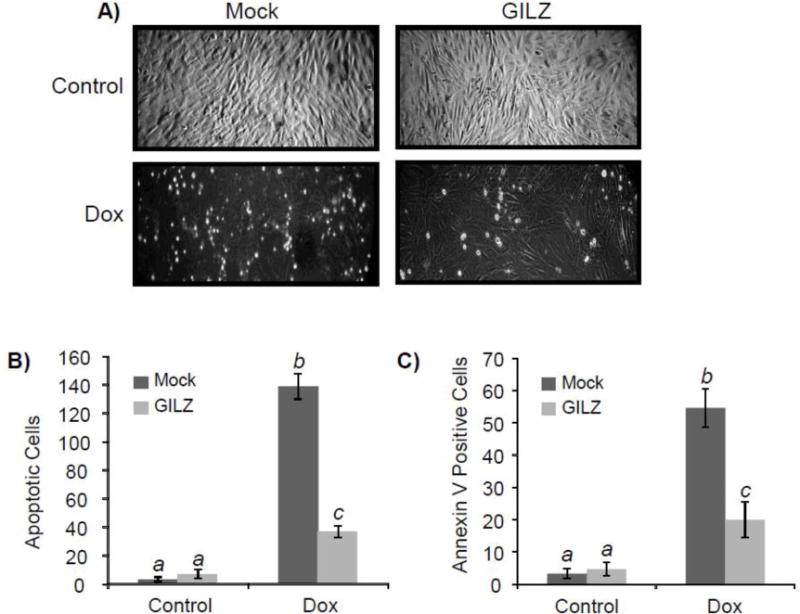
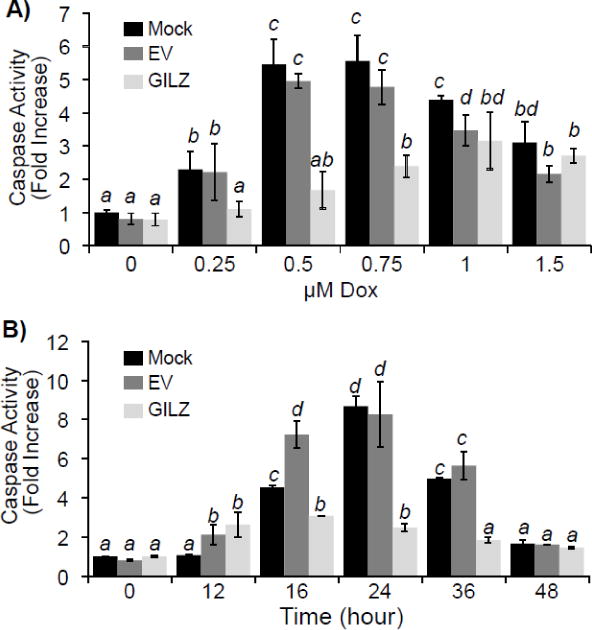
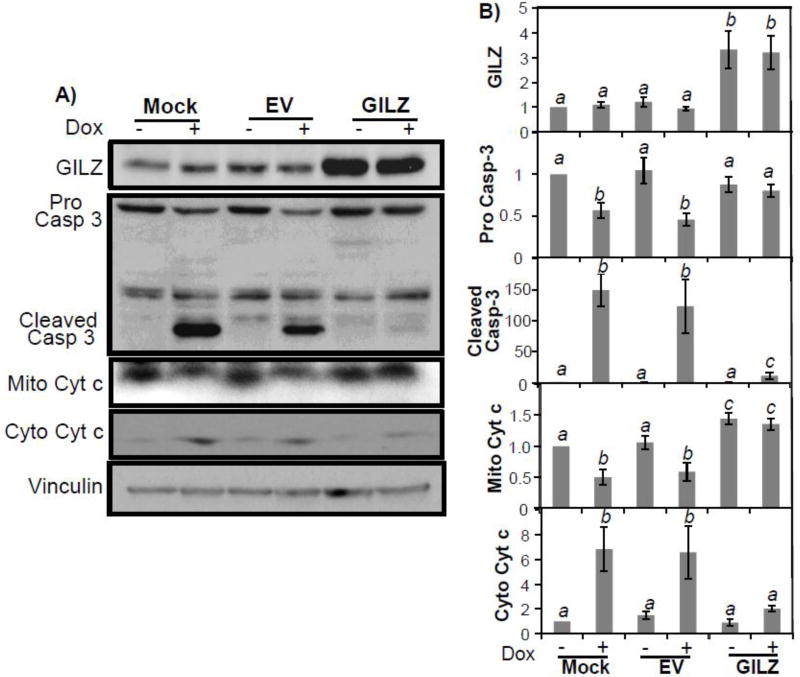
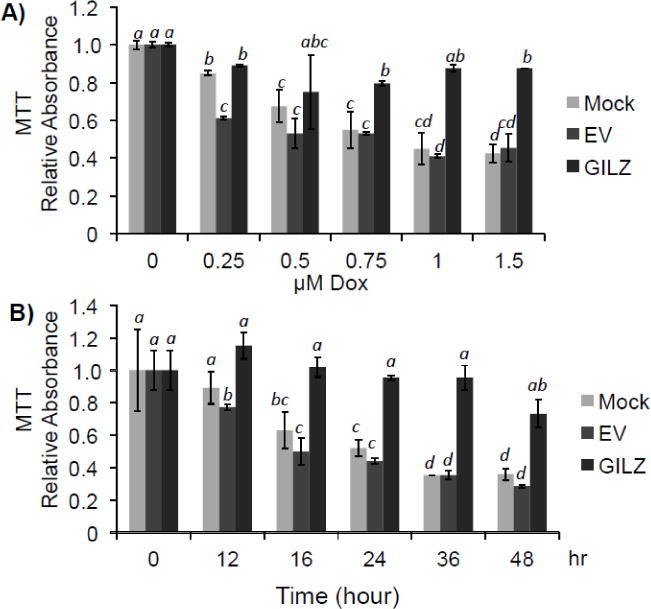
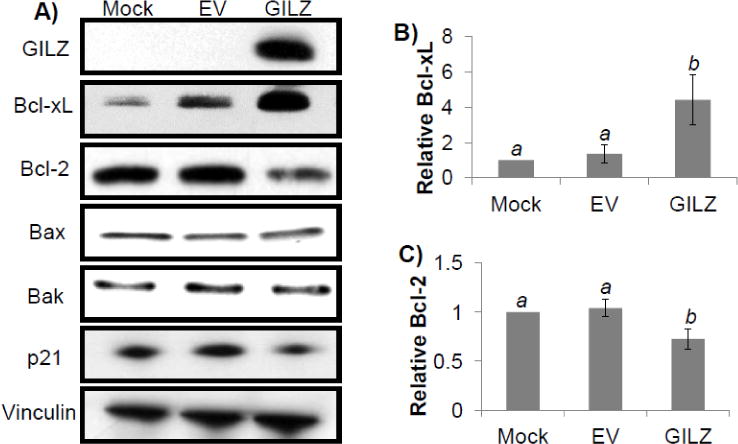
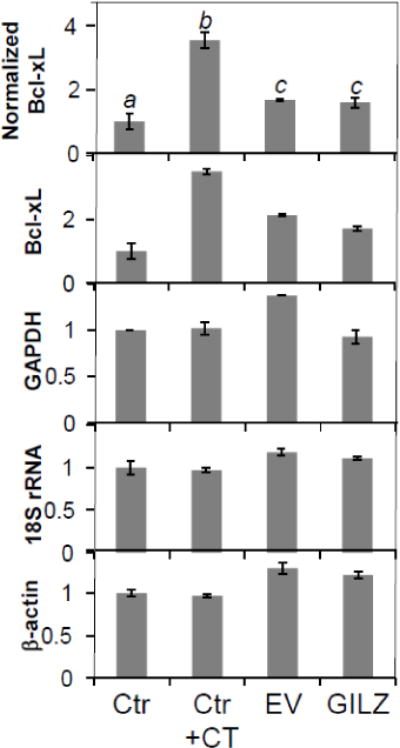
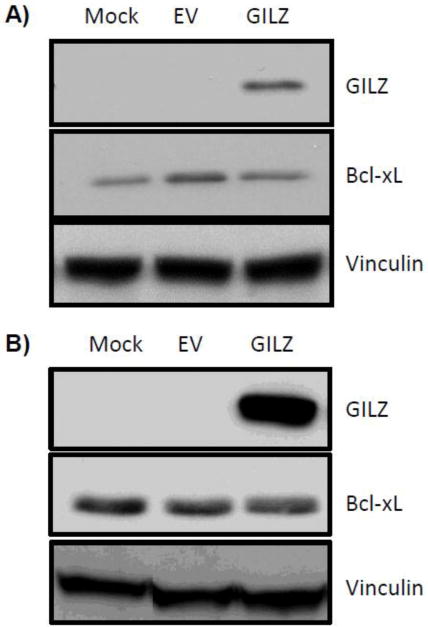
Doxorubicin (Dox) is an indispensable chemotherapeutic agent for the treatment of various forms of neoplasia such as lung, breast, ovarian, and bladder cancers. Cardiotoxicity is a major concern for patients receiving Dox therapy. Previous work from our laboratory indicated that glucocorticoids (GCs) alleviate Dox-induced apoptosis in cardiomyocytes. Here we have found glucocorticoid-induced leucine zipper (GILZ) to be a mediator of GC-induced cytoprotection. GILZ was found to be induced in cardiomyocytes by GC treatment. Knocking down of GILZ using siRNA resulted in cancelation of GC-induced cytoprotection against apoptosis by Dox treatment. Overexpressing GILZ by transfection was able to protect cells from apoptosis induced by Dox as measured by caspase activation, Annexin V binding and morphologic changes. Western blot analyses indicate that GILZ overexpression prevented cytochrome c release from mitochondria and cleavage of caspase-3. When bcl-2 family proteins were examined, we found that GILZ overexpression causes induction of the pro-survival protein Bcl-xL. Since siRNA against Bcl-xL reverses GC induced cytoprotection, Bcl-xL induction represents an important event in GILZ-induced cytoprotection. Our data suggest that GILZ functions as a cytoprotective gene in cardiomyocytes.

Keywords: Bcl-xL; Caspase-3; Cell death; Chemotherapy; Nuclear receptor; Steroids.


Figures

Figure 1
Figure 1. GILZ Mediates CT Induced Cytoprotection
H9c2 cells were transfected with siRNA against GILZ, Bcl-xL, or scrambled control for 24 hr before corticosterone (CT, 1 μM) treatment for 8 hr. Cells were harvested for measurements of GILZ protein by Western blot with vinculin as a loading control (A). Alternatively, cells were treated with doxorubicin (Dox, 0.75 μM) for 24 hr before harvesting for measurements of caspase 3 activity (B). Results are from one experiment representative of three independent experiments (A) or means ± standard deviations from three independent experiments with triplicated samples for each experiment (B). The raw data from three independent experiments were used for statistic analyses by ANOVA. Different letters indicate significant differences between treatment groups (p<0.05). Therefore, the means labeled with “a” are significantly different from that labeled with “b” or “c”, while “b” indicates significant differences from the means labeled with “a” or “c”.
Figure 2
Figure 2. GILZ Protects Against Dox-Induced Cell Death
H9c2 cells stably transfected with or without pcDNA-GILZ were treated with Dox (0.75 μM) for 24 hr. The image of the cultured cells was recorded under a phase contrast microscopy (A). The number of apoptotic cells was quantitated by counting in three distinct fields under the microscope (B). Annexin V-Fluo was added to cells for fluorescence microscopy. The number of Annexin V positive cells was quantified by counting in three distinct fields under a fluorescence microscope (C). Results are from one experiment representative of three independent experiments (A) or are expressed as means ± standard deviations from three independent experiments with triplicated samples for each experiment (B, C). The raw data from three independent experiments were used for statistic analyses by ANOVA. Different letters indicate significant differences between treatment groups (p< 0.05). Therefore, the data groups labeled with “a” are significantly different from that labeled with “b” or “c”, while “b” indicates significant differences from the data groups labeled with “a” or “c”.
Figure 3
Figure 3. GILZ Protects Against Dox-Induced Caspase Activation
H9c2 cells stably transfected with empty vector (EV), GILZ, or without vector (Mock) were treated with Dox at the indicated doses for 24 hr (A) or with 0.75 μM Dox for the indicated times (B). Cells were collected for measurements of Caspase 3 activity. Results are expressed as means ± standard deviations from four independent experiments with triplicated samples for each experiment. The raw data from four independent experiments were used for statistic analyses by ANOVA. Different letters indicate significant differences between treatment groups (p<0.05). Therefore, the means labeled with “a” are significantly different from that labeled with “b”, “c” or “d”, while “b” indicates significant differences from the means labeled with “a”, “c” or “d”. The means labeled with two letters such as “ab” are not significant different from those labeled with either letter “a” or “b”.
Figure 4
Figure 4. GILZ Inhibits Dox-Induced Caspase Cleavage and Mitochondrial Release of Cytochrome c
H9c2 cells stably transfected with empty vector (EV), GILZ, or no vector (Mock) were challenged with Dox (0.75 μM) for 24 hr. Cells were collected for measurements of cleaved Caspase 3 (Casp-3) and cytochrome c (Cyt c) release from mitochondria by Western blot. The data are from one experiment representative of three (A). Bar graphs represent means ± standard deviations of band intensity normalized to vinculin from 3 independent experiments with mock control being set at value “1” (B). The normalized data from three independent experiments were used for statistical analyses by ANOVA. Different letters indicate significant differences between treatment groups (p<0.05). Therefore, the means labeled with “a” are significantly different from that labeled with “b” or “c”, while “b” indicates significant differences from the data groups labeled with “a” or “c”.
Figure 5
Figure 5. GILZ Preserves Cell Viability as Measured by MTT Assay
H9c2 cells stably transfected with empty vector (EV), GILZ, or no vector (Mock) were challenged with Dox at the indicated doses for 24 hr (A) or with 0.75 μM Dox for the indicated times (B). Cell viability was determined by quantifying the ability to convert 3-(4,5-Dimethylthiazol-2-yl)-2,5-diphenyltetrazolium bromide into formazan. Results are expressed as means ± standard deviations from four independent experiments with triplicated samples for each experiment. The raw data from four independent experiments were used for statistical analyses by ANOVA. Different letters indicate significant differences between treatment groups (p<0.05). Therefore, the data groups labeled with “a” are significantly different from that labeled with “b”, “c” or “d”, while “b” indicates significant differences from the means labeled with “a”, “c” or “d”. The means labeled with two letters such as “ab” are not significantly different from those labeled with either letter “a” or “b”. The mean labeled with three letters “abc” is not significantly different from those labeled with letter “a”, “b” or “c”.
Figure 6
Figure 6. Expression of Bcl-2 Family Members in GILZ Transfected Cells
H9c2 cells from transiently transfected empty vector (EV) or GILZ vector were collected at 48 hr after transfection for Western blot analyses to determine the levels of Bcl-2 family members and p21, with vinculin as a loading control. The data are from one experiment representative of three (A). Bar graphs represent means ± standard deviations of band intensity normalized to vinculin from 3 independent experiments with the data from mock transfected cells being set at value “1” (B, C). The normalized data from three independent experiments were used for statistical analyses by ANOVA. Different letters indicate significant differences between treatment groups (p<0.05). Therefore, the means labeled with “a” are significantly different from that labeled with “b”.
Figure 7
Figure 7. GILZ Does Not Induce Bcl-xL mRNA
qRT-PCR analysis was used to determine Bcl-xL mRNA levels in H9c2 cells treated with corticosterone (CT, 1 μM) or stably transfected with empty vector (EV) or GILZ. Bcl-xL mRNA levels were normalized to three reference genes (GAPDH, 18S rRNA, and β-actin) as described in the Methods (A). The relative quantity of each gene is shown (B, C, D, E). Results are expressed as means ± standard deviations from three independent experiments with triplicated samples for each experiment. Different letters indicate significant differences between treatment groups (p<0.05) as determined by ANOVA. Therefore, the data groups labeled with “a” are significantly different from that labeled with “b” or “c”.
Figure 8
Figure 8. GILZ Does Not Induce Bcl-xL Protein in HEK293 or HeLa Cells
Empty vector (EV) or GILZ expression vector was introduced into HEK293 (A) or HeLa (B) cells by transient transfection. Cells were harvested 48 hr after transfection for Western blot to measure levels of GILZ, Bcl-xL or the loading control vinculin. The results are representative from two (A) or three (B) independent experiments.
Figure 9
Figure 9. Alignment of GILZ PER domain with Bcl-xL Interacting Protein PER Splicing Factor
GILZ protein sequence was searched against Proline Glutamic Acid Rich domains using CLUSTAL2.1 software. Three proteins were found to exhibit homology with PER domain of GILZ as shown.

References

    1. Aguilar DC, Strom J, Xu B, Kappeler K, Chen QM. Expression of Glucocorticoid Induced Leucine Zipper (GILZ) in Cardiomyocytes. Cardiovasc Tox. 2013;13:91–99. - PMC - PubMed
    1. Andeersen CL, Jensen JL, Orntoft TF. Normalization of Real-Time Quantitative Reverse Transcription-PCR Data: A Model-Based Variance Estimation Approach to Identify Genes Suited for Normalization, Applied to Bladder and Colon Cancer Data Sets. Cancer Res. 2004;64:5245–5250. - PubMed
    1. Ayroldi E, Migliorati G, Bruscoli S, Marchetti C, Zollo O, Cannarile L, D’Adamio F, Riccardi C. Modulation of T-cell activation by the glucocorticoid-induced leucine zipper factor via inhibition of nuclear factor kappaB. Blood. 2001;98:743–753. - PubMed
    1. Ayroldi E, Riccardi C. Glucocorticoid-induced leucine zipper (GILZ): a new important mediator of glucocorticoid action. FASEB J. 2009;23:3649–3658. - PubMed
    1. Ayroldi E, Zollo O, Bastianelli A, Marchetti C, Agostini M, Di Virgilio R, Riccardi C. GILZ mediates the antiproliferative activity of glucocorticoids by negative regulation of Ras signaling. J Clin Invest. 2007;117:1605–1615. - PMC - PubMed

MeSH terms