Review
. 2014:84:151-208.
doi: 10.1016/B978-0-12-800099-1.00003-X.

Measuring changes in Plasmodium falciparum transmission: precision, accuracy and costs of metrics

Affiliations
Review

Measuring changes in Plasmodium falciparum transmission: precision, accuracy and costs of metrics

Lucy S Tusting et al. Adv Parasitol. 2014.

Abstract

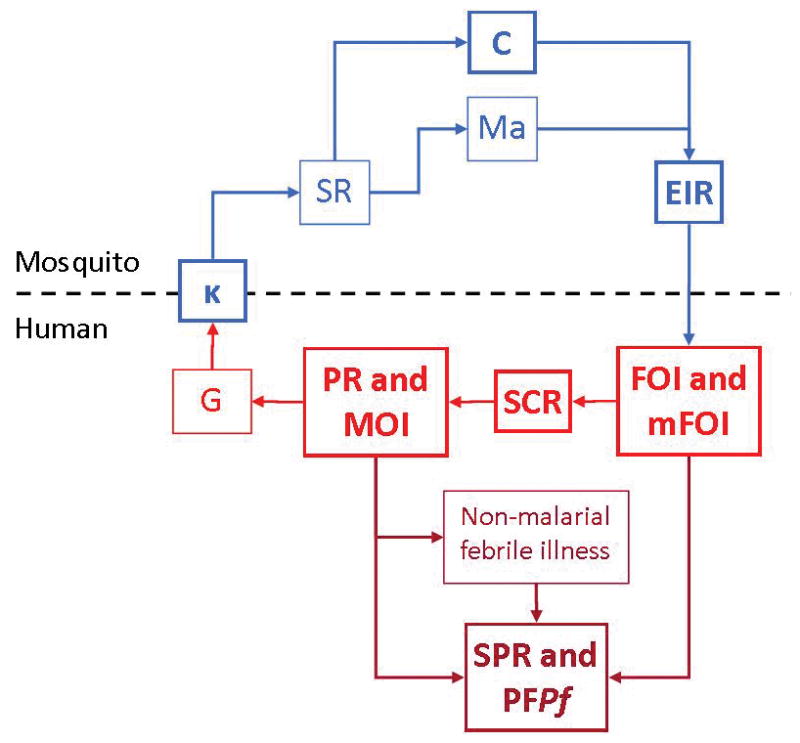
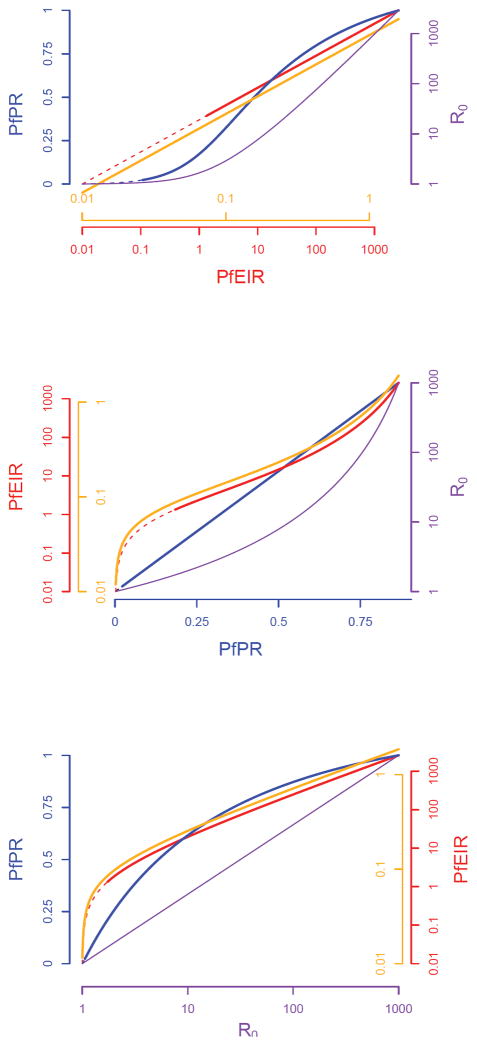
As malaria declines in parts of Africa and elsewhere, and as more countries move towards elimination, it is necessary to robustly evaluate the effect of interventions and control programmes on malaria transmission. To help guide the appropriate design of trials to evaluate transmission-reducing interventions, we review 11 metrics of malaria transmission, discussing their accuracy, precision, collection methods and costs and presenting an overall critique. We also review the nonlinear scaling relationships between five metrics of malaria transmission: the entomological inoculation rate, force of infection, sporozoite rate, parasite rate and the basic reproductive number, R0. Our chapter highlights that while the entomological inoculation rate is widely considered the gold standard metric of malaria transmission and may be necessary for measuring changes in transmission in highly endemic areas, it has limited precision and accuracy and more standardised methods for its collection are required. In areas of low transmission, parasite rate, seroconversion rates and molecular metrics including MOI and mFOI may be most appropriate. When assessing a specific intervention, the most relevant effects will be detected by examining the metrics most directly affected by that intervention. Future work should aim to better quantify the precision and accuracy of malaria metrics and to improve methods for their collection.

Keywords: Elimination; Endemicity; Malaria; Metric; Plasmodium; Transmission; Vector.


Figures

Figure 1
Figure 1. Metrics of malaria transmission
Metrics evaluated in this paper are in bold. Blue indicates entomological metrics; red indicates clinical metrics; dark red indicates asymptomatic and symptomatic infections identified in health facilities. κ: net infectiousness of humans; SR: sporozoite rate; C: vectorial capacity; Ma: human biting rate; EIR: entomological inoculation rate,; FOI: force of infection; mFOI: molecular force of infection; MOI: multiplicity of infection; SCR: sero-conversion rate ; PR: parasite rate; MOI: multiplicity of infection; G: gametocyte rate; SPR: slide positivity rate; PFPf: proportion of fevers parasitaemic. Parasite rate (PR) is the proportion of the proportion of people who are infected with parasites and the gametocyte prevalence is the proportion of people carrying gametocytes in their blood. The human biting rate is the number of bites by vector mosquitoes received per human per day, denoted Ma, and some portion of mosquitoes biting infectious humans become infected. Since gametocytes must be present for a mosquito to become infected, gametocyte rates give an index of the net infectiousness of the human populations to mosquitoes, which is defined as the probability that a mosquito becomes infected after biting a human, denoted κ. Thereafter, each mosquito gives some number of infectious bites. The average number of human bloodmeals taken by a mosquito over a lifetime has been called the stability index, S, and the proportion of infected mosquitoes that survive long enough to transmit, P. The sporozoite rate, SR, in a stable population is related to κ by a formula SR=SPκ1+SκSPκ. EIR is the expected number of infectious bites per person per day, a product of SR and Ma (Onori and Grab, 1980b). Vectorial capacity, C, describes the relationship between κ and EIR and reflects the efficiency of the malaria vector, or ‘the expected number of humans infected per infected human, per day, assuming perfect transmission efficiency’ (Smith and McKenzie, 2004). The t-day attack rate, denoted A(t), is the proportion of people who become infected over some interval of time of length t. This is the typical metric used to count human infections. The annual force of infection (aFOI) is the number of infections per person per year. In a population with homogenous risk, the attack rate is related to the force of infection by the relationship A(t) = 1 − eht. Two measures that are closely related to the AR and the FOI are the clinical attack rate (cAR), and the clinical force of infection (cFOI), which are defined in the same way as their respective clinical measures, but they are accompanied by clinical symptoms. The seroconversion rate describes the rate at which a population develops detectable malaria antibodies in the serum as a result of malaria infection.
Figure 2
Figure 2. Relationship between metrics of malaria transmission
(a) Annual FOI versus R0; Annual EIR versus R0: Derived from a malaria transmission model, with assumptions of heterogeneous biting and superinfection, of PfPR versus PfEIR (Smith et al., 2010). (b) SR versus R0: Derived from a malaria transmission model, with assumptions of heterogeneous biting and superinfection, of PfPR versus PfRc (Smith et al., 2010), assuming sporozoite rate is linearly proportional to PfPR. PR versus R0: Malaria transmission model, with assumptions of heterogeneous biting and superinfection (Smith et al., 2010). (c) Annual FOI versus annual EIR: Model of heterogeneous biting fitted to synthetic cohort data from Saradidi, Kenya (Smith et al., 2010). (d) SR versus annual EIR: Derived from a log-linear model of PfPR versus EIR (Gething et al., 2011), with the assumption that sporozoite rate is linearly proportional to PfPR; PR versus annual EIR: Log-linear model of PfPR versus EIR (Gething et al., 2011). (e) PR versus annual FOI: Derived from a log-linear model of PfPR versus EIR (Gething et al., 2011). (f) SR versus PR: Best-fit model for reported sporozoite rate-PfPR pairs (Smith et al., 2005).
Figure 3
Figure 3. Potential utility of metrics at different levels of endemicity
Figure 3a: A plot of the logarithm of the annual PfEIR against itself (red), the logarithm of the PfSCR (orange), the PfPR2–10 (blue), and the logarithm of the PfR0 (purple). These relationships are based on one particular model for the steady state relationships. The annual EIR is difficult to measure when the annual EIR is less than one because of the large sample sizes required to catch sufficient vectors both infected and non infected. Similarly, the PR is difficult to measure when it is less than about 1% because of the large sample population sizes that need to be screened. For both measures the solid line indicates those values where it can be measured accurately with reasonable effort, while the dashed line illustrates where the accuracy will wane. The cut-offs for “reasonable effort” could vary depend on costs and priorities. The SCR has some advantages because it can be measured across the spectrum. Nothing is implied about the effort required to measure R0, since it is generally inferred from the other metrics, based on some transmission model. The shapes of the curves have all been standardized to have the same minimum and maximum over the observed range of values to illustrate how the shapes of these curves affect the relative amount of information about transmission at different points along the spectrum. The steeper the curve, the more information that is conveyed about one metric relative to another. Figure 3b and 3c are the same curves with the PfPR2–10 and the logarithm of the R0 on the x-axis respectively. We have not attempted to incorporate any estimates of error in to these plots.

References

    1. Adungo P, et al. Comparative determination of Plasmodium falciparum sporozoite rates in Afrotropical Anopheles from Kenya by dissection and ELISA. Ann Trop Med Parasitol. 1991;85:387–94. - PubMed
    1. Akter J, et al. Genotyping of Plasmodium falciparum using antigenic polymorphic markers and to study anti-malarial drug resistance markers in malaria endemic areas of Bangladesh. Malar J. 2012;11:386. - PMC - PubMed
    1. Arnot D. Unstable malaria in Sudan: the influence of the dry season. Clone multiplicity of Plasmodium falciparum infections in individuals exposed to variable levels of disease transmission. Trans R Soc Trop Med Hyg. 1998;92:580–585. - PubMed
    1. Arnot D, et al. Circumsporozoite protein of Plasmodium vivax: gene cloning and characterization of the immunodominant epitope. Science. 1985;230:815–8. - PubMed
    1. Atroosh W, et al. Genetic diversity of Plasmodium falciparum isolates from Pahang, Malaysia based on MSP-1 and MSP-2 genes. Parasit. Vectors. 2011;13:233. - PMC - PubMed

Publication types

MeSH terms

LinkOut - more resources