. 2014:537:75-91.
doi: 10.1016/B978-0-12-411619-1.00005-7.

Adipose tissue angiogenesis assay

Affiliations

Adipose tissue angiogenesis assay

Raziel Rojas-Rodriguez et al. Methods Enzymol. 2014.

Abstract

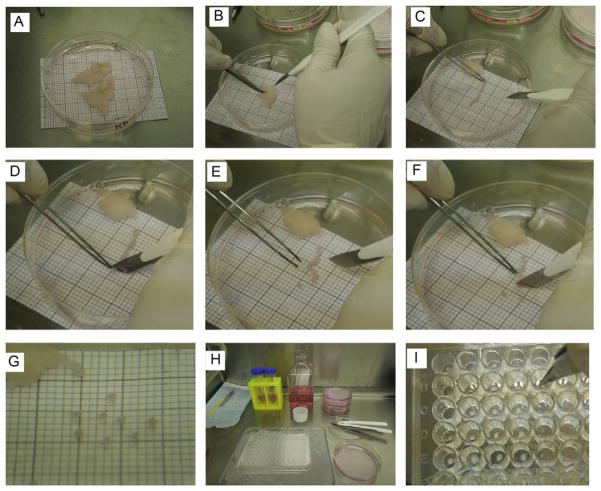
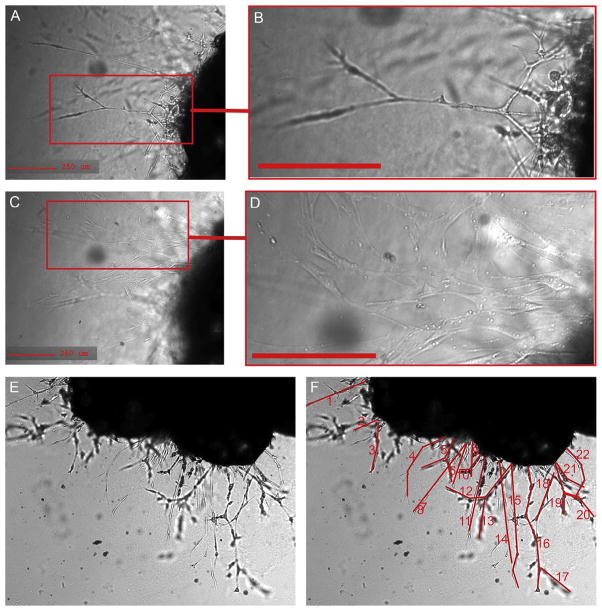
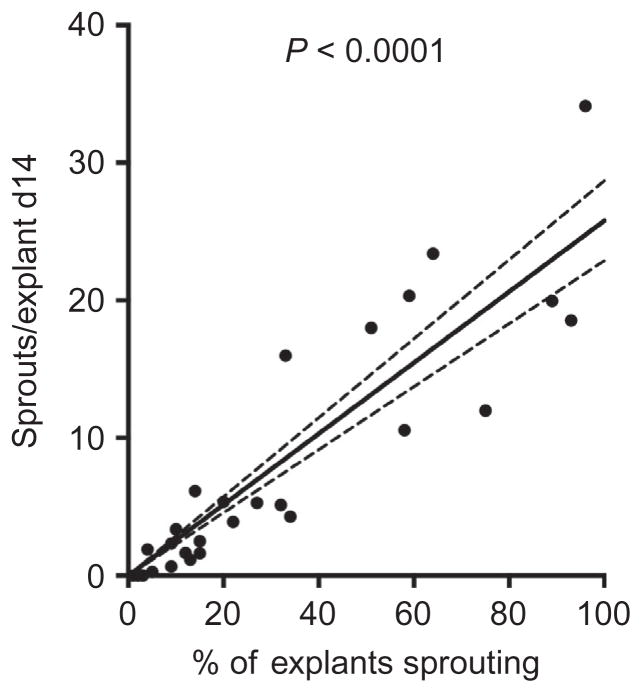
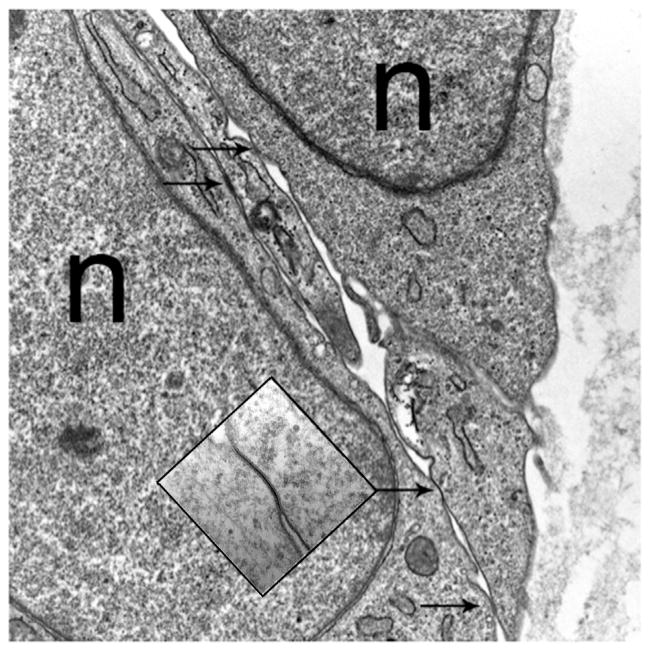
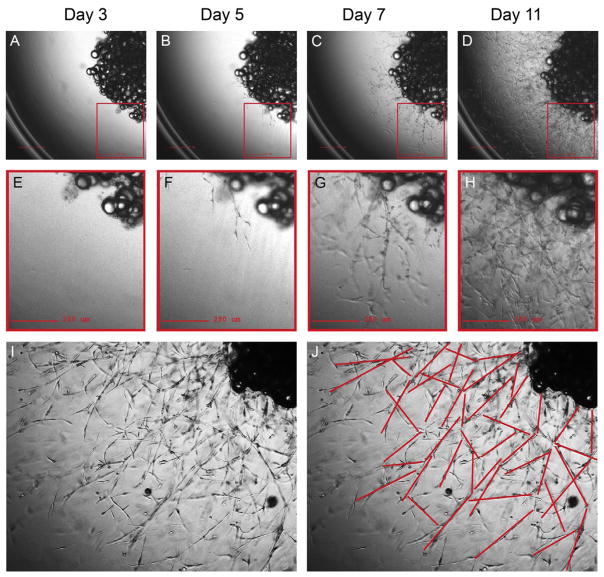
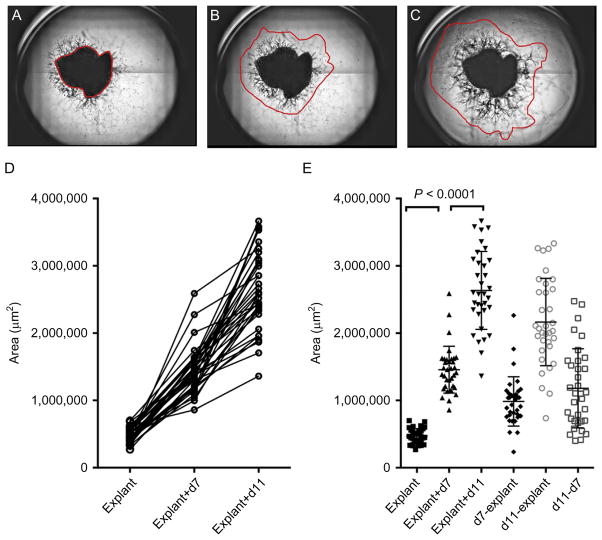
Changes in adipose tissue mass must be accompanied by parallel changes in microcirculation. Investigating the mechanisms that regulate adipose tissue angiogenesis could lead to better understanding of adipose tissue function and reveal new potential therapeutic strategies. Angiogenesis is defined as the formation of new capillaries from existing microvessels. This process can be recapitulated in vitro, by incubation of tissue in extracellular matrix components in the presence of pro-angiogenic factors. Here, we describe a method to study angiogenesis from adipose tissue fragments obtained from mouse and human tissue. This assay can be used to define effects of diverse factors added in vitro, as well as the role of endogenously produced factors on angiogenesis. We also describe approaches to quantify angiogenic potential for the purpose of enabling comparisons between subjects, thus providing information on the role of physiological conditions of the donor on adipose tissue angiogenic potential.

Keywords: Adipocytes; Angiogenesis; Capillary branches; Endothelial cells; Obesity; Sprouts; Vascularization.


Figures

Figure 5.1
Figure 5.1
Embedding procedure. (A) Adipose tissue samples placed in a 100 cm petri dish containing 25 ml of EGM-2 MV medium. The millimeter (mm) paper placed under the petri dish is used as a size reference. (B) Sample of adipose tissue in plate #2 containing 15 ml of EGM-2 MV medium. The scalpel and forceps are used to hold the fat and cut it into strips. (C) Piece of fat strip cut from the adipose tissue sample. Using the millimeter paper reference, the fat strip is aligned in order to cut the appropriate size of each slice (explant). (D) For the first cut, it is easier to start at one of the ends of the adipose tissue strip. The forceps are used to hold the fat while the scalpel is used to cut the slice. (E) The explant is aligned with one of the quadrants in the millimeter paper to verify adequate size. (F) The rest of the strip is cut into slices. The adipose tissue is held by forceps and the cut is done by the scalpel. While handling the forceps, avoid pulling or stretching the fat, since it may damage the tissue. (G) Individual slices cut to appropriate size and verified with the millimeter paper. (H). Display of workstation in the biocabinet before starting the embedding procedure. Explants were transferred to plate #3, containing 25 ml of EGM-2 MV medium. 96-multiwell plate is kept in a tray filled with ice for the embedding steps. (I) Embedding step. After the Matrigel is dispensed, forceps are used to place the explants, one per well. The explant is positioned at the center of the well.
Figure 5.2
Figure 5.2
Cells emerging from mouse adipose tissue explant. (A, B) Capillary sprout emerging from embedded mouse explant, displaying characteristic linear branching structure. (C, D) Focus set to the surface of the well, where fibroblastic adherent cells can be seen emerging from the explant, observed at a different optical plane of the image. (E) Phase contrast image of the explant and the capillary sprouts 14 days post-embedding. (F) Structures shown in red highlight formations that can be considered to be sprouts.
Figure 5.3
Figure 5.3
Linear correlation between the number of explants sprouting and the quantity of sprouts per explant from mouse adipose tissue. Capillary sprouting was quantified in a study of 36 mice fed normal or high-fat diet for 3–30 weeks. 25–30 explants from each mouse were embedded. The percent of the embedded explants for each mouse displaying sprouts after 14 days of culture is plotted on the x-axis. The mean number of sprouts per explant (i.e., sum of sprouts in all explants/total number of explants embedded) is plotted on the ml axis. Linear regression was calculated using PRISM software.
Figure 5.4
Figure 5.4
Electron micrograph of capillary sprouts from a human adipose tissue explant. Arrows identify tight junctions. n, nucleus.
Figure 5.5
Figure 5.5
Capillary sprouting from human adipose tissue. A human explant from subcutaneous adipose tissue at days 3 (A, B), 5 (C, D), 7 (E, F), and 11 (G, H) post-embedding. Capillary sprouting begins to be observed at day 5. After day 11, the growth is highly increased (I, J), making difficult to identify all sprout formation.
Figure 5.6
Figure 5.6
Digital analysis of capillary growth area. An example of montages generated from bright field images of quadrants of a single well from a 96-well-multiwell plate containing an explant from human omental adipose tissue. The region of the explant (A), and of capillary growth at day 7 (B), and day 11 (C) postembedding is delineated. The areas are calculated for the selected regions highlighted in red. (D) Calculated areas of 34 explants from the same tissue sample growing in the same 96-well-multiwell plotted in a before–after format, revealing linear growth in all embedded explants over the culture period. (E) Scatter plot displaying the means and standard deviation of the values obtained for each explant at each time point, and values obtained after subtracting the area of the initial explant. Paired Student’s t-test between time points reveals highly significant differences, which can be used to compare angiogenic potential among different donors.

References

    1. Aplin AC, Fogel E, Zorzi P, Nicosia RF. The aortic ring model of angiogenesis. Methods in Enzymology. 2008;443:119–136. - PubMed
    1. Baker M, Robinson SD, Lechertier T, Barber PR, Tavora B, D’Amico G, et al. Use of the mouse aortic ring assay to study angiogenesis. Nature Protocols. 2012;7:89–104. - PubMed
    1. Cho CH, Koh YJ, Han J, Sung HK, Jong Lee H, Morisada T, et al. Angiogenic role of LYVE-1-positive macrophages in adipose tissue. Circulation Research. 2007;100:e47–e57. - PubMed
    1. Christiaens V, Lijnen HR. Angiogenesis and development of adipose tissue. Molecular and Cellular Endocrinology. 2010;318:2–9. - PubMed
    1. Crandall DL, Hausman GJ, Kral JG. A review of the of adipose tissue: Anatomic, metabolic, and angiogenic perspectives. Microcirculation. 1997;4:211–232. - PubMed

Publication types