. 2014 Mar 15;74(6):1670-81.
doi: 10.1158/0008-5472.CAN-13-0777. Epub 2014 Jan 30.

Identification of immune factors regulating antitumor immunity using polymeric vaccines with multiple adjuvants

Affiliations

Identification of immune factors regulating antitumor immunity using polymeric vaccines with multiple adjuvants

Omar A Ali et al. Cancer Res. .

Abstract

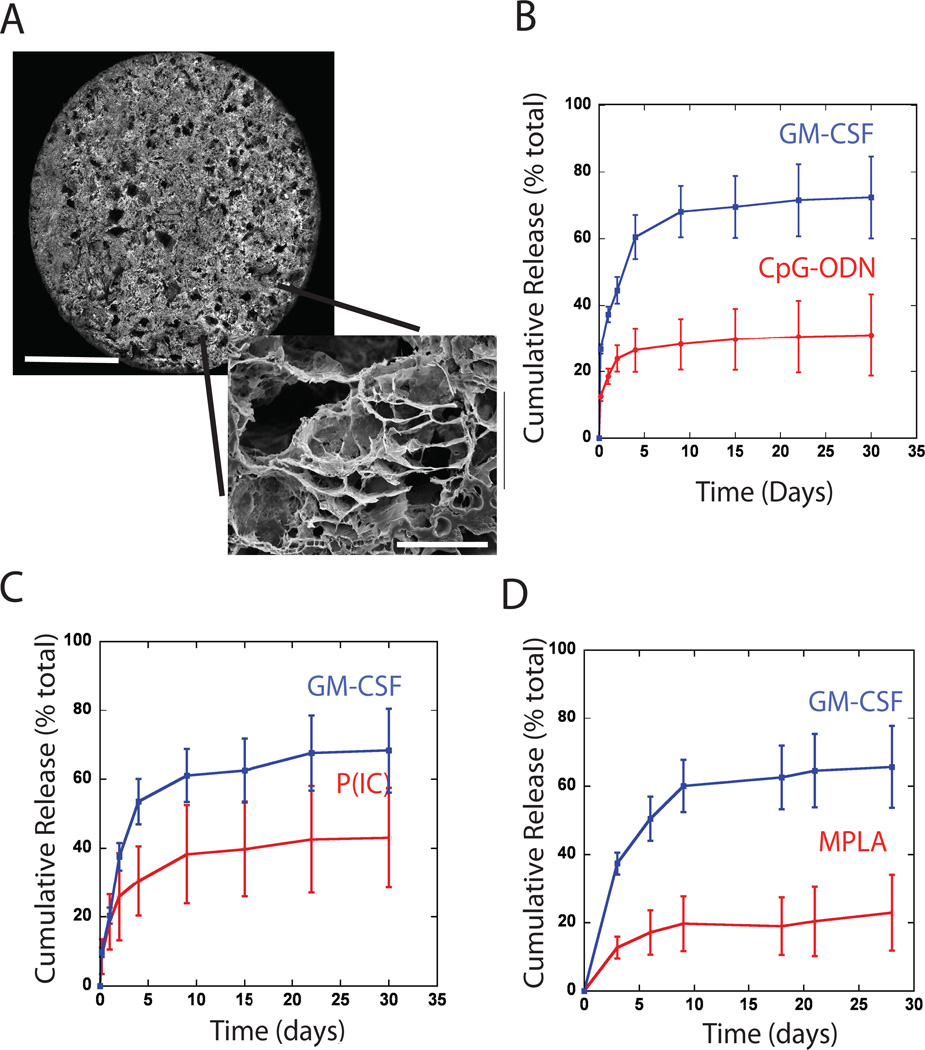
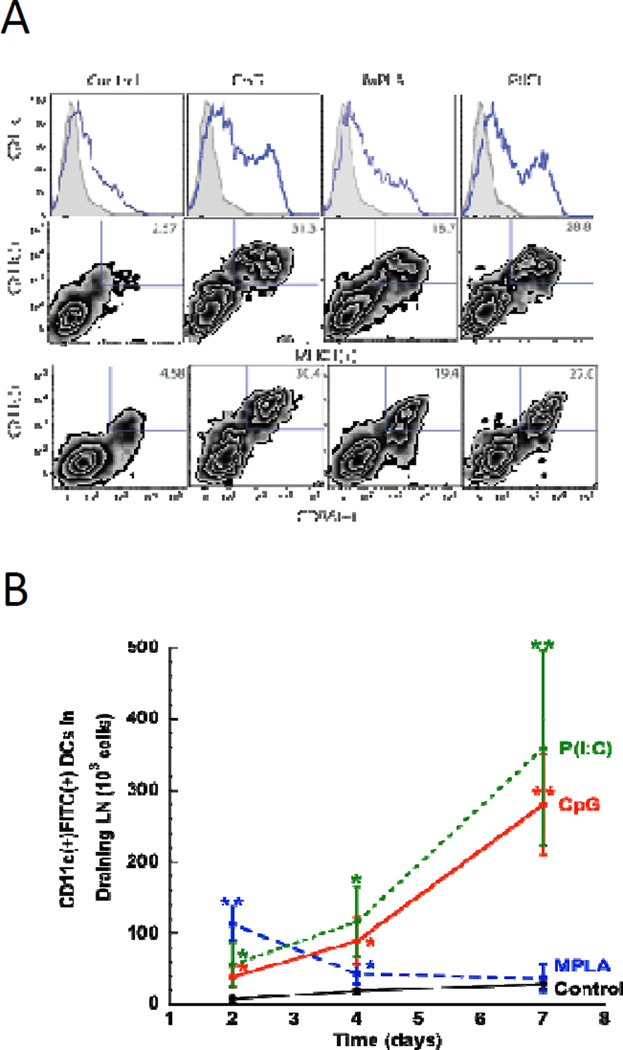
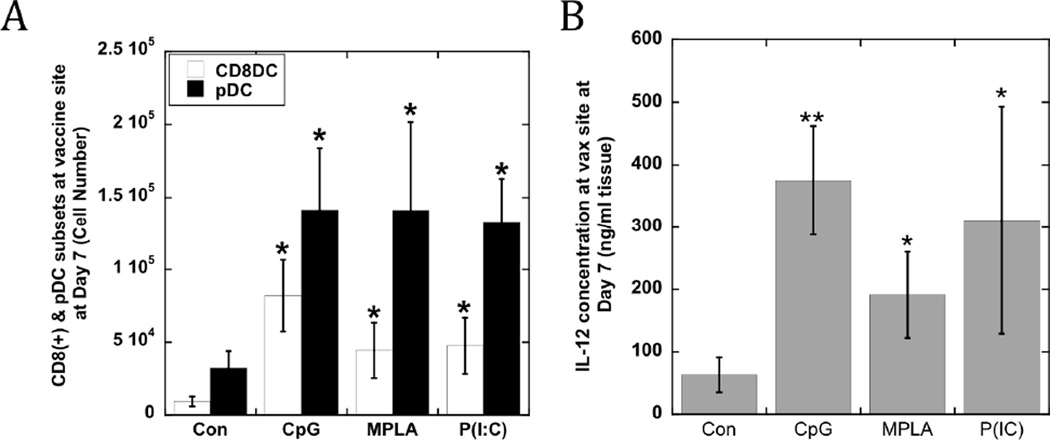
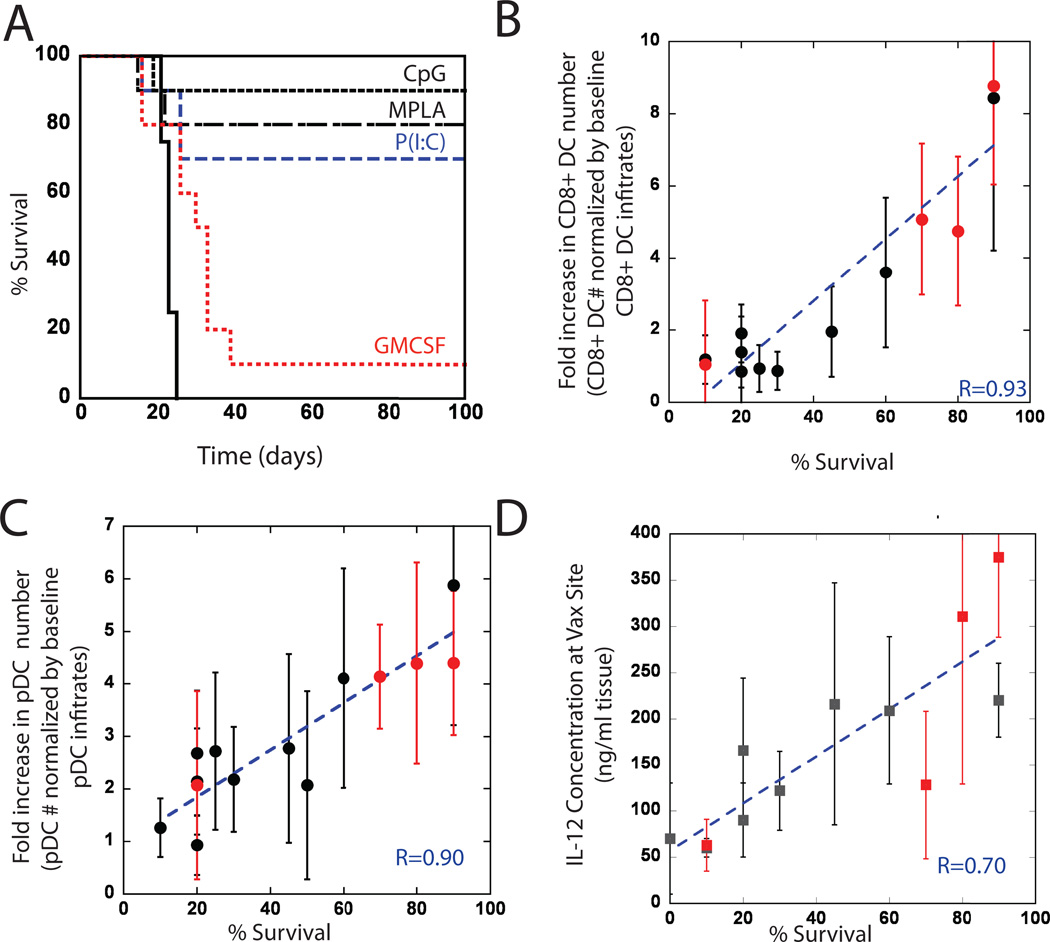
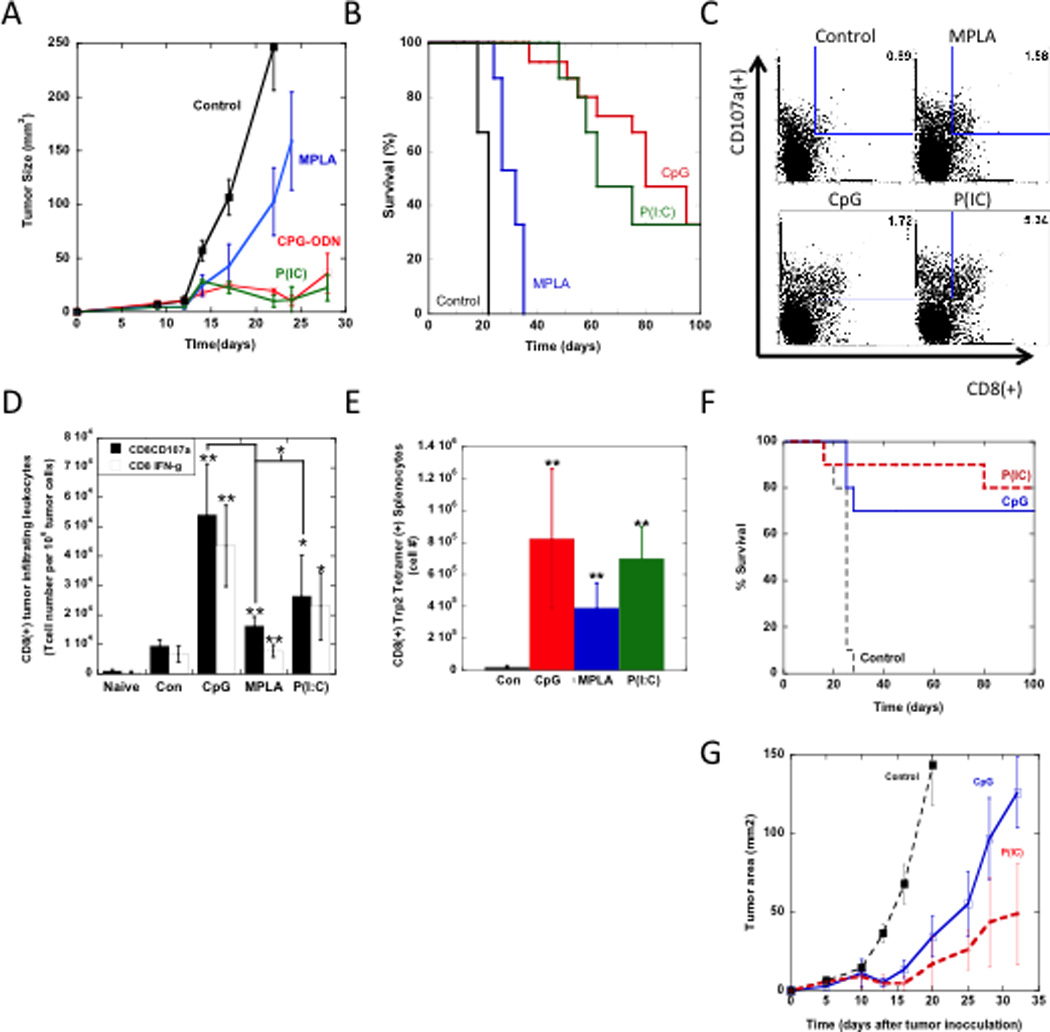
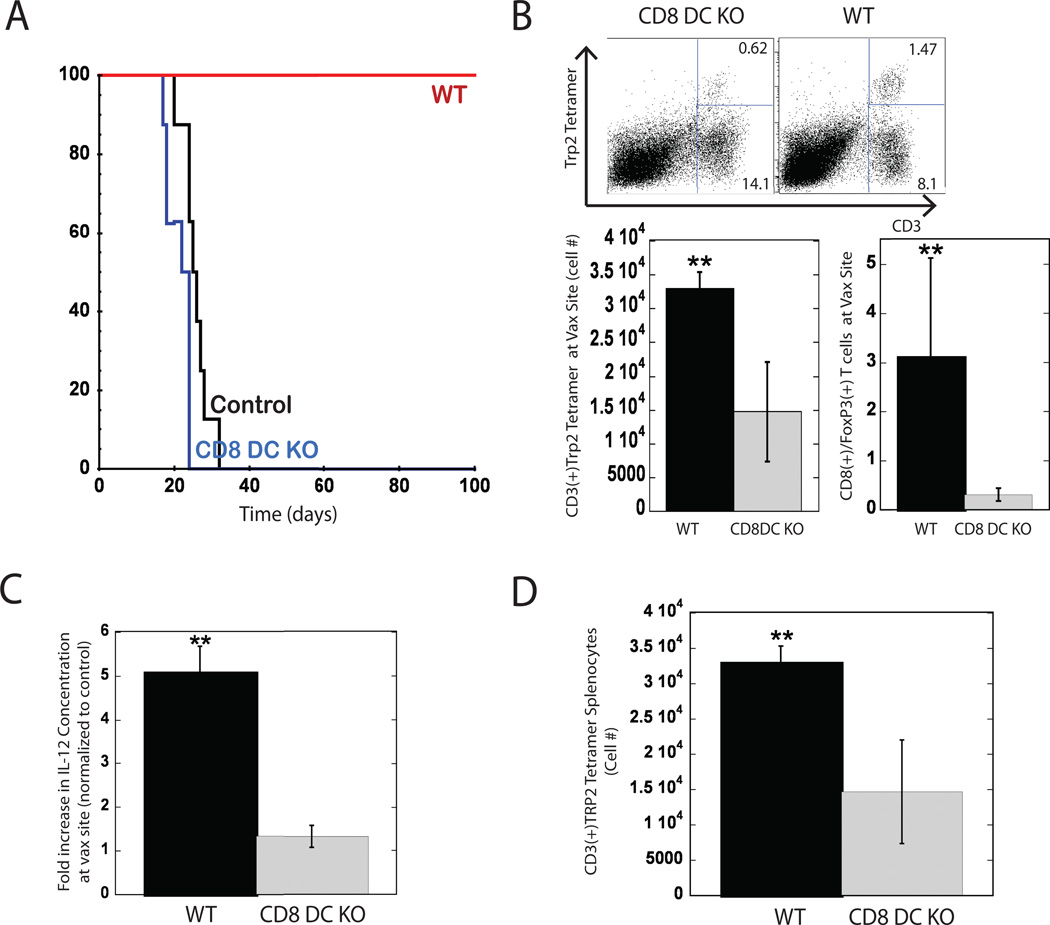
The innate cellular and molecular components required to mediate effective vaccination against weak tumor-associated antigens remain unclear. In this study, we used polymeric cancer vaccines incorporating different classes of adjuvants to induce tumor protection, to identify dendritic cell (DC) subsets and cytokines critical to this efficacy. Three-dimensional, porous polymer matrices loaded with tumor lysates and presenting distinct combinations of granulocyte macrophage colony-stimulating factor (GM-CSF) and various Toll-like receptor (TLR) agonists affected 70% to 90% prophylactic tumor protection in B16-F10 melanoma models. In aggressive, therapeutic B16 models, the vaccine systems incorporating GM-CSF in combination with P(I:C) or CpG-ODN induced the complete regression of solid tumors (≤40 mm(2)), resulting in 33% long-term survival. Regression analysis revealed that the numbers of vaccine-resident CD8(+) DCs, plasmacytoid DCs (pDC), along with local interleukin (IL)-12, and granulocyte colony-stimulating factor (G-CSF) concentrations correlated strongly to vaccine efficacy regardless of adjuvant type. Furthermore, vaccine studies in Batf3(-/-) mice revealed that CD8(+) DCs are required to affect tumor protection, as vaccines in these mice were deficient in cytotoxic T lymphocytes priming and IL-12 induction in comparison with wild-type. These studies broadly demonstrate that three-dimensional polymeric vaccines provide a potent platform for prophylactic and therapeutic protection, and can be used as a tool to identify critical components of a desired immune response. Specifically, these results suggest that CD8(+) DCs, pDCs, IL-12, and G-CSF play important roles in priming effective antitumor responses with these vaccines.


Conflict of interest statement

Conflict of Interest: O.A., G.D., and D.J.M. are inventors on both a patent and a filed application for a patent on the technologies described in this manuscript. The other authors disclosed no potential conflicts of interest.

Figures

Figure #1
Figure #1. SEM of scaffolds, and in vitro release kinetics of various TLR agonists from GM-CSF loaded PLG scaffolds
(A) Photomicrographs of top surface of macroporous PLG scaffold (scale bar – 3mm), and SEM micrograph of a scaffold cross-section (scale bar – 50µm). Cumulative release of (B) CpG-rich oligonucleotides (CpG 1826), (C) P(I:C) or (D) MPLA in combination with the cumulative release of GM-CSF from each of the PLG scaffold types. Values represent mean and standard deviation (n=5 or 6).
Figure #2
Figure #2. DC recruitment, activation, and LN homing is regulated by TLR agonist presentation at vaccine site
(A) FACS histograms and plots representing scaffold infiltrating dendritic cells in GM-CSF loaded scaffolds (Con) or scaffolds loaded with GM-CSF in combination with CpG-ODN (CpG), MPLA (MPLA), and P(I:C) (P(IC)) at day 7 post-implantation in mice. Histograms indicate the relative frequency of CD11c(+) dendritic cells infiltrating the indicated scaffold formulation. Density plots indicate cells stained for CD11c(+) in combination with activated, DC markers, CD86(+) and MHCII(+). Numbers in the upper right quadrant of FACS plots indicate the percentage of CD11c(+) dendritic cells positive for activation markers. (B) The number of FITC(+)CD11c(+) dendritic cells present in the draining, inguinal lymph nodes at 2, 4, and 7 days after implantation of FITC-loaded matrices incorporating, GM-CSF (Control) and matrices loaded with GM-CSF in combination with CpG-ODN (CpG), MPLA (MPLA), and P(I:C) (P(IC)). Values represent mean and standard deviations (n=6). * P<0.05 ** P<0.01, as compared to GM-CSF loaded matrices (Con).
Figure #3
Figure #3. CD8(+) and pDC subsets, and IL-12 concentrations at vaccine site
(A) The total numbers of CD11c(+)CD8(+) DCs and pDCs at scaffold site at day 7, and (B) the local IL-12 concentration after implantation of GM-CSF loaded scaffolds (Con) and scaffolds loaded with GM-CSF in combination with CpG-ODN (CpG), MPLA (MPLA), and P(I:C) (P(IC)). Values represent mean and standard deviations (n=6). * P<0.05 ** P<0.01, as compared to GM-CSF loaded matrices (Con).
Figure #4
Figure #4. Prophylactic vaccination, and survival correlation to CD8(+) and pDC subsets and IL-12 concentrations at vaccine site
Mice were vaccinated with PLG vaccines 14 days prior to B16-F10 melanoma tumor challenge (105 cells). (A) A comparison of survival in untreated mice (Control) and mice treated with GM-CSF loaded PLG scaffolds (GM-CSF) or with PLG scaffolds loaded with GM-CSF in combination with CpG-ODN (CpG), P(I:C), or MPLA. Plots of the normalized magnitude of (B) CD11c(+)CD8(+) DC infiltration, (C) pDC infiltration at the vaccine site, and (D) local IL-12 concentration versus the percent of animals surviving at Day 100 following B16-F10 melanoma tumor challenge (survival data taken from experimental conditions in (A; red data points) and previously reported data with this system). r values in B–C represent the linear correlation coefficient between y-axis variables (normalized by baseline levels in control scaffolds) and survival percentage.
Figure 5
Figure 5. Therapeutic Vaccination and anti-tumor T cell activity
A comparison of the (A) tumor size and (B) overall survival in mice bearing established melanoma tumors (inoculated with 5×10⁵ B16-F10 cells and allowed to develop for 9 days) that were treated with either GM-CSF loaded matrices (Con) or matrices loaded with GM-CSF in combination with CpG-ODN (CpG), MPLA (MPLA), and P(I:C) (P(IC)). Mice were vaccinated twice, at days 9 and 19. (C) FACS plots representing tumor infiltrating leukocytes in tumors of mice that were vaccinated once with either GM-CSF loaded matrices (Control) or matrices loaded with GM-CSF in combination with CpG-ODN (CpG), MPLA (MPLA), and P(I:C) (P(IC)) at Day 9 after tumor inoculation. Single cell suspensions were prepared from tumors at Day 18 and stained for activated, cytotoxic T cell markers, CD8(+) and CD107a. Numbers in FACS plots indicate the percentage of the cell population positive for both markers. (D) The numbers of CD8(+), tumor-infiltrating T cells positive for both IFNγ and CD107a in untreated mice (naïve) or mice vaccinated with various treatments. (E) The total numbers of Trp2-specific cytotoxic T cells in splenocytes of vaccinated mice. (F and G) Prophylactic and therapeutic vaccine efficacy in the lewis lung carcinoma (LLC) model. (F) A comparison of survival in untreated mice (Control) and mice treated with PLG vaccines loaded with GM-CSF in combination with CpG-ODN (CpG), or P(I:C). Mice were vaccinated with PLG vaccines 14 days prior to LLC tumor cell challenge (105 cells). (G) A comparison of the tumor size in mice bearing established LLC tumors (inoculated with 5×10⁵ LLC cells and allowed to develop for 9 days) that were untreated (Con) or treated with PLG vaccines loaded with CpG-ODN (CpG) or P(I:C) (P(IC)). (N=10). Data in represent the mean and standard deviation (D and E) or standard error of the mean (B and G).* P<0.05 ** P<0.01, as compared to control matrices (loaded with GM-CSF), unless otherwise noted.
Figure 6
Figure 6. Vaccine efficacy is impaired in mice lacking CD8(+) DC
(A) Survival times of untreated mice (control), wild type C57BL/6J mice (WT) and Batf3−/− mice (CD8 DC KO), vaccinated with PLG vaccines 14 days prior to B16-F10 melanoma tumor challenge (105 cells). (B) Analysis of cytotoxic and regulatory T cells at PLG vaccine site of WT and CD8 DC KO mice at day 10 post implantation. FACS dot plots indicate scaffold-infiltrating cells stained for CD3(+) and Trp2(+) tetramer. Numbers in the upper right quadrant of FACS plots indicate the percentage Trp2 specific cytotoxic T cell, and numbers in lower right quadrant represent the rest of the T cell population at the vaccine site. Graphs indicate the total numbers of Trp2-specific cytotoxic T cells at implant site and the ratio of CD8(+) cytotoxic T cells to regulatory T cells. (C) Fold increase in IL-12 concentration at vaccine site and (D) Trp(2)-specific cytotoxic T cells in spleens of vaccinated, WT and CD8 DC KO mice. CpG-ODN was the adjuvant utilized in vaccines. Data represent mean and standard deviation, (n=5)* P<0.05 ** P<0.01.

References

    1. Lanzavecchia A, Sallusto F. Regulation of T Cell Immunity by dendritic cells. Cell. 2001;106:263–266. - PubMed
    1. Banchereau J, Steinman RM. Dendritic cells and the control of immunity. Nature. 1998;392:245–252. - PubMed
    1. Mellman I, Steinman RM. Dendritic cells: specialized and regulated antigen processing machines. Cell. 2001;106:255–258. - PubMed
    1. Sansonetti PJ. The innate signaling of dangers and the dangers of innate signaling. Nat. Immunol. 2006;7:1237–1242. - PubMed
    1. Meylan E, Tschopp J, Karin M. Intracellular pattern recognition receptors in the host response. Nature. 2006;442:39–44. - PubMed

MeSH terms