

Fibulin-3 suppresses Wnt/β-catenin signaling and lung cancer invasion
- PMID: 24480807
- PMCID: PMC4123641
- DOI: 10.1093/carcin/bgu023
Fibulin-3 suppresses Wnt/β-catenin signaling and lung cancer invasion
Abstract
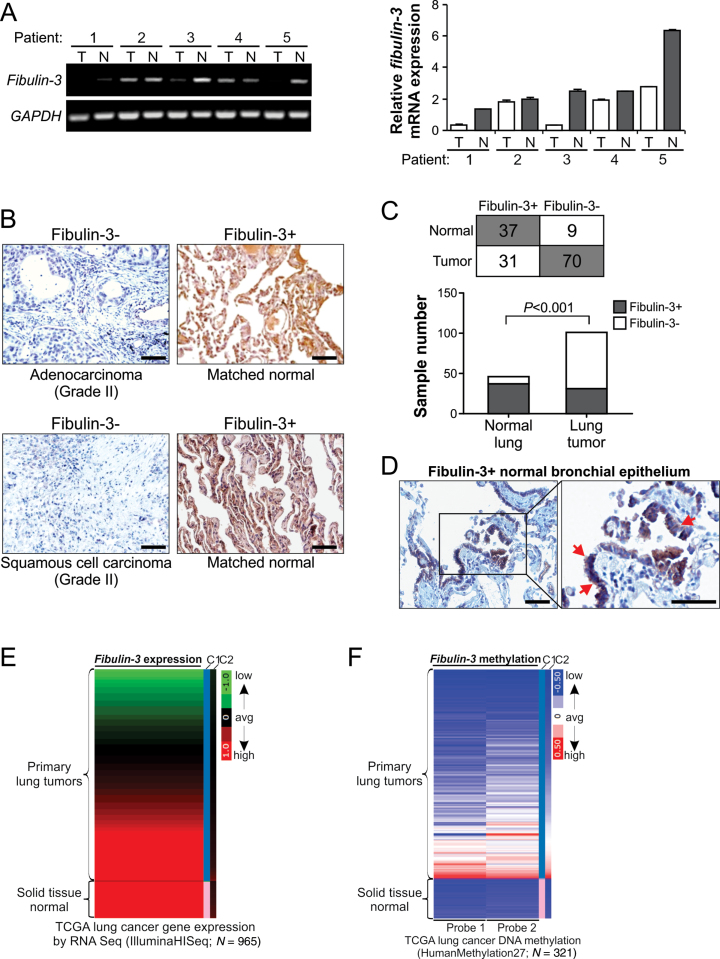
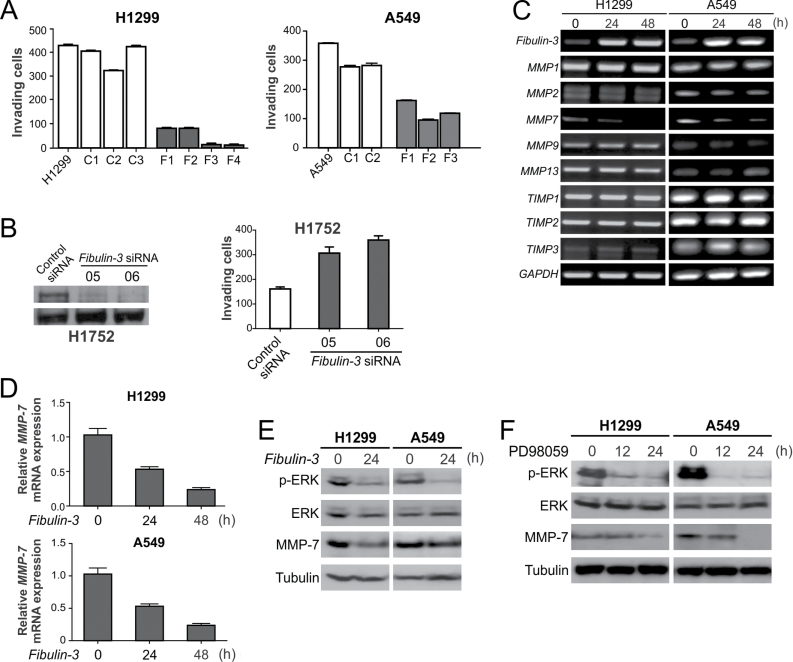
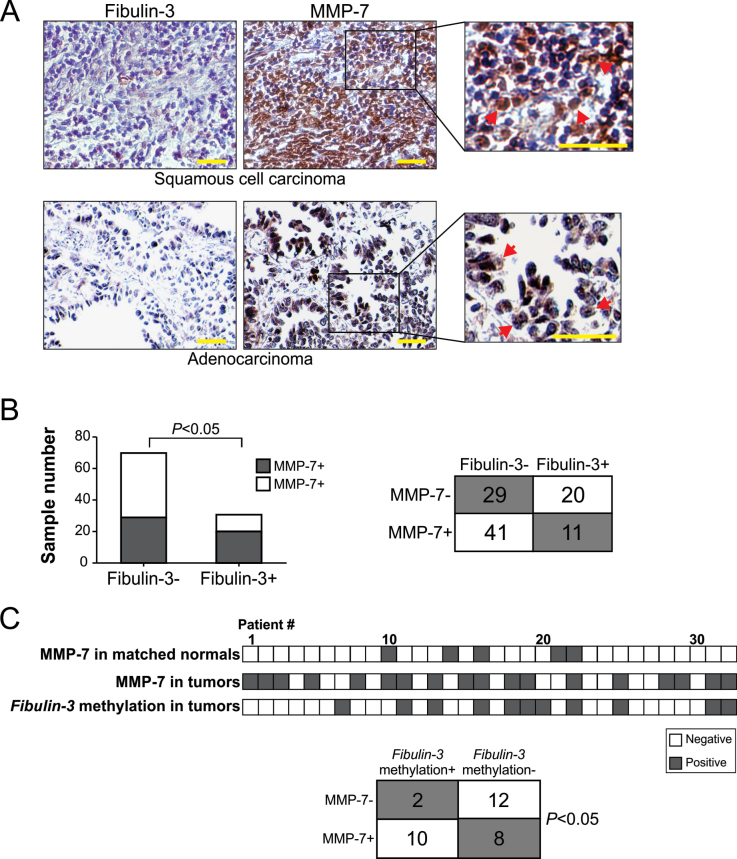
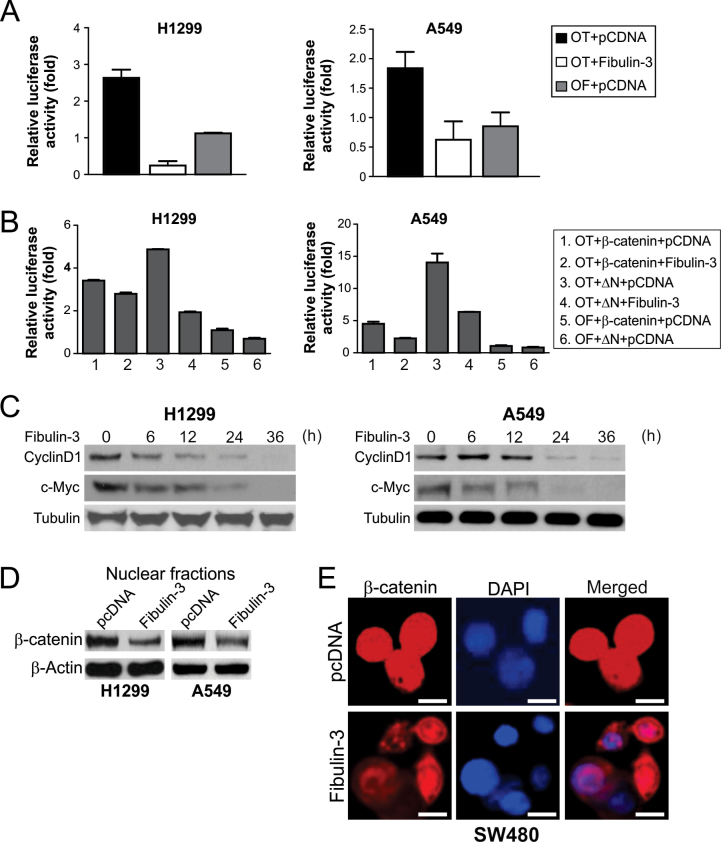
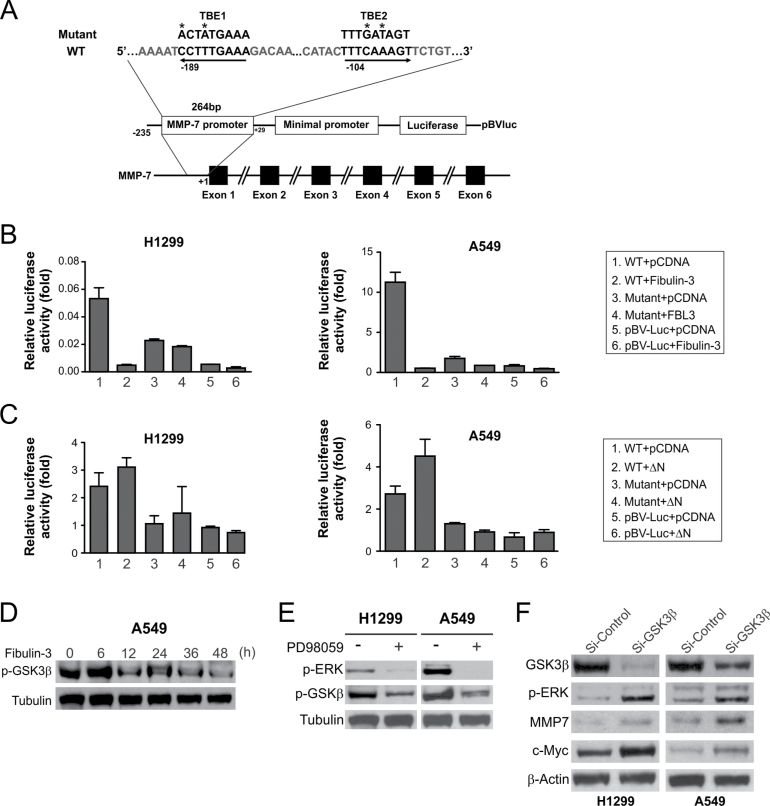
The 5 year survival rate of lung cancer is <20%, with most patients dying from distant metastasis. However, the molecular mechanisms underlying lung cancer invasion and metastasis have not been fully characterized. In this study, we found that fibulin-3, a fibulin family extracellular matrix protein, functions as a suppressor of lung cancer invasion and metastasis. Fibulin-3 was downregulated in large fractions of lung tumors and cell lines, and inhibited lung cancer cell invasion and the expression of matrix metalloproteinase-7 (MMP-7), a promoter of lung cancer invasion. The expression levels of fibulin-3 and MMP-7 were inversely correlated in lung tumors. Fibulin-3 inhibited extracellular signal-regulated kinase (ERK) to activate glycogen synthase kinase 3β and suppress Wnt/β-catenin signaling, which induces MMP-7 expression in lung cancer cells. Furthermore, fibulin-3 expression impeded the growth and metastasis of lung tumors in mice. Collectively, these results suggest that downregulation of fibulin-3 contributes to lung cancer invasion and metastasis by activating Wnt/β-catenin signaling and MMP-7 expression.
© The Author 2014. Published by Oxford University Press. All rights reserved. For Permissions, please email: journals.permissions@oup.com.
Figures

Similar articles
-
Fibulin-5 inhibits Wnt/β-catenin signaling in lung cancer.Oncotarget. 2015 Jun 20;6(17):15022-34. doi: 10.18632/oncotarget.3609. Oncotarget. 2015. PMID: 25909283 Free PMC article.
-
Fibulin-5 suppresses lung cancer invasion by inhibiting matrix metalloproteinase-7 expression.Cancer Res. 2009 Aug 1;69(15):6339-46. doi: 10.1158/0008-5472.CAN-09-0398. Epub 2009 Jul 7. Cancer Res. 2009. PMID: 19584278 Free PMC article.
-
Fibulin-3 promotes osteosarcoma invasion and metastasis by inducing epithelial to mesenchymal transition and activating the Wnt/β-catenin signaling pathway.Sci Rep. 2017 Jul 24;7(1):6215. doi: 10.1038/s41598-017-06353-2. Sci Rep. 2017. Retraction in: Sci Rep. 2023 Jul 19;13(1):11641. doi: 10.1038/s41598-023-38918-9. PMID: 28740094 Free PMC article. Retracted.
-
MiR-552-3p facilitated cell proliferation, migration and invasion by sponging Fibulin 5 in non-small cell lung cancer via activation of ERK/GSK3β/β-catenin signaling pathway.Tissue Cell. 2021 Dec;73:101672. doi: 10.1016/j.tice.2021.101672. Epub 2021 Oct 29. Tissue Cell. 2021. PMID: 34736163
-
MMP-7 marks severe pancreatic cancer and alters tumor cell signaling by proteolytic release of ectodomains.Biochem Soc Trans. 2022 Apr 29;50(2):839-851. doi: 10.1042/BST20210640. Biochem Soc Trans. 2022. PMID: 35343563 Free PMC article. Review.
Cited by
-
EFEMP1 promotes ovarian cancer cell growth, invasion and metastasis via activated the AKT pathway.Oncotarget. 2016 Jul 26;7(30):47938-47953. doi: 10.18632/oncotarget.10296. Oncotarget. 2016. PMID: 27351229 Free PMC article.
-
Transducin (β)-like 1 X-linked receptor 1 promotes gastric cancer progression via the ERK1/2 pathway.Oncogene. 2017 Mar 30;36(13):1873-1886. doi: 10.1038/onc.2016.352. Epub 2016 Oct 3. Oncogene. 2017. PMID: 27694893 Free PMC article.
-
Fibulin-3 knockdown inhibits cervical cancer cell growth and metastasis in vitro and in vivo.Sci Rep. 2018 Jul 13;8(1):10594. doi: 10.1038/s41598-018-28906-9. Sci Rep. 2018. Retraction in: Sci Rep. 2023 Jul 10;13(1):11162. doi: 10.1038/s41598-023-38389-y. PMID: 30006571 Free PMC article. Retracted.
-
WNT signaling - lung cancer is no exception.Respir Res. 2017 Sep 5;18(1):167. doi: 10.1186/s12931-017-0650-6. Respir Res. 2017. PMID: 28870231 Free PMC article. Review.
-
Bioinformatics analysis of microarray data to identify the candidate biomarkers of lung adenocarcinoma.PeerJ. 2019 Jul 10;7:e7313. doi: 10.7717/peerj.7313. eCollection 2019. PeerJ. 2019. PMID: 31333911 Free PMC article.
References
-
- Minna J.D., et al. (2002). Focus on lung cancer. Cancer Cell, 1, 49–52 - PubMed
-
- Nguyen D.X., et al. (2007). Genetic determinants of cancer metastasis. Nat. Rev. Genet., 8, 341–352 - PubMed
-
- Brinckerhoff C.E., et al. (2002). Matrix metalloproteinases: a tail of a frog that became a prince. Nat. Rev. Mol. Cell Biol., 3, 207–214 - PubMed
-
- Timpl R., et al. (2003). Fibulins: a versatile family of extracellular matrix proteins. Nat. Rev. Mol. Cell Biol., 4, 479–489 - PubMed
-
- Obaya A.J., et al. (2012). The dual role of fibulins in tumorigenesis. Cancer Lett., 325, 132–138 - PubMed
Publication types
MeSH terms
Substances
Grants and funding
LinkOut - more resources
Full Text Sources
Other Literature Sources
Medical
Miscellaneous
