Review
. 2014 Apr 21;43(8):2757-83.
doi: 10.1039/c3cs60444f. Epub 2014 Jan 30.

Photodissociation mass spectrometry: new tools for characterization of biological molecules

Affiliations
Review

Photodissociation mass spectrometry: new tools for characterization of biological molecules

Jennifer S Brodbelt. Chem Soc Rev. .

Abstract

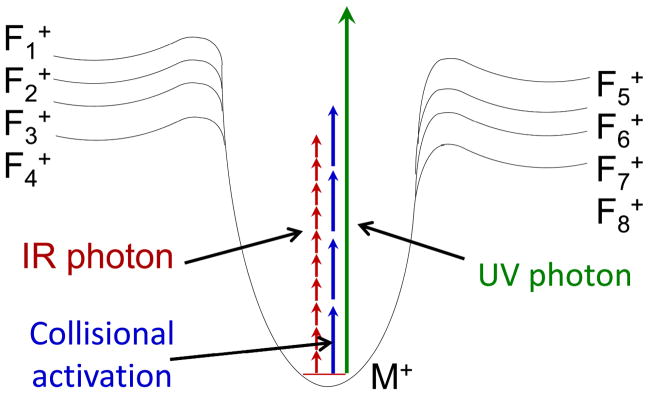
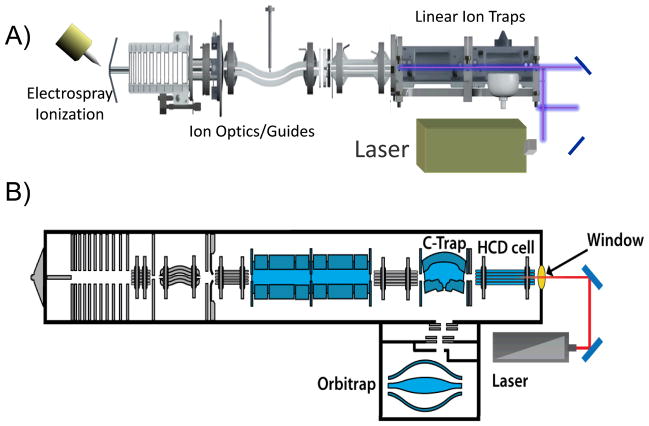
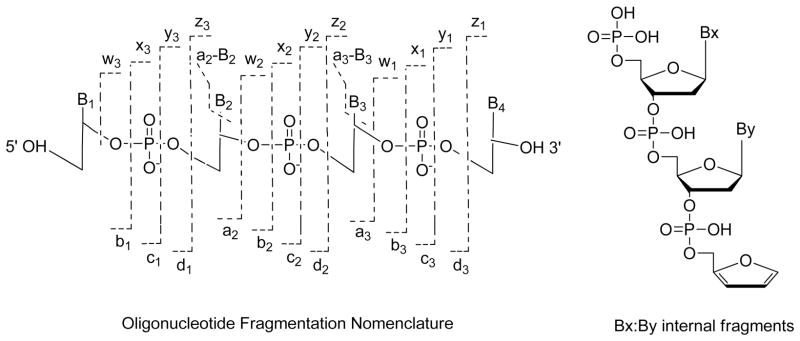
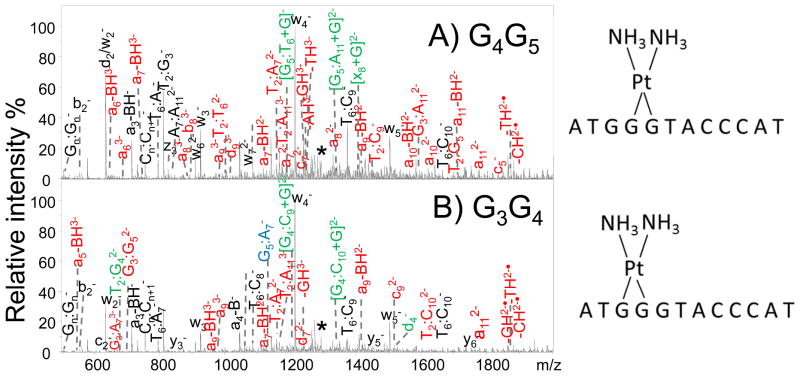
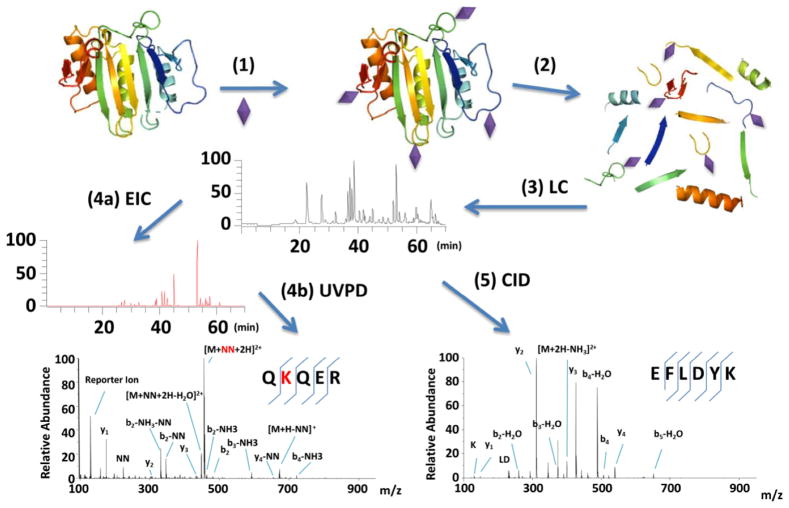
Photodissociation mass spectrometry combines the ability to activate and fragment ions using photons with the sensitive detection of the resulting product ions by mass spectrometry. This combination affords a versatile tool for characterization of biological molecules. The scope and breadth of photodissociation mass spectrometry have increased substantially over the past decade as new research groups have entered the field and developed a number of innovative applications that illustrate the ability of photodissociation to produce rich fragmentation patterns, to cleave bonds selectively, and to target specific molecules based on incorporation of chromophores. This review focuses on many of the key developments in photodissociation mass spectrometry over the past decade with a particular emphasis on its applications to biological molecules.


Figures

Figure 1
Figure 1
Energy diagram illustrating energy deposition by collisional activation or absorption of IR or UV photons where M+ represents a selected precursor ion and Fn+ represent various fragment ions with different activation energies.
Figure 2
Figure 2
Examples of lasers interfaced to mass spectrometer. (A) Dual cell linear ion trap. (B) Orbitrap mass spectrometer with photodissociation implemented in the HCD cell. Adapted with permission from Ref. . Copyright Springer 2011.
Figure 3
Figure 3
Oligonucleotide fragmentation nomenclature. Internal fragments result from a double backbone cleavage. The internal ions have a phosphate at their 5′ end and a furan at the 3′ terminal. B represents a nucleobase. Reprinted with permission from Reference . Copyright Springer 2013.
Figure 4
Figure 4
IRMPD spectra for (A) the G4G5 cisplatin cross-link (3-, m/z 1286.7) and (B) the G3G4 cisplatin cross-link (3-, m/z 1286.7) of d(ATG GGT ACC CAT) (Mr of the cross-link product is 3863.2 Da). Fragment ions in red and in green contain the Pt modification. Fragment ions in black and in blue are the Pt-free fragments. Unique fragments for each adducts that allowed them to be identified are labeled in green and blue. Precursor ions are noted with an asterisk. Reprinted with permission from Reference . Copyright Springer 2014.
Figure 5
Figure 5
Backbone cleavages of peptides that produce complementary a/x, b/y and c/z ions.
Figure 6
Figure 6
(A) IRMPD (7.5 ms irradiation, q = 0.1, 50 W) and (B) CID (30 ms, q = 0.25, 8% normalized collision energy) mass spectra of [bradykinin + 3H]3+ of m/z 354.3. The precursor ion is indicated with a star (✰) and internal ions are labeled with #. The q value reflects the amplitude of the radiofrequency voltage applied to the linear ion trap, a parameter that influences the kinetic energies of the collisions during CID and at the same time defines the lower m/z range. A lower q value, which extends the lower mass range, can be used with IRMPD because it is not a collision-based activation process. Internal fragment ions are those arising from two backbone cleavages and thus contain neither the N- nor C-terminus. Reprinted with permission from reference . Copyright American Chemical Society 2009.
Figure 7
Figure 7
fs-LID mass spectrum of the singly protonated, doubly-phosphorylated peptide HEVSASpTQpSTPASSR. Sequence ions which are most informative for localization of the phosphorylation sites are labeled on the sequence insets. * = loss of 17 Da; ○ = loss of 18 Da; Ψ = loss of 30 Da; # = loss of 44 Da; Δ = loss of 98 Da. Reprinted with permission from reference . Copyright Elsevier 2010.
Figure 8
Figure 8
MS/MS spectra of DLYANTVLSGGTTMYPGIADR (2+), a tryptic peptide from b-actin found in a human HT-1080 lysate obtained by (a) UVPD using one 5 ns pulse at 193 nm, giving an Xcorr score of 6.78, and (b) CID, giving a Sequest Xcorr score of 4.44. Reprinted with permission from Reference . Copyright American Chemical Society 2010.
Figure 9
Figure 9
Formation of v and w ions upon UVPD. Reprinted with permission from reference . Copyright American Chemical Society 2010.
Figure 10
Figure 10
Photodissociation mass spectrum of protonated peptide VVVEGVNVITK* (ionized by MALDI) from a tryptic digest of ribosomal protein L24 after guanidination of the digest (where K* represents guanidinated lysine). The observation of the v3 and w3 side-chain loss ions confirm that the third residue from the C-terminus of the peptide is isoleucine, not leucine. Adapted from reference . Copyright American Chemical Society 2010.
Figure 11
Figure 11
Nomenclature for fragmentation of oligosaccharides.
Figure 12
Figure 12
MS/MS fragmentation maps of deprotonated [2Ant1SiA - H] (a two antenna glycan from feturin, m/z 1930) by CID and 193 nm UVPD with 20 pulses. Reprinted with permission from reference . Copyright American Chemical Society 2011.
Figure 13
Figure 13
Fragmentation maps of H. pylori lipid A (MW 1548.2) by (a) CID, 1-, and (b) 193 nm UVPD, 1-. Dashed lines represent cleavage sites and are matched with the m/z values to the right of each structure. Key cleavages seen for UVPD that were not observed for CID are marked with red lines. Reprinted with permission from Reference . Copyright American Chemical Society 2011.
Figure 14
Figure 14
(A) CID, (B) HCD and (C) UVPD mass spectra of the singly deprotonated bovine milk ganglioside GM3(18:1/23:0). The precursor ion is labelled with an asterisk. Fragmentation maps are shown below the series of spectra. For G, O, and T ions, the subscript X designates the total number of carbons in the hydrophobic chain and Y designates the number of unsaturated carbon–carbon bonds in the fragment ion. Reprinted with permission from Reference . Copyright American Chemical Society 2013.
Figure 15
Figure 15
LC-MS/UVPD analysis of a mitogen-activated protein kinase (MAPK) mixture; (a) base peak ion chromatogram from a separation using 10 mM piperidine spiked into LC eluents, (b) UVPD (193 nm) spectra of the p38MAPKα peptide TLFPGTDHIDQLK, 2-, and (c) UVPD (193 nm) spectra of the ERK2 peptide LKELIFEETAR, 3-. A q-value of 0.1 and an activation of one 5 ns (8 mJ) pulse were used for each 193 nm photodissociation spectrum. Neutral losses of H2O, NH3, and CO2 are denoted by °, *, and “, respectively. Reprinted with permission from Reference . Copyright Wiley 2011.
Figure 16
Figure 16
A) UVPD mass spectrum of protonated N-glycopeptide GLIQSDQELFSSPNATDTIPLVR from horseradish peroxidase in which the glycan is located at residue 14, asparagine. B) Structure of glycan and its fragmentation map. Reprinted with permission from Ref . Copyright American Chemical Society 2010.
Figure 17
Figure 17
UVPD of the doubly deprotonated glycopeptide AAS(glycan)GVE from Acinetobacter baumannii Ompa/MotB. Reprinted with permission from reference . Copyright American Chemical Society 2013.
Figure 18
Figure 18
UV photodissociation mass spectrum of Tyr-sulfated peptide NLSYNFVE. The Tyr-sulfated peptide was identified in the GluC digest of Ax21 after incubation with the sulfotransferase RaxST. The spectrum of the doubly deprotonated (2-) peptide was acquired on an Orbitrap Elite mass spectrometer equipped with an excimer laser (193 nm, 500 Hz, 5 ns pulse, 2 mJ per pulse, two pulses per spectrum). UVPD occurred in the higher-energy collisional dissociation (HCD) cell of the Orbitrap Elite mass spectrometer. Reprinted with permission from Reference . Copyright Nature Publishing Group 2012.
Figure 19
Figure 19
UVPD mass spectrum of myoglobin (22+) obtained in the HCD cell of an Orbitrap Elite mass spectrometer.
Figure 20
Figure 20
Comparison of sequence coverage obtained for five charge states of myoglobin upon ETD, CID, HCD, and UVPD in an Orbitrap Elite mass spectrometer.
Figure 21
Figure 21
Histograms illustrating the proportion of N terminal ions (a, b, and c) terminating at the first eighty (1–80) (left), middle eighty (81–160) (middle), and last 78 (161–238) (right) residues of the 25+ charge state of each GFP variant using CID, HCD, UVPD, and ETD (note that ETD was only performed on the 33+ charge state). All histograms are normalized to the same y-axis. Reprinted with permission from reference . Copyright Wiley 2014
Figure 22
Figure 22
(A) Radical-directed dissociation entails iodination of tyrosine residues in a protein which undergoes facile homolytic C-I bond cleavage upon exposure to 266 nm UV photons. CID of the resulting radical species results in dissociation at residues in close sequence proximity to the tyrosine site. (B) UVPD mass spectrum of the +10 charge state of monoiodo-ubiquitin. (C) Histogram showing the proximity of fragmentation relative to the iodinated tyrosine site averaged for several proteins. Adapted from references and . Copyright American Chemical Society 2010.
Figure 23
Figure 23
Absorption of a 266 nm photon results in selective homolytic cleavage of a disulfide-containing peptide, resulting in formation of two peptide products. Reprinted with permission from reference . Copyright American Chemical Society 2011.
Figure 24
Figure 24
A) Coupling of 7-amino-4-methyl coumarin-3-acetic acid (AMCA) succinimidyl ester to the N-terminus of a peptide. B) Comparison of sequence ions seen for the AMCA-tagged peptide TGPNLHGLFGR (2+) from a cytochrome C digest by CID and UVPD (15 pulses, 3 mJ). Note the disappearance of b ions going from the CID spectrum to the UVPD spectrum. The precursor ion is labeled with an asterisk. Reprinted with permission from reference . Copyright American Chemical Society 2013.
Figure 25
Figure 25
Results for AMCA-modified green fluorescent protein digests. For each protein, the percent sequence coverage, number of peptides identified, as well as a list of peptides which were identified by de novo sequencing for A) wild type GFP and B) GFP 6 (one of the GFP 14 variants). C) Sequence alignment for all 14 GFP variants: changes to the amino acid sequence are shown in red font and underlined. Reprinted with permission from reference . Copyright American Chemical Society 2013.
Figure 26
Figure 26
LC–MS/MS workflow based on 351 nm UVPD for the selective analysis of cysteine-containing peptides in complex mixtures. Proteins are subjected to site-specific conjugation at cysteine residues with a chromogenic Alexa Fluor 350 maleimide tag. Modified protein digests are separated by nanoLC and activated by 351 nm UVPD, which promotes selective photodissociation of Alexa Fluor 350 modified peptides. Reprinted with permission from reference . Copyright American Chemical Society 2013.
Figure 27
Figure 27
351 nm UVPD mass spectra of tryptic BSA peptides (a) HPYFYAPELLYYANK 2+ and (b) Alexa Fluor 350 conjugated DDPHACYSTVFDK 2+ following 351 nm photoirradiation with 10 pulses at 3 mJ. Reprinted with permission from reference . Copyright American Chemical Society 2013.
Figure 28
Figure 28
Structure of amine-reactive chemical probe containing a 351 nm UV chromophore. Reprinted with permission from reference . Copyright American Chemical Society 2013.
Figure 29
Figure 29
Overview of the NN chemical probe/351-nm UVPD strategy. (1) A protein is incubated with NN. NN is denoted by a purple diamond. (2) The protein is enzymatically digested. (3) The mixture of modified and unmodified peptides is analyzed by LC-MS/MS. (4a) NN-modified peptides absorb 351 nm photons, undergo selective fragmentation and are easily pinpointed by the EIC of the reporter ions. (4b) NN peptides are sequenced using their UVPD diagnostic fragmentation patterns. (5) Unmodified peptides do not absorb 351 nm photons and are sequenced by CID. Reprinted with permission from reference . Copyright American Chemical Society 2013.

References

    1. Griffiths WJ, Wang Y. Chem Soc Rev. 2009;38:1882–1896. - PubMed
    1. Yates JR, Ruse CI, Nakorchevsky A. Annu Rev Biomed Eng. 2009;11:49–79. - PubMed
    1. Benesch JL, Ruotolo BT. Curr Opin Structural Biol. 2011;21:641–649. - PMC - PubMed
    1. Robinson CV. Cold Spring Harbor Protocols. 2009 pdb prot5180. - PubMed
    1. Beglarek U, Leichtle A, Brugel M, Kortz L, Brauer R, Bresler K, Thiery J, Fiedler GM. Mol Cellularl Endocrinology. 2009;301:266–271. - PubMed

Publication types