. 2014 Mar 28;55(3):1941-53.
doi: 10.1167/iovs.13-13075.

Direct effect of sodium iodate on neurosensory retina

Affiliations

Direct effect of sodium iodate on neurosensory retina

Jinmei Wang et al. Invest Ophthalmol Vis Sci. .

Abstract

Purpose: To systematically characterize the effects of NaIO3 on retinal morphology and function.

Methods: NaIO3 at 10, 20, or 30 mg/kg was administered by retro-orbital injection into adult C57BL/6J mice. Phenotypic and functional changes of the retina were assessed at 1, 3, 5, and 8 days postinjection by fundus imaging, optical coherence tomography (OCT), ERG, and histology. Direct NaIO3 cytotoxicity on ARPE-19 and 661W cells was quantified using lactate dehydrogenase (LDH) apoptosis assay. Effect of NaIO3 on RPE and photoreceptor gene expression was assessed in vitro and in vivo by quantitative PCR.

Results: While little to no change was observed in the 10 mg/kg NaIO3-injected group, significant retinal anomalies, such as RPE atrophy and retinal thinning, were observed in both 20 and 30 mg/kg NaIO3-injected groups. Gene expression analysis showed rapid downregulation of RPE-specific genes, increase in heme oxygenase 1 expression, and induction of the ratio of Bax to Bcl-2. Electroretinographic response loss and photoreceptor gene repression preceded gross morphological changes. High NaIO3 toxicity on 661W cells was observed in vitro along with reactive oxygen species (ROS) induction. NaIO3 treatment also disrupted oxidative stress, phototransduction, and apoptosis gene expression in 661W cells. Exposure of ARPE-19 cells to NaIO3 increased expression of neurotrophins and protected photoreceptors from direct NaIO3 cytotoxicity.

Conclusions: Systematic characterization of changes associated with NaIO3 injection revealed a large variability in the severity of toxicity induced. Treatment with >20 mg/kg NaIO3 induced visual dysfunction associated with rapid suppression of phototransduction genes and induced oxidative stress in photoreceptors. These results suggest that NaIO3 can directly alter photoreceptor function and survival.

Keywords: cytotoxicity; oxidative stress; photoreceptor; retinal degeneration; sodium iodate.


Figures

Figure 1
Figure 1
Color fundus photographs of C57BL/6J mice treated with increasing doses of NaIO3. Top, middle, bottom: 10, 20, 30 mg/kg NaIO3 groups, respectively. Left to right: fundus at days 1, 3, 5, and 8, respectively. Estimated scale bar based on mouse optic nerve diameter: 220 μm.
Figure 2
Figure 2
OCT of C57BL/6J mice treated with increasing doses of NaIO3. Top, middle, bottom: 10, 20, 30 mg/kg NaIO3 groups, respectively. Left to right: days 1, 3, 5, and 8, respectively. Arrows point to hyperreflective spots in both the vitreous (green) and the retina (yellow). Red double-headed arrows mark total retinal thickness. Scale bar: 100 μm.
Figure 3
Figure 3
Hematoxylin and eosin staining of paraffin-embedded retinal cross sections of NaIO3-treated C57BL/6J mice at different time points. Top, middle, bottom: 10, 20, 30 mg/kg NaIO3-injected group, respectively. Left to right: days 1, 3, 5, and 8, respectively. Starting from day 3, swelling and bundling of the RPE cells (arrowheads) associated with macrophage migration and photoreceptor disorganization (arrows) were observed. Significant loss of RPE cells and ONL thinning were detected at days 5 and 8 (double-headed arrows). Scale bar: 100 μm.
Figure 4
Figure 4
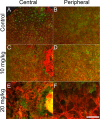
Immunofluorescence of RPE/choroid flat mounts 8 days post-NaIO3 injection. F-actin was stained with phalloidin (red) and RPE65 (green). (A, B) Saline-injected control eyes displayed normal RPE morphology with evenly distributed RPE65 expression in the central (A) and peripheral retina (B). (C, D) 10 mg/kg NaIO3-treated RPE flat mounts were indistinguishable from saline control (E, F). In 20 mg/kg NaIO3-treated animals, RPE cells appeared highly disorganized in the central retina (E). Significantly enlarged RPE cells characterized by strongly reduced RPE65 expression were observed in the peripheral retina (F). OD, optic disc. Scale bar: 100 μm.
Figure 5
Figure 5
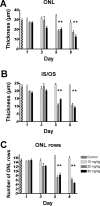
Altered outer retina thickness following NaIO3 administration. Outer nuclear layer ([A], ONL), photoreceptor inner and outer segment layer thicknesses ([B], IS/OS), and ONL nuclei/row numbers (C) were quantified on histological sections. Asterisks indicate the statistically significant deviation of thickness from the control. **P < 0.01.
Figure 6
Figure 6
Longitudinal analysis of visual function of mice treated with NaIO3. (A) Scotopic a-wave recorded at 500 cd*s/m2. (B) Scotopic b-wave recorded at 0.1076 cd*s/m2. (C) Saturating photopic b-wave recorded at 103 cd*s/m2. Significant reduction of all ERG responses was observed at day 1 in both the 20 and 30 mg/kg NaIO3 groups. Both a- and b-waves continued to decrease over time, and by day 8, all ERG responses were abolished. No functional change was detected for the 10 mg/kg NaIO3 group at any time point. At day 1, a significant reduction of the ratio of b to a amplitude (D) and increase of the a-wave implicit time (E) in animals treated with 20 and 30 mg/kg NaIO3 were also observed. The results are presented as mean ± SEM. ‡,¶ or *P < 0.05, ‡‡,¶¶ or **P < 0.01, ‡‡‡,¶¶¶ or ***P < 0.001.
Figure 7
Figure 7
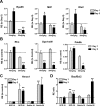
Gene expression changes in mouse RPE and neuroretina following NaIO3 treatment. RPE cells and neuroretina were isolated from mice treated with 10 or 20 mg/kg NaIO3 for 1 or 3 days. (A) Expression of Rpe65, Mitf, and Otx2 from mouse RPE cells. (B) Expression of phototransduction-related genes from mouse neuroretinas. (C, D) Expression of Hmox1 (C) and the apoptosis marker ratio of Bax to Bcl2 (D) in mouse RPE cells and neuroretinas, at days 1 and 3, respectively. The results are presented as mean ± SEM. *P < 0.05, **P < 0.01, ***P < 0.001. RE, relative expression.
Figure 8
Figure 8
Effect of NaIO3 on 661W cells in vitro. (A) 661W cell death secondary to NaIO3 treatment was quantified by assessing LDH activity in serum-containing and serum-free culture media. NaIO3 toxicity appears strongly dependent on serum level, as serum-free media condition elicited a much higher LDH release. (B) 24-hour treatment of 661W cells with 250 μg/mL NaIO3 in a serum-free condition was also associated with increased ROS production. (C, D) Gene expression analysis on 661W cells treated with 250 μg/mL NaIO3 showed upregulation of oxidative stress (C) and downregulation of phototransduction-related genes (D). (E) Expression ratio of Bax to Bcl2 was strongly induced by NaIO3 treatment. The results are presented as mean ± SEM. *P < 0.05, **P < 0.01, ***P < 0.001 compared to controls. RE, relative expression.
Figure 9
Figure 9
Effect of NaIO3 on RPE cell neurotrophic function. (A) ARPE-19 cells are resistant to direct NaIO3 cytotoxicity, as only concentrations over 750 μg/mL are associated with increased cell death. (B) Conditioned medium was transferred from either control ARPE-19 cells or 24-hour 250 μg/mL NaIO3-treated ARPE-19 cells onto 661W cells for 24-hour culture, and comparison was made between 661W cells cultured with regular serum-free medium, medium with NaIO3, and conditioned medium from either ARPE-19 cells or NaIO3-treated ARPE-19 cells. CM, conditioned media collected from 24-hour ARPE-19 culture; CM+NaIO3, conditioned media collected from 24-hour ARPE-19 culture treated with 250 μg/mL NaIO3. (C) Expression of neurotrophic factors was significantly upregulated in ARPE-19 cells after 250 μg/mL NaIO3 treatment at 24 hours. Asterisks indicate the statistically significant deviation of amplitude from the control. The results are presented as mean ± SEM. *P < 0.05, **P < 0.01, ***P < 0.001. RE, relative expression.

References

    1. Samardzija M, Neuhauss SCF, Joly S, Kurz-Levin M, Grimm C. Animal models for retinal degeneration. In: Animal Models for Retinal Diseases. Totowa, NJ: Humana Press; 2009. Neuromethods; vol 46: 51–79
    1. Zeiss CJ. Animals as models of age-related macular degeneration: an imperfect measure of the truth. Vet Pathol. 2010; 47: 396–413 - PubMed
    1. Webster SH, Rice ME, Highman B, Von Oettingen WF. The toxicology of potassium and sodium iodates: acute toxicity in mice. J Pharmacol Exp Ther. 1957; 120: 171–178 - PubMed
    1. Enzmann V, Row BW, Yamauchi Y, et al. Behavioral and anatomical abnormalities in a sodium iodate-induced model of retinal pigment epithelium degeneration. Exp Eye Res. 2006; 82: 441–448 - PubMed
    1. Mizota A, Adachi-Usami E. Functional recovery of retina after sodium iodate injection in mice. Vision Res. 1997; 37: 1859–1865 - PubMed

Publication types