. 2014 Jan;6(1):48-57.
doi: 10.18632/aging.100633.

BMAL1-dependent regulation of the mTOR signaling pathway delays aging

Affiliations

BMAL1-dependent regulation of the mTOR signaling pathway delays aging

Rohini V Khapre et al. Aging (Albany NY). 2014 Jan.

Abstract

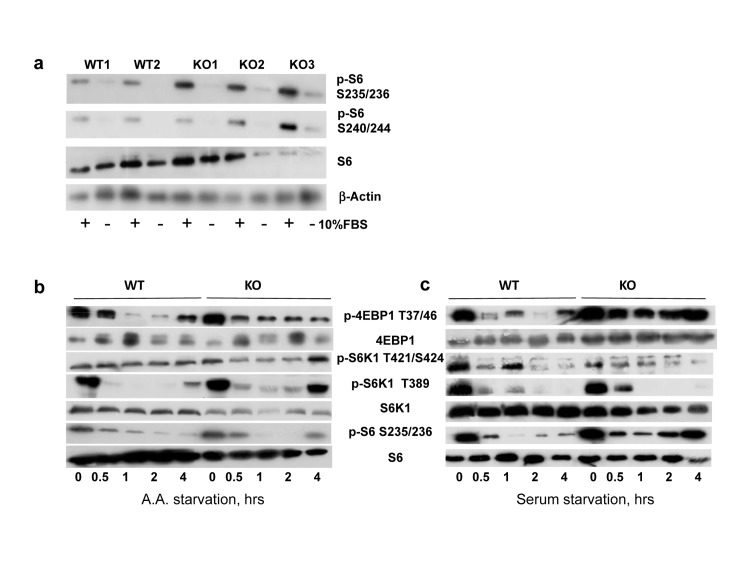
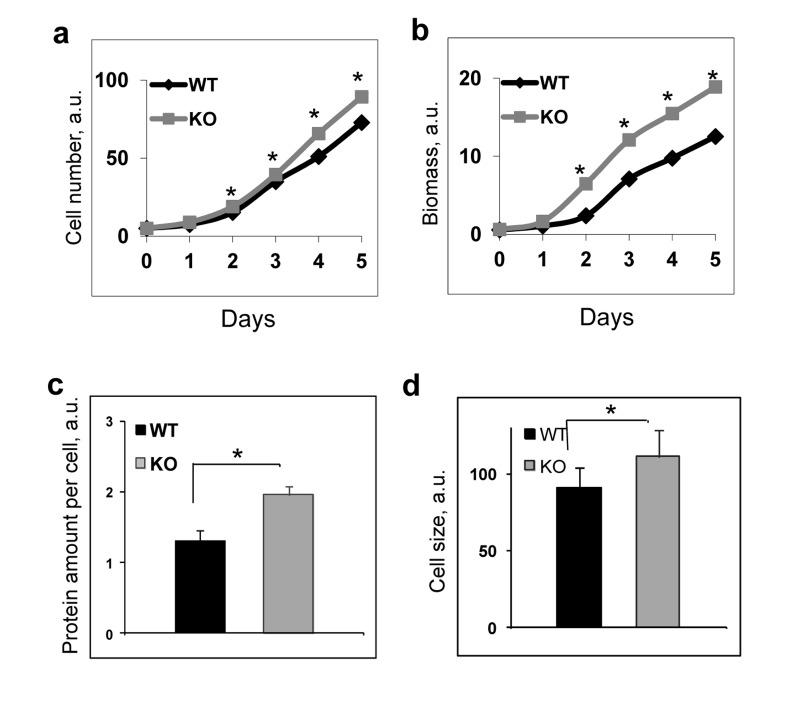
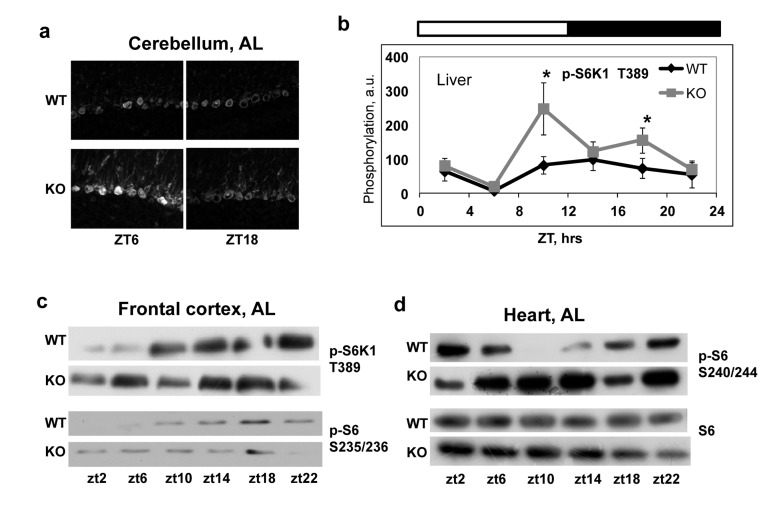
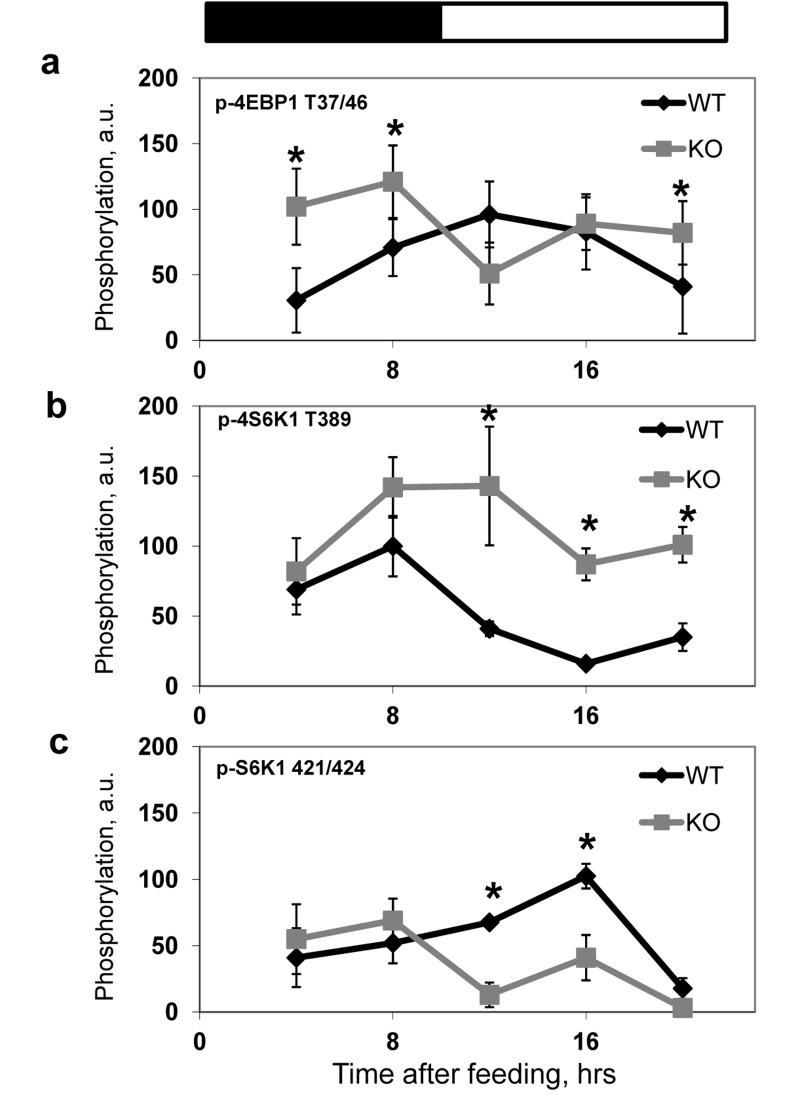
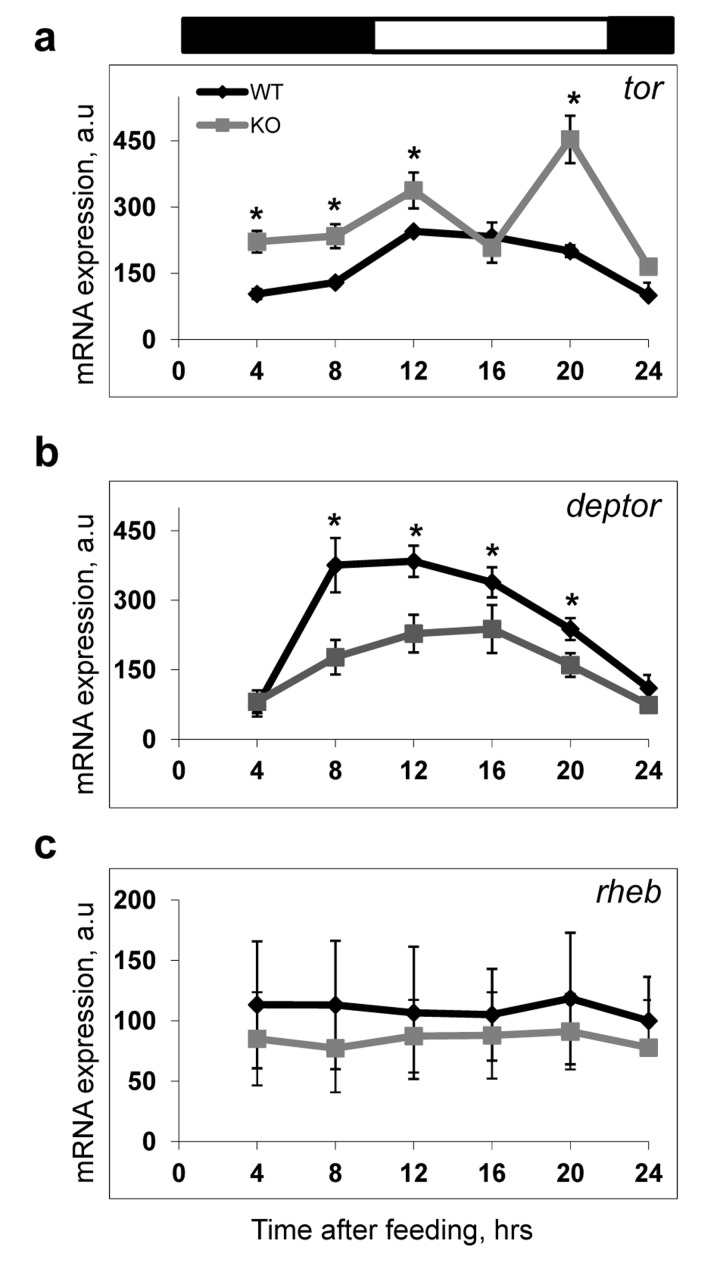
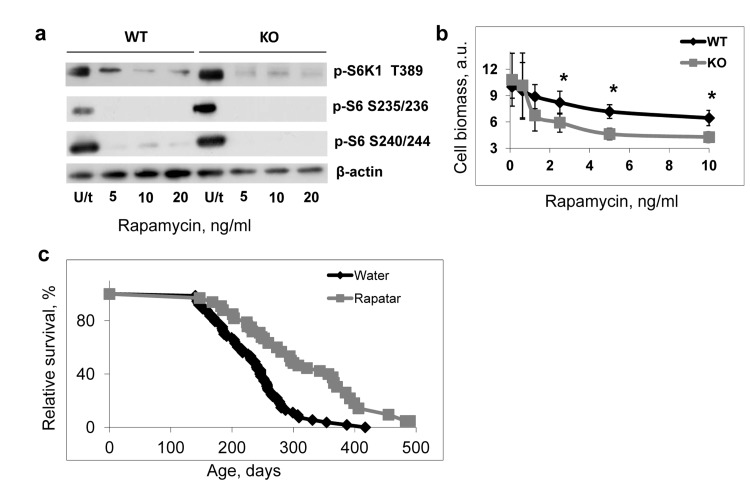
The circadian clock, an internal time-keeping system, has been linked with control of aging, but molecular mechanisms of regulation are not known. BMAL1 is a transcriptional factor and core component of the circadian clock; BMAL1 deficiency is associated with premature aging and reduced lifespan. Here we report that activity of mammalian Target of Rapamycin Complex 1 (mTORC1) is increased upon BMAL1 deficiency both in vivo and in cell culture. Increased mTOR signaling is associated with accelerated aging; in accordance with that, treatment with the mTORC1 inhibitor rapamycin increased lifespan of Bmal1-/- mice by 50%. Our data suggest that BMAL1 is a negative regulator of mTORC1 signaling. We propose that the circadian clock controls the activity of the mTOR pathway through BMAL1-dependent mechanisms and this regulation is important for control of aging and metabolism.


Conflict of interest statement

The authors of this paper declare no conflict of interests.

Figures

Figure 1
Figure 1. BMAL1 is negative regulator of TORC1 activity in cells
(a) Phosphorylation and total protein level of ribosomal S6 protein in primary lung fibroblasts isolated from wild type and Bmal1−/− mice. Protein phosphorylation in cellular extracts were assayed by western blotting procedure with antibodies recognizing the indicated proteins or protein modifications WT1, WT2, KO1, KO2 and KO3 represent independently isolated populations fibroblasts isolated from wild type (WT) and Bmal1−/− (KO) mice. Cells were incubated in DMEM with 10% FBS (+) or serum deprived for 24 hrs (−). (b) and (c) Wild type (WT) and Bmal1−/− (KO) fibroblasts were subject to amino acids (b) or serum (c) withdrawal for indicated period of time. Kinetics of changes in phosphorylation of mTORC1 downstream targets are shown on the representative western blotting.
Figure 2
Figure 2. BMAL1 deficiency increases cell growth and proliferation
To assay proliferation wild type and Bmal1−/− cells were plated at equal density on day 0, every 24 hrs cells were collected and counted (cell number), in parallel set of experiments the plates were stained with crystal violet reagent and biomass accumulation was estimated based on the amount of extracted dye. Results represent average for 4 plates for every time point for both genotypes. Experiments were repeated three times independently with similar results. (a) and (b) Proliferations of wild type (black diamonds) and Bmal1−/− (grey squares) fibroblasts in cell culture were assayed by counting cell number (a) or by measuring biomass accumulation (b). (c) Protein amount per cell for wild type (black bar) and Bmal1−/− (grey bar) fibroblasts. (d) Cell size for wild type (black bar) and Bmal1−/− (grey bars) fibroblasts were assayed by using FACSalibor cell sorter (Becton-Dikinson) and appropriate software.
Figure 3
Figure 3. Increased mTORC1 signaling in tissues of Bmal1−/− mice
Activity of TORC1 was compared in the different tissues of wild type and Bmal1−/− mice. Protein phosphorylation in tissue extracts were analyzed by western blotting procedure with antibodies recognizing the indicated proteins or protein modifications or by in situ staining on 10μM frozen tissue sections. (a) In situ staining of cerebellum for p-S6 S235/236. (b) Phosphorylation of S6K1(T389) in the liver through the circadian cycle (wild type (black diamonds) and Bmal1−/− (grey squares)). (c) and (d) Representative WB of mTORC1 downstream targets phosphorylation in the frontal cortex (c) and in the heart (d). Bars on the top of the figure represent light (open bars) and dark (black bars) parts of the day. Zt is an abbreviation for Zeitgeber Time, zt0 is the time when light is on, the time when light is off is zt12, thus, for example zt2 represents 2hrs after light is on. * - statistically significant difference between the genotypes
Figure 4
Figure 4. BMAL1 deficiency results in increased mTORC1 signaling in the liver of TRF mice
Phosphorylation and expression of TORC1 downstream targets were analyzed by western blotting, image analyzing software was used to quantify the intensity of bands. For every experiment the value of maximum intensity of the band for wild type mice was set as 100, the intensity of bands for other time points and for Bmal1−/− mice was normalized accordingly. Results represent average for 4 animals of each genotype for each time point. (a-c) Quantitative profiles of TORC1 downstream targets phosphorylation in the liver of wild type (black diamonds) and Bmal1−/− (grey squares) TRF mice. (a) 4E-BP1 T37/46 phosphorylation. (b) S6K1 T389 phosphorylation; (c) S6K1 T421/424 phosphorylation. * - statistically significant difference between the genotypes. Food was provided at time point 0. Bars on the top of the figure represent light (open bars) and dark (black bars) parts of the day.
Figure 5
Figure 5. Expression of mtor and deptor is deregulated in the liver of Bmal1−/− mice
The expressions of several components of TORC1 and upstream regulator of TORC1 in the liver of wild type and Bmal1−/− mice were analyzed across the daily cycle on mRNAs level by real-time RT PCR. All expression data were normalized to 18S ribosomal RNA expression. (a-c) Expression of mRNAs for tor (a), deptor (b), rheb (c) in the liver of TRF WT (black diamonds) or Bmal1−/− (grey squares) mice. Results represent average for 4 animals of each genotype for each time point.* - statistically significant difference between the genotypes. Bars on the top of the figure represent light (open bars) and dark (black bars) parts of the day.
Figure 6
Figure 6. Deregulated mTOR signaling contributes to accelerated aging of Bmal1−/− mice
(a) Treatment with rapamycin suppresses TORC1 activity in both wild type and Bmal1−/− (KO) cells. Cells were treated with indicated concentrations of rapamycin for 4 hrs, protein phosphorylation in cellular extracts were analyzed by western blotting procedure with antibodies recognizing the indicated proteins or protein modifications. U/t untreated cells. (b) Effect of rapamycin treatment on proliferation of wild type (black diamonds) and Bmal1−/− (KO) (grey squares) cells. Cells were grown for 72 hrs in regular growth media with indicated concentrations of rapamycin. Cell biomass was assayed by crystal violet incorporation. Data represent average and standard deviations for 4 replicates. The experiment was repeated 3 times with similar results. a.u. – arbitrary units. * - statistically significant difference between genotypes. (c) Kaplan-Meyer survival curves of Bmal1−/− mice treated with water (N = 73) or Rapatar in drinking water (N = 31). The difference between the survival curves is statistically significant according to logrank test.

References

    1. Sengupta S, Peterson TR, Sabatini DM. Regulation of the mTOR complex 1 pathway by nutrients, growth factors, and stress. Mol Cell. 2010;40:310–322. - PMC - PubMed
    1. Hay N, Sonenberg N. Upstream and downstream of mTOR. Genes Dev. 2004;18:1926–1945. - PubMed
    1. Kaeberlein M. Lessons on longevity from budding yeast. Nature. 2010;464:513–519. - PMC - PubMed
    1. Blagosklonny MV. Revisiting the antagonistic pleiotropy theory of aging: TOR-driven program and quasi-program. Cell Cycle. 2010;9:3151–3156. - PubMed
    1. Laplante M, Sabatini DM. mTOR signaling in growth control and disease. Cell. 2012;149:274–293. - PMC - PubMed

Publication types

MeSH terms