. 2014 Jan 30;5(2):338-50.
doi: 10.18632/oncotarget.1495.

Pharmacokinetic modeling optimizes inhibition of the 'undruggable' EWS-FLI1 transcription factor in Ewing Sarcoma

Affiliations

Pharmacokinetic modeling optimizes inhibition of the 'undruggable' EWS-FLI1 transcription factor in Ewing Sarcoma

Sung-Hyeok Hong et al. Oncotarget. .

Abstract

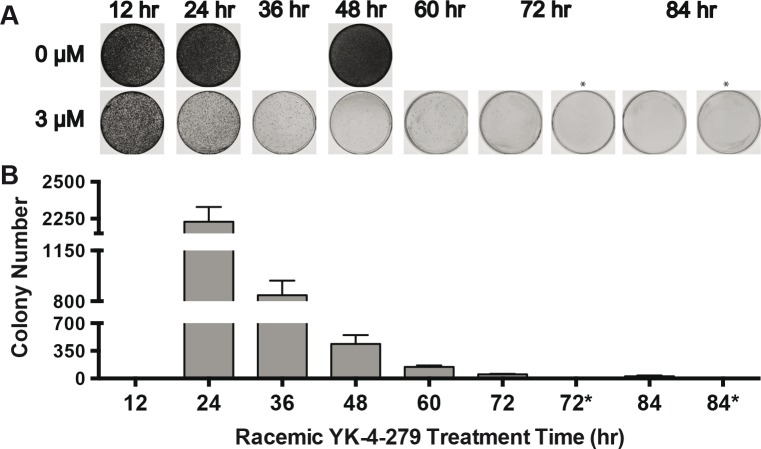
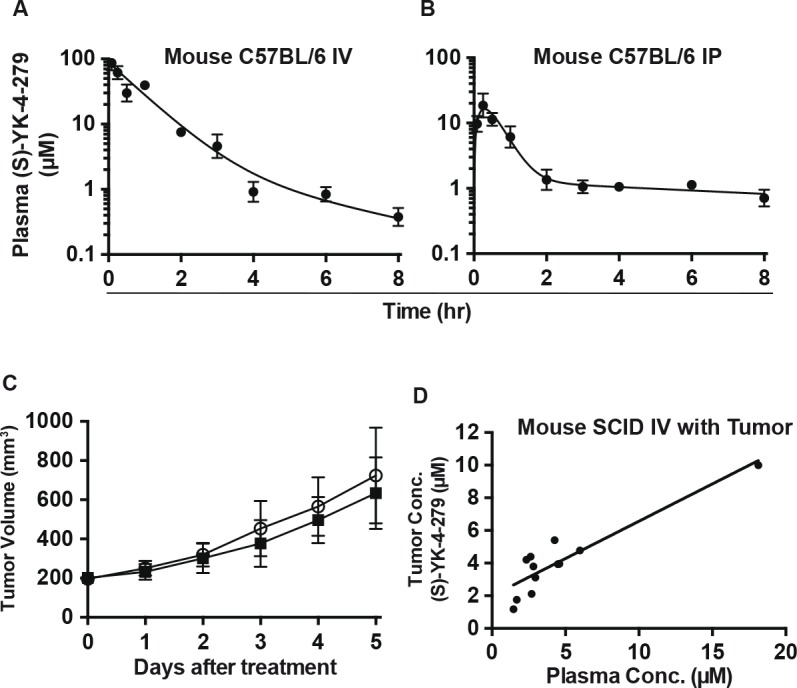
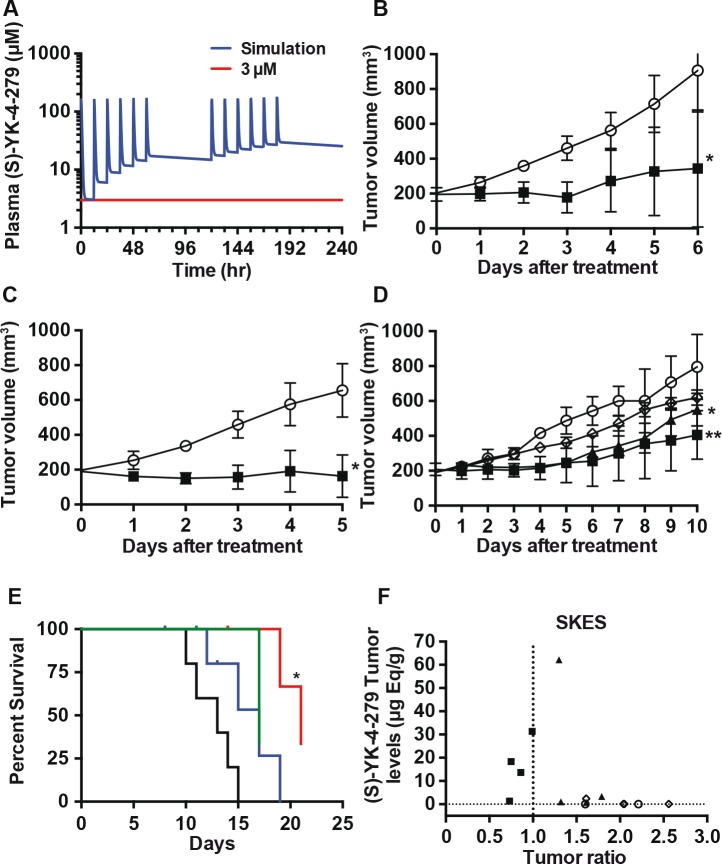
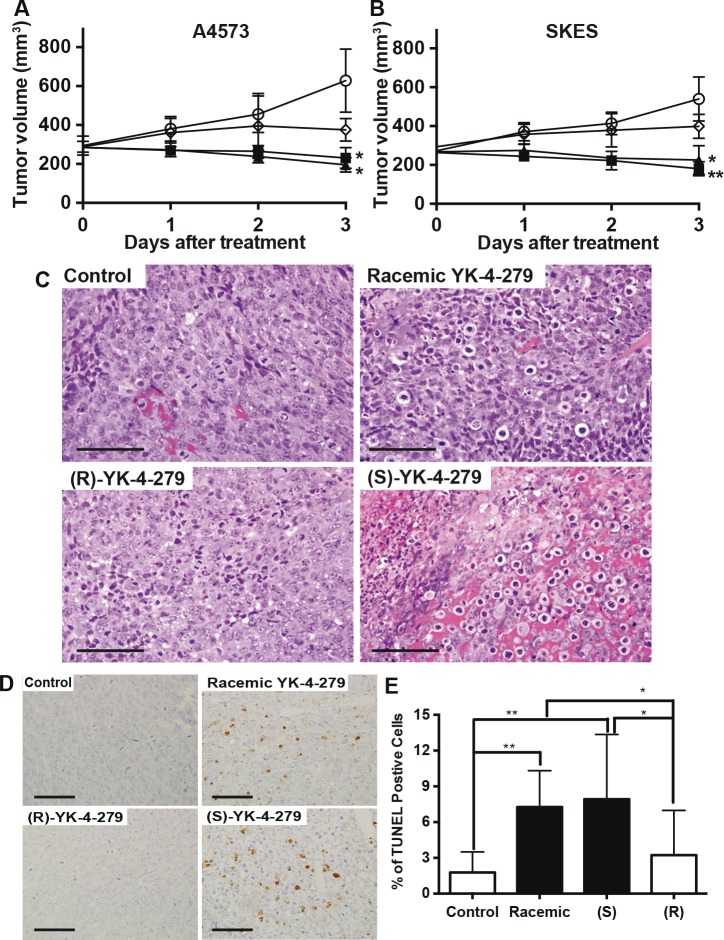
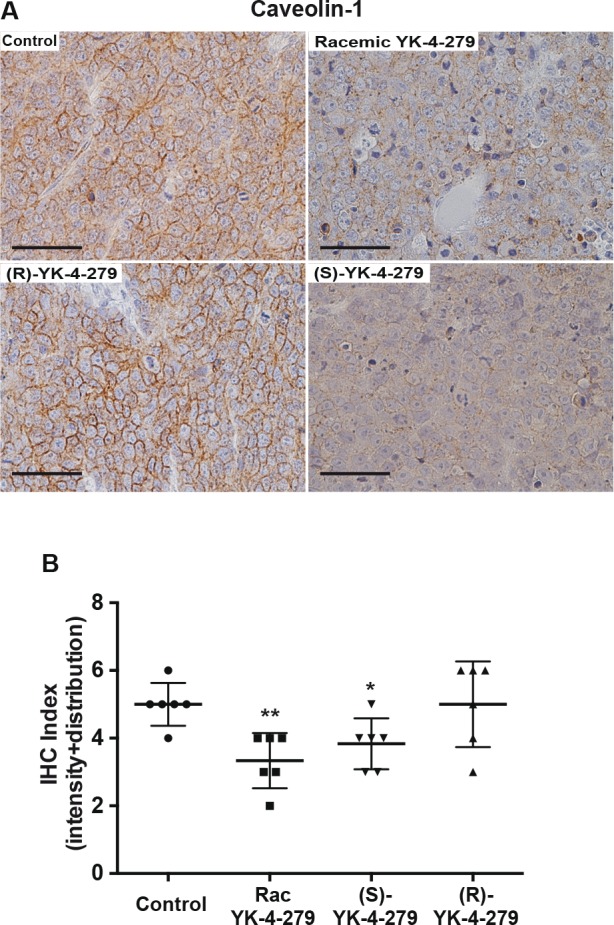
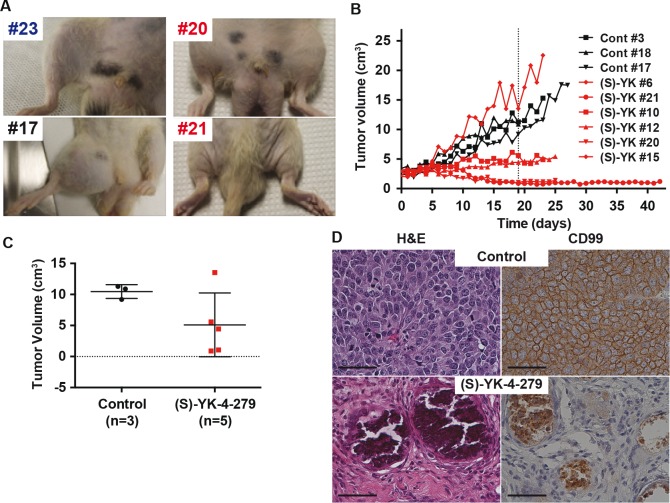
Transcription factors have long been deemed 'undruggable' targets for therapeutics. Enhanced recognition of protein biochemistry as well as the need to have more targeted approaches to treat cancer has rendered transcription factors approachable for therapeutic development. Since transcription factors lack enzymatic domains, the specific targeting of these proteins has unique challenges. One challenge is the hydrophobic microenvironment that affects small molecules gaining access to block protein interactions. The most attractive transcription factors to target are those formed from tumor specific chromosomal translocations that are validated oncogenic driver proteins. EWS-FLI1 is a fusion protein that results from the pathognomonic translocation of Ewing sarcoma (ES). Our past work created the small molecule YK-4-279 that blocks EWS-FLI1 from interacting with RNA Helicase A (RHA). To fulfill long-standing promise in the field by creating a clinically useful drug, steps are required to allow for in vivo administration. These investigations identify the need for continuous presence of the small molecule protein-protein inhibitor for a period of days. We describe the pharmacokinetics of YK-4-279 and its individual enantiomers. In vivo studies confirm prior in vitro experiments showing (S)-YK-4-279 as the EWS-FLI1 specific enantiomer demonstrating both induction of apoptosis and reduction of EWS-FLI1 regulated caveolin-1 protein. We have created the first rat xenograft model of ES, treated with (S)-YK-4-279 dosing based upon PK modeling leading to a sustained complete response in 2 of 6 ES tumors. Combining laboratory studies, pharmacokinetic measurements, and modeling has allowed us to create a paradigm that can be optimized for in vivo systems using both in vitro data and pharmacokinetic simulations. Thus, (S)-YK-4-279 as a small molecule drug is ready for continued development towards a first-in-human, first-in-class, clinical trial.


Figures

Figure 1
Figure 1. Exposure time to YK-4-279 is a critical variable to eliminate ES clonogenicity
(A) A4573 cells were replated following timed exposure to 3 ¼M YK-4-279 as indicated (B) Colonies were counted using Nikon NIS Elements BR software. (* Denotes those plates which received 3 ¼M YK-4-279 treatment following replating.). This study was performed in triplicate and repeated two times.
Figure 2
Figure 2. Pharmacokinetics of YK-4-279 in mouse models
(A) Time course of (S)- YK-4-279 concentrations in male C57BL/6 mouse plasma following IV and (B) IP administration of 75 mg/kg racemic YK-4-279. (C) Six IV injections of 75 mg/kg/injection (S)-YK-4-279 for 5 Days did not show tumor regression in SCID mice (○ Control and ■ (S)-YK-4-279. (D) Plasma (S)-YK-4-279 levels correlate with xenograft tumor levels in SCID mice (R2=0.82543).
Figure 3
Figure 3. Inhibition of ES xenografts by YK-4-279 informed by pharmacokinetic dosing models
(A) Plasma concentrations of (S)-YK-4-279 were simulated for a dosing regimen of BID IP injections of YK-4-279 (375 mg/kg) for 3 days followed by 2 days of no therapy. This cycle was repeated for another 5-day period, in order to maintain plasma concentrations of (S)-YK-4-279 greater than 3 ¼M. (B) A4573, (* p=0.04) or (C) SK-ES xenograft tumors were treated BID with IP injections of 400 mg/kg racemic YK-4-279 when tumors reached 200 mm3 (O Control and ■ racemic YK-4-279) (* p=0.02). (D) Mice with xenograft SK-ES tumors were treated BID with IP injections of 400 mg/kg racemic-, (S)-, or (R)-YK-4-279 over a 10-day period after tumors reached 200 mm3 (○ Control, ■ racemic YK-4-279, ▲ (S)-YK-4-279 and ◊ (R)-YK-4-279). ** Control vs. racemic, p=0.003, * control vs. (S)-yk-4-279 p=0.02. (E) Racemic YK-4-279 (red) treated SK-ES xenograft mice show survival benefit compared to those of control (black), (S)-YK-4-279 (green), and (R)-YK-4-279 (blue) treated mice. * Control vs. racemic p=0.013. (F) (S)-YK-4-279 xenograft tumor (SK-ES) tissue levels of racemic YK-4-279 treated mice showed higher (S)-YK-4-279 concentration than those of control, (S)-YK-4-279, (R)-YK-4-279 (◀ Control, ■ racemic YK-4-279, ▲(S)-YK-4-279 and ◊ (R)-YK-4-279).
Figure 4
Figure 4. Racemic and (S)-YK-4-279 causes ES tqumor regression via apoptosis
Mice with xenograft (A) A4573, * control vs. racemic p=0.008, * control vs. (S)-YK-4-279 p=0.005, and (B) SK-ES tumors were treated for 3 days BID with IP injections of vehicle control, racemic, (S)-, or (R)-YK-4-279 when tumors reached 200 mm3. ** Control vs. racemic p=0.003, * control vs. (S)-YK-4-279 p=0.006 (○ Control, ■ racemic YK-4-279, ▲ (S)-YK-4-279 and ◊ (R)-YK-4-279). (C) Examples of H&E staining from animals treated in (A). Scale bar = 50 ¼m. (D) TUNEL staining from animals treated in (A). Scale bar = 50 ¼m. (E) Quantifcation of TUNEL positive cells out of 500 counted on each slide from each tumor, ** control vs. racemic p=0.004, ** control vs. (S)-YK-4-279 p=0.002, * (R)-YK-4-279 vs. racemic p=0.03, * (R)-YK-4-279 vs. (S)-YK-4-279 p=0.01.
Figure 5
Figure 5. EWS-FLI1 target caveolin-1 expression reduced by racemic and (S)-YK-4-279 treated tumors
(A) Representative examples of caveolin-1 IHC staining from animals treated in Figure 4. Scale bar = 50 ¼m. (B) Pathologist quantification of cavelolin-1 IHC in two blinded scoring sessions evaluating staining intensity and distribution, 0 – 3. The sum is reported in this graph, ** control vs. racemic p=0.004, * control vs. (S)-YK-4-279 p=0.04.
Figure 6
Figure 6. Rat orthotopic xenograft shows complete tumor regression with continuous infusion of (S)-YK-4-279
(A) Images of tumors at endpoint of study (blue: normal rats, black: control treated rats, red: (S)-YK-4-279 treated rats). (B) ES1 xenograft tumors were treated with continuous IV infusion of either control or 72 mg/kg/day (S)-YK-4-279 for 8 of 9 days per cycle (S)-YK-4-279 when tumors reached 2.5 cm3 in rats (Control: black and (S)-YK-4-279: red). (C) H&E and CD99 staining of rat xenograft with continuous IV treatment with control or 72 mg/kg (S)-YK-4-279 for 8 of 9 days per cycle. Scale bar = 50 ¼m. (D) Tumor volume on day 19 from start of treatment, control vs (S)-YK-4-279 p=0.08.

References

    1. Linabery AM, Ross JA. Childhood and adolescent cancer survival in the US by race and ethnicity for the diagnostic period 1975-1999. Cancer. 2008;113(9):2575–2596. - PMC - PubMed
    1. Bernstein ML, Devidas M, Lafreniere D, Souid AK, Meyers PA, Gebhardt M, Stine K, Nicholas R, Perlman EJ, Dubowy R, Wainer IW, Dickman PS, Link MP, Goorin A, Grier HE. Intensive therapy with growth factor support for patients with Ewing tumor metastatic at diagnosis: Pediatric Oncology Group/Children's Cancer Group Phase II Study 9457--a report from the Children's Oncology Group. J Clin Oncol. 2006;24(1):152–159. - PubMed
    1. Grier HE, Krailo MD, Tarbell NJ, Link MP, Fryer CJ, Pritchard DJ, Gebhardt MC, Dickman PS, Perlman EJ, Meyers PA, Donaldson SS, Moore S, Rausen AR, Vietti TJ, Miser JS. Addition of ifosfamide and etoposide to standard chemotherapy for Ewing's sarcoma and primitive neuroectodermal tumor of bone. N Engl J Med. 2003;348(8):694–701. - PubMed
    1. Womer RB, West DC, Krailo MD, Dickman PS, Pawel BR, Grier HE, Marcus K, Sailer S, Healey JH, Dormans JP, Weiss AR. Randomized controlled trial of interval-compressed chemotherapy for the treatment of localized Ewing sarcoma: a report from the Children's Oncology Group. J Clin Oncol. 2012;30(33):4148–4154. - PMC - PubMed
    1. Delattre O, Zucman J, Melot T, Garau XS, Zucker JM, Lenoir GM, Ambros PF, Sheer D, Turc-Carel C, Triche TJ, et al. The Ewing family of tumors--a subgroup of small-round-cell tumors defned by specific chimeric transcripts. N Engl J Med. 1994;331(5):294–299. - PubMed

Publication types

MeSH terms