. 2014 May;94(5):531-43.
doi: 10.1007/s00223-014-9838-7. Epub 2014 Jan 31.

1,25(OH)₂D₃ induces a mineralization defect and loss of bone mineral density in genetic hypercalciuric stone-forming rats

Affiliations

1,25(OH)₂D₃ induces a mineralization defect and loss of bone mineral density in genetic hypercalciuric stone-forming rats

Adeline H Ng et al. Calcif Tissue Int. 2014 May.

Abstract

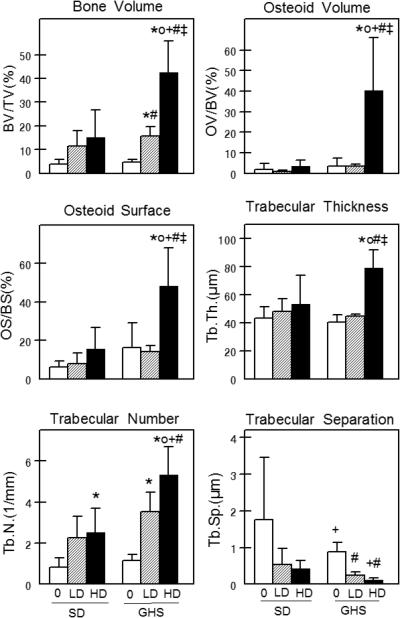
Genetic hypercalciuric stone-forming (GHS) rats, bred to maximize urine (u) calcium (Ca) excretion, demonstrate increased intestinal Ca absorption, increased bone Ca resorption, and reduced renal Ca reabsorption, all leading to elevated uCa compared to the parental Sprague-Dawley (SD) rats. GHS rats have increased numbers of vitamin D receptors (VDRs) at each site, with normal levels of 1,25(OH)₂D₃ (1,25D), suggesting their VDR is undersaturated with 1,25D. We have shown that 1,25D induces a greater increase in uCa in GHS than SD rats. To examine the effect of the increased VDR on the osseous response to 1,25D, we fed GHS and SD rats an ample Ca diet and injected either 1,25D [low dose (LD) 12.5 or high dose (HD) 25 ng/100 g body weight/day] or vehicle (veh) daily for 16 days. Femoral areal bone mineral density (aBMD, by DEXA) was decreased in GHS+LD and GHS+HD relative to GHS+veh, while there was no effect on SD. Vertebral aBMD was lower in GHS compared to SD and further decreased in GHS+HD. Both femoral and L6 vertebral volumetric BMD (by μCT) were lower in GHS and further reduced by HD. Histomorphometry indicated a decreased osteoclast number in GHS+HD compared to GHS+veh or SD+HD. In tibiae, GHS+HD trabecular thickness and number increased, with a 12-fold increase in osteoid volume but only a threefold increase in bone volume. Bone formation rate was decreased in GHS+HD relative to GHS+veh, confirming the mineralization defect. The loss of BMD and the mineralization defect in GHS rats contribute to increased hypercalciuria; if these effects persist, they would result in decreased bone strength, making these bones more fracture-prone. The enhanced effect of 1,25D in GHS rats indicates that the increased VDRs are biologically active.


Figures

Figure 1
Figure 1. Serum parameters
Blood was collected at the end of the study and analyzed for sCa, sP, sPTH or sOCN as described in Methods. Values are for SD and GHS vehicle treated rats (open bars), rats injected with LD (hatched bars) and HD (solid bars). Results are mean ± standard error for 4-8 rats in each group. * p<0.05 compared to SD+veh; ○ p<0.05 compared to SD+LD; + p<0.05 compared to SD+HD; # p<0.05 compared to GHS+veh; ‡ p<0.05 compared to GHS+LD.
Figure 2
Figure 2. Urine Ca
Urine was collected on days 9 and 11 of the study and the mean uCa determined for each rat. Results are mean ± standard error for 4-8 rats in each group. * p<0.05 compared to SD+veh; ○ p<0.05 compared to SD+LD; + p<0.05 compared to SD+HD; # p<0.05 compared to GHS+veh; ‡ p<0.05 compared to GHS+LD.
Figure 3
Figure 3. Bone mineral density of femora, vertebrae and humeri
Areal bone mineral density (aBMD) was determined by DEXA and volumetric bone mineral density (vBMD) was determined by μCT on indicated bone types. Trabecular tissue vBMD refers to trabecular bone plus marrow space of vertebrae. All data are presented as mean ± standard deviation. * p<0.05 compared to SD+veh; ○ p<0.05 compared to SD+LD; + p<0.05 compared to SD+HD; # p<0.05 compared to GHS+veh; ‡ p<0.05 compared to GHS+LD.
Figure 4
Figure 4. Effect of 1,25D on mineralized bone compared to unmineralized osteoid in SD and GHS rats
Sagittal sections of undecalcified rat tibia stained with Goldner's Trichrome at 100x (upper panel in each group) and 250x magnification (lower panel for each group) to differentiate between mineralized bone (blue-green) and unmineralized osteoid (red). Results are quantitated in Figure 5.
Figure 5
Figure 5. Trabecular bone structure
Static histomorphometry was performed on proximal left tibiae from SD and GHS rats. % bone volume, % osteoid volume, % osteoid surface, trabecular thickness, trabecular number and trabecular separation were determined. All data are presented as mean ± standard deviation. * p<0.05 compared to SD+veh; ○ p<0.05 compared to SD+LD; + p<0.05 compared to SD+HD; # p<0.05 compared to GHS+veh; ‡ p< 0.05 compared to GHS+LD.
Figure 6
Figure 6. Effect of 1,25D on dynamic histomorphometry in SD and GHS rats
All rats were injected with calcein at 10 and 2 d before sacrifice. A) Sagittal sections of undecalcified rat tibia under UV light at 100x (upper panel in each group) and 250x (lower panel in each group). B) Bone formation rate was calculated over the 8 d period using double calcein labels that fluoresce green under UV light. C) Mineralization lag time (MLT) was calculated as osteoid maturation time (OMT, osteoid width divided by the distance between labels per day) adjusted for the percentage of osteoid surface that has a calcein label. All data are presented as mean ± standard deviation. * p<0.05 compared to SD+veh; ○ p<0.05 compared to SD+LD; + p<0.05 compared to SD+HD; # p<0.05 compared to GHS+veh; ‡ p< 0.05 compared to GHS+LD.
Figure 7
Figure 7. Effect of 1,25D on osteoclast numbers in SD and GHS rats
A) Sagittal sections of decalcified rat tibia were stained for tartrate-resistant acid phosphatase (TRAP) and counterstained with hematoxylin at 100x (upper panel in each group) and 250x (lower panel in each group). B) TRAP-positive osteoclasts are stained red and were used to evaluate bone resorption. Osteoclast parameters measured were % osteoclast surface, osteoclast number/bone surface and number of osteoclasts/osteoclast surface, as indicated. All data are presented as mean ± standard deviation. * p<0.05 compared to SD+veh; ○ p<0.05 compared to SD+LD; + p<0.05 compared to SD+HD; # p<0.05 compared to GHS+veh; ‡ p< 0.05 compared to GHS+LD.

References

    1. Bushinsky DA, Coe FL, Moe OW. Nephrolithiasis. In: Brenner BM, editor. The Kidney. W.B. Saunders; Philadelphia: 2012. pp. 1455–1507.
    1. Moe OW, Bonny O. Genetic Hypercalciuria. Journal of the American Society of Nephrology. 2005;16:729–745. - PubMed
    1. Stechman MJ, Loh NY, Thakker RV. Genetics of hypercalciuric nephrolithiasis: renal stone disease. Ann NY Acad Sci. 2007;1116:461–484. - PubMed
    1. Monico CG, Milliner DS. Genetic determinants of urolithiasis. Nat Rev Nephrol. 2012;8:151–162. - PMC - PubMed
    1. Bushinsky DA, Asplin JR, Grynpas MD, Evan AP, Parker WR, Alexander KM, Coe FL. Calcium oxalate stone formation in genetic hypercalciuric stone-forming rats. Kidney Int. 2002;61:975–987. - PubMed

Publication types