

A generalized genetic random field method for the genetic association analysis of sequencing data
- PMID: 24482034
- PMCID: PMC5241166
- DOI: 10.1002/gepi.21790
A generalized genetic random field method for the genetic association analysis of sequencing data
Abstract
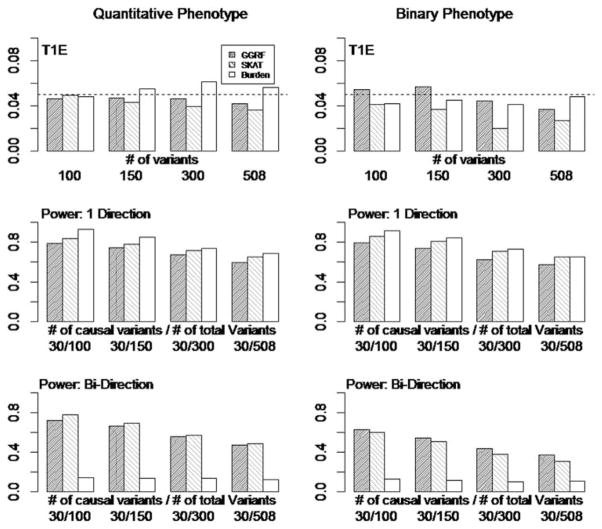
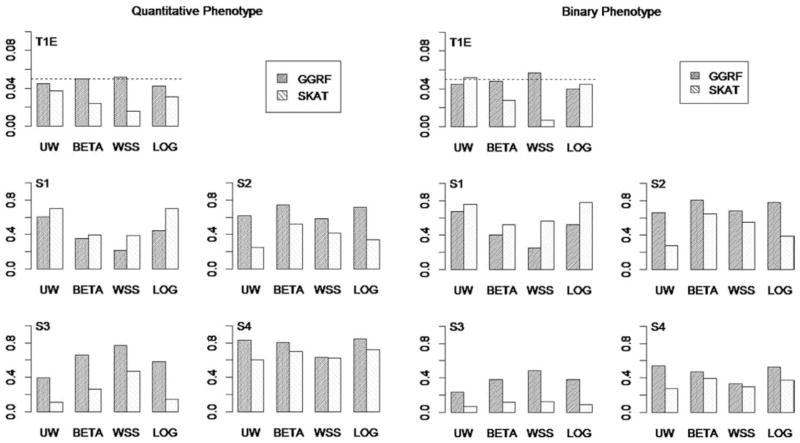
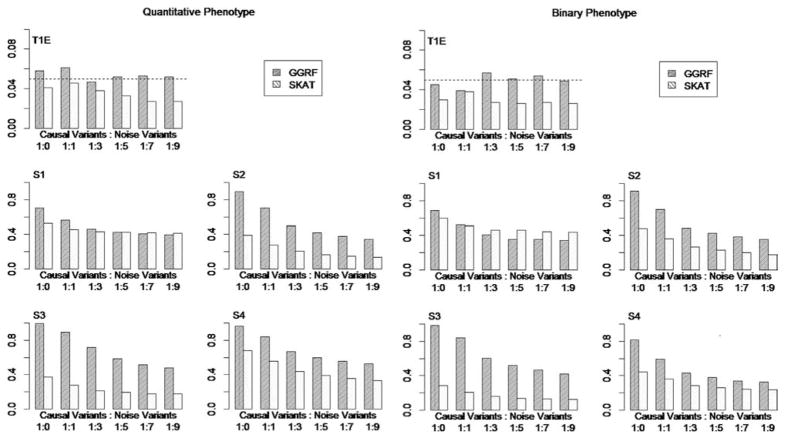
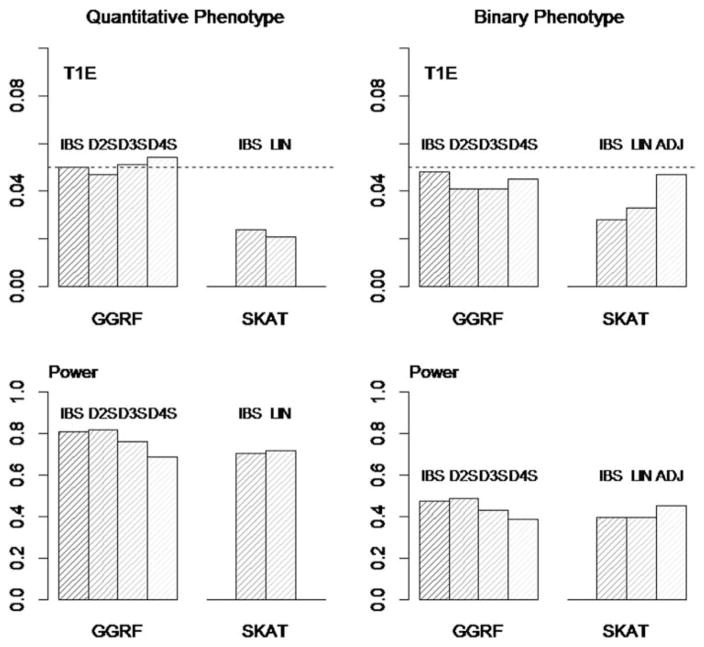
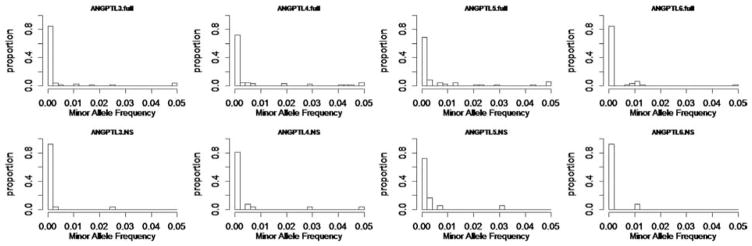
With the advance of high-throughput sequencing technologies, it has become feasible to investigate the influence of the entire spectrum of sequencing variations on complex human diseases. Although association studies utilizing the new sequencing technologies hold great promise to unravel novel genetic variants, especially rare genetic variants that contribute to human diseases, the statistical analysis of high-dimensional sequencing data remains a challenge. Advanced analytical methods are in great need to facilitate high-dimensional sequencing data analyses. In this article, we propose a generalized genetic random field (GGRF) method for association analyses of sequencing data. Like other similarity-based methods (e.g., SIMreg and SKAT), the new method has the advantages of avoiding the need to specify thresholds for rare variants and allowing for testing multiple variants acting in different directions and magnitude of effects. The method is built on the generalized estimating equation framework and thus accommodates a variety of disease phenotypes (e.g., quantitative and binary phenotypes). Moreover, it has a nice asymptotic property, and can be applied to small-scale sequencing data without need for small-sample adjustment. Through simulations, we demonstrate that the proposed GGRF attains an improved or comparable power over a commonly used method, SKAT, under various disease scenarios, especially when rare variants play a significant role in disease etiology. We further illustrate GGRF with an application to a real dataset from the Dallas Heart Study. By using GGRF, we were able to detect the association of two candidate genes, ANGPTL3 and ANGPTL4, with serum triglyceride.
Keywords: generalized estimating equation; rare variants; small-scale sequencing studies.
© 2014 WILEY PERIODICALS, INC.
Figures
Similar articles
-
A novel adaptive method for the analysis of next-generation sequencing data to detect complex trait associations with rare variants due to gene main effects and interactions.PLoS Genet. 2010 Oct 14;6(10):e1001156. doi: 10.1371/journal.pgen.1001156. PLoS Genet. 2010. PMID: 20976247 Free PMC article.
-
Testing Allele Transmission of an SNP Set Using a Family-Based Generalized Genetic Random Field Method.Genet Epidemiol. 2016 May;40(4):341-51. doi: 10.1002/gepi.21970. Epub 2016 Apr 7. Genet Epidemiol. 2016. PMID: 27061818 Free PMC article.
-
Detecting rare variant effects using extreme phenotype sampling in sequencing association studies.Genet Epidemiol. 2013 Feb;37(2):142-51. doi: 10.1002/gepi.21699. Epub 2012 Nov 26. Genet Epidemiol. 2013. PMID: 23184518 Free PMC article.
-
Genetic determinants of plasma triglycerides.J Lipid Res. 2011 Feb;52(2):189-206. doi: 10.1194/jlr.R009720. Epub 2010 Nov 1. J Lipid Res. 2011. PMID: 21041806 Free PMC article. Review.
-
Using population isolates in genetic association studies.Brief Funct Genomics. 2014 Sep;13(5):371-7. doi: 10.1093/bfgp/elu022. Epub 2014 Jul 9. Brief Funct Genomics. 2014. PMID: 25009120 Free PMC article. Review.
Cited by
-
Random field modeling of multi-trait multi-locus association for detecting methylation quantitative trait loci.Bioinformatics. 2022 Aug 10;38(16):3853-3862. doi: 10.1093/bioinformatics/btac443. Bioinformatics. 2022. PMID: 35781319 Free PMC article.
-
A gene-based association test of interactions for maternal-fetal genotypes identifies genes associated with nonsyndromic congenital heart defects.Genet Epidemiol. 2023 Oct;47(7):475-495. doi: 10.1002/gepi.22533. Epub 2023 Jun 21. Genet Epidemiol. 2023. PMID: 37341229 Free PMC article.
-
Detecting methylation quantitative trait loci using a methylation random field method.Brief Bioinform. 2021 Nov 5;22(6):bbab323. doi: 10.1093/bib/bbab323. Brief Bioinform. 2021. PMID: 34414410 Free PMC article.
-
A conditional autoregressive model for genetic association analysis accounting for genetic heterogeneity.Stat Med. 2022 Feb 10;41(3):517-542. doi: 10.1002/sim.9257. Epub 2021 Nov 22. Stat Med. 2022. PMID: 34811777 Free PMC article.
-
Detecting the Genomic Signature of Divergent Selection in Presence of Gene Flow.Curr Genomics. 2015 Jun;16(3):194-202. doi: 10.2174/1389202916666150313230943. Curr Genomics. 2015. PMID: 26069459 Free PMC article.
References
-
- Adler RJ, Taylor JE. Random Fields and Geometry. Springer; New York: 2007.
-
- Ansorge WJ. Next-generation DNA sequencing techniques. N Biotechnol. 2009;25(4):195–203. - PubMed
-
- Besag J. Spatial interaction and statistical analysis of lattice systems. J R Stat Soc B. 1974;48:259–302.
Publication types
MeSH terms
Substances
Grants and funding
LinkOut - more resources
Full Text Sources
Other Literature Sources
Miscellaneous
