

Phonetic feature encoding in human superior temporal gyrus
- PMID: 24482117
- PMCID: PMC4350233
- DOI: 10.1126/science.1245994
Phonetic feature encoding in human superior temporal gyrus
Abstract
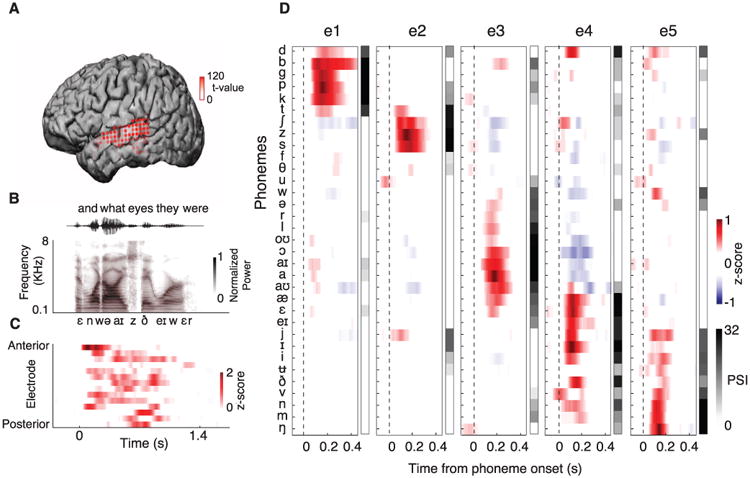
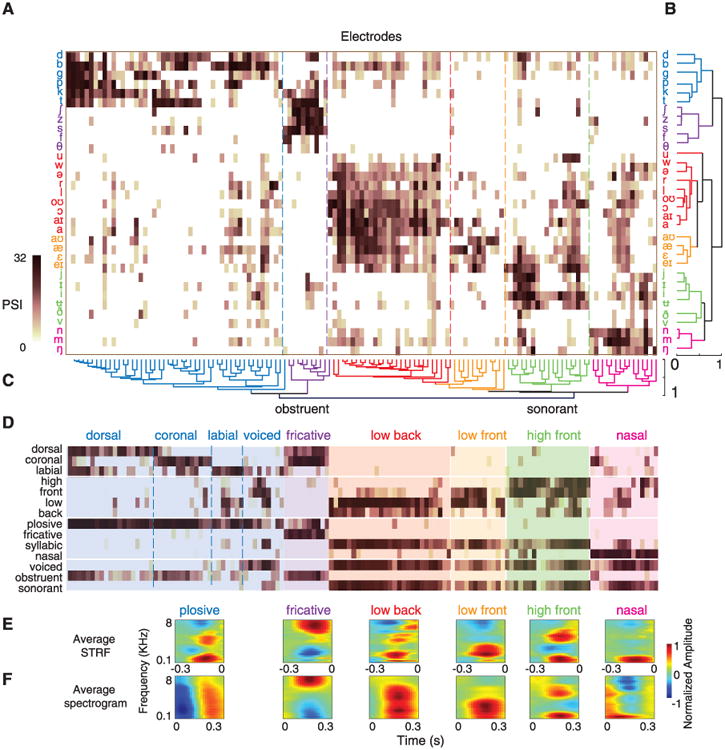
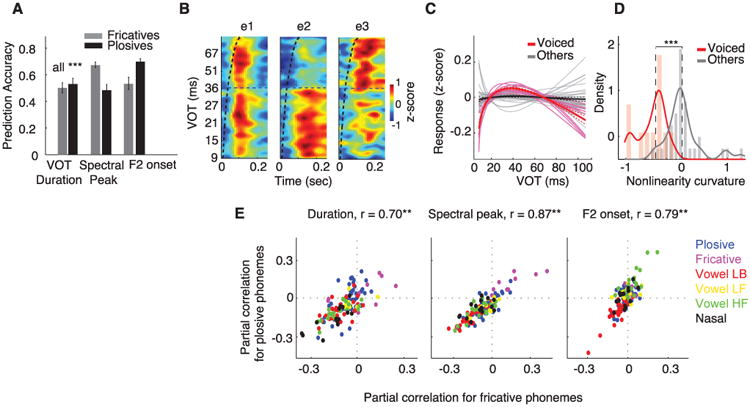
During speech perception, linguistic elements such as consonants and vowels are extracted from a complex acoustic speech signal. The superior temporal gyrus (STG) participates in high-order auditory processing of speech, but how it encodes phonetic information is poorly understood. We used high-density direct cortical surface recordings in humans while they listened to natural, continuous speech to reveal the STG representation of the entire English phonetic inventory. At single electrodes, we found response selectivity to distinct phonetic features. Encoding of acoustic properties was mediated by a distributed population response. Phonetic features could be directly related to tuning for spectrotemporal acoustic cues, some of which were encoded in a nonlinear fashion or by integration of multiple cues. These findings demonstrate the acoustic-phonetic representation of speech in human STG.
Figures

Comment in
-
Neuroscience. The neural code that makes us human.Science. 2014 Feb 28;343(6174):978-9. doi: 10.1126/science.1251495. Science. 2014. PMID: 24578570 No abstract available.
Similar articles
-
The Encoding of Speech Sounds in the Superior Temporal Gyrus.Neuron. 2019 Jun 19;102(6):1096-1110. doi: 10.1016/j.neuron.2019.04.023. Neuron. 2019. PMID: 31220442 Free PMC article. Review.
-
Speech Computations of the Human Superior Temporal Gyrus.Annu Rev Psychol. 2022 Jan 4;73:79-102. doi: 10.1146/annurev-psych-022321-035256. Epub 2021 Oct 21. Annu Rev Psychol. 2022. PMID: 34672685 Free PMC article. Review.
-
Intonational speech prosody encoding in the human auditory cortex.Science. 2017 Aug 25;357(6353):797-801. doi: 10.1126/science.aam8577. Science. 2017. PMID: 28839071 Free PMC article.
-
Latent neural dynamics encode temporal context in speech.Hear Res. 2023 Sep 15;437:108838. doi: 10.1016/j.heares.2023.108838. Epub 2023 Jul 4. Hear Res. 2023. PMID: 37441880 Free PMC article. Review.
-
Human Superior Temporal Gyrus Organization of Spectrotemporal Modulation Tuning Derived from Speech Stimuli.J Neurosci. 2016 Feb 10;36(6):2014-26. doi: 10.1523/JNEUROSCI.1779-15.2016. J Neurosci. 2016. PMID: 26865624 Free PMC article.
Cited by
-
Against the Epistemological Primacy of the Hardware: The Brain from Inside Out, Turned Upside Down.eNeuro. 2020 Aug 7;7(4):ENEURO.0215-20.2020. doi: 10.1523/ENEURO.0215-20.2020. Print 2020 Jul/Aug. eNeuro. 2020. PMID: 32769167 Free PMC article.
-
Neural dynamics of phoneme sequences reveal position-invariant code for content and order.Nat Commun. 2022 Nov 3;13(1):6606. doi: 10.1038/s41467-022-34326-1. Nat Commun. 2022. PMID: 36329058 Free PMC article.
-
Australian English listeners' perception of Japanese vowel length reveals underlying phonological knowledge.Front Psychol. 2023 Oct 26;14:1122471. doi: 10.3389/fpsyg.2023.1122471. eCollection 2023. Front Psychol. 2023. PMID: 37954175 Free PMC article.
-
Exploring neural oscillations during speech perception via surrogate gradient spiking neural networks.Front Neurosci. 2024 Sep 25;18:1449181. doi: 10.3389/fnins.2024.1449181. eCollection 2024. Front Neurosci. 2024. PMID: 39385848 Free PMC article.
-
Phase-encoded fMRI tracks down brainstorms of natural language processing with subsecond precision.Hum Brain Mapp. 2024 Feb 1;45(2):e26617. doi: 10.1002/hbm.26617. Hum Brain Mapp. 2024. PMID: 38339788 Free PMC article.
References
-
- Chomsky N, Halle M. The Sound Pattern of English. Harper and Row; New York: 1968.
-
- Binder JR, et al. Cereb Cortex. 2000;10:512–528. - PubMed
-
- Boatman D, Hall C, Goldstein MH, Lesser R, Gordon B. Cortex. 1997;33:83–98. - PubMed
-
- Formisano E, De Martino F, Bonte M, Goebel R. Science. 2008;322:970–973. - PubMed
Publication types
MeSH terms
Grants and funding
LinkOut - more resources
Full Text Sources
Other Literature Sources
