. 2013 Sep;31(5):50820.
doi: 10.1116/1.4818423. Epub 2013 Aug 27.

Surface characterization of nanomaterials and nanoparticles: Important needs and challenging opportunities

Affiliations

Surface characterization of nanomaterials and nanoparticles: Important needs and challenging opportunities

Donald R Baer et al. J Vac Sci Technol A. 2013 Sep.

Abstract

This review examines characterization challenges inherently associated with understanding nanomaterials and the roles surface and interface characterization methods can play in meeting some of the challenges. In parts of the research community, there is growing recognition that studies and published reports on the properties and behaviors of nanomaterials often have reported inadequate or incomplete characterization. As a consequence, the true value of the data in these reports is, at best, uncertain. With the increasing importance of nanomaterials in fundamental research and technological applications, it is desirable that researchers from the wide variety of disciplines involved recognize the nature of these often unexpected challenges associated with reproducible synthesis and characterization of nanomaterials, including the difficulties of maintaining desired materials properties during handling and processing due to their dynamic nature. It is equally valuable for researchers to understand how characterization approaches (surface and otherwise) can help to minimize synthesis surprises and to determine how (and how quickly) materials and properties change in different environments. Appropriate application of traditional surface sensitive analysis methods (including x-ray photoelectron and Auger electron spectroscopies, scanning probe microscopy, and secondary ion mass spectroscopy) can provide information that helps address several of the analysis needs. In many circumstances, extensions of traditional data analysis can provide considerably more information than normally obtained from the data collected. Less common or evolving methods with surface selectivity (e.g., some variations of nuclear magnetic resonance, sum frequency generation, and low and medium energy ion scattering) can provide information about surfaces or interfaces in working environments (operando or in situ) or information not provided by more traditional methods. Although these methods may require instrumentation or expertise not generally available, they can be particularly useful in addressing specific questions, and examples of their use in nanomaterial research are presented.


Figures

Figure 1
Figure 1
(Color online) All “nanomaterials” publications identified by a Web of Science topic search (including: nanomaterials AND nanoparticles AND nanostructure) by year.
Figure 2
Figure 2
(Color online) Percentage of publications in JVST A and B that include “nano” as a topic, ♦ as identified in the Web of Science and those focused on nanomaterials ▲.
Figure 3
Figure 3
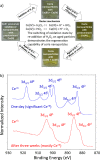
(Color online) (a) Schematic representation of the regenerative capability and oxidation state switching of ceria nanoparticles in an aqueous environment. The pictures of the bottles containing the nanoparticle suspension in DI water indicate color and oxidation state changes after different aging periods. (b) XPS Ce 3d spectra from particles removed from solution after one day and three weeks. Consistent with the optical measurements and solution color, the particles were mostly Ce+4 after one day and mostly Ce+3 after three weeks. When H2O2 was added to the aged nanoparticles in solution, they switched from Ce+3 back to Ce+4. Adapted with permission from Kuchibhatla et al., J. Phys. Chem. C 116, 14108 (2012). Copyright 2012, American Chemical Society.
Figure 4
Figure 4
Three categories of synthesis and processing approaches used to produce ceria particles: high-temperature processing (a)–(c) (Refs. 43, 44, 45), indirect heating of precursors or nanoparticles in solution (d)–(f) (Refs. 40, 41, 42), and room-temperature synthesis of nanoparticles (g)–(i) (Refs. 39, 38, 34). Adapted from Ref. .
Figure 5
Figure 5
(Color online) Summary of the relationships among synthesis categories and biological impacts, showing that synthesis routes have a significant impact of biological outcomes. Adapted from Ref. .
Figure 6
Figure 6
(Color online) XPS spectra from Cu oxide nanoparticles and clean PTFE reference: (a) XPS survey spectra with unexpected F lines; (b) High-energy resolution F 1s region, showing photoelectron peaks consistent with the presence of PTFE and CuF2; (c) High-energy resolution spectrum C 1s region from clean PTFE, showing a photoelectron peak consistent with CF2 bonds in PTFE; and d) High-energy resolution C 1s, showing the presence of breakdown products from PTFE (e.g., CF3, CF2, CF2-CHF, CHF-CHF, along with CH from advantageous surface contamination; a small amount of C-O and C = O is possible but not included in this peak fit). XPS identified the presence of F that was not expected or desired on these particles.
Figure 7
Figure 7
(Color online) Sputter depth profiles of plasma processed p-OSG film before and after exposure to IPA. Based on comparison to the sputter rate for SiO2 the apparent thickness was approximately 157 nm with no IPA exposure and 205 nm after IPA exposure. From Gaspar et al., Surf. Interface Anal. 37, 417 (2005), Copyright 2005, John Wiley & Sons, Ltd.
Figure 8
Figure 8
(Color online) (a) Image of filter and pump arrangement used to “flash dry” nanoparticles removed from aqueous solution for detailed. (b) Graph showing percent weight (moisture) loss as a function of drying time under −20 mm Hg vacuum (open circles). Without the vacuum assist, variable amounts of moisture often were retained in the collection of particles. As shown by the horizontal line, an additional 2 to 3% of moisture could be removed by storing the particles for 24 h in a desiccator filled with 50:50 anhydrous calcium sulfate and activated charcoal. Reprinted with the permission from Nurmi et al., J. Nanopart. Res. 13, 1937 (2010). Copyright 2010, Springer Science and Business Media.
Figure 9
Figure 9
(Color online) Properties of nanoparticles that often introduce characterization challenges; also see Table Table I..
Figure 10
Figure 10
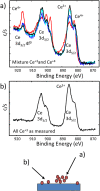
(Color online) Ce 3d XPS spectra from ceria nanoparticles deposited on a Si substrate. Based on optical data, we would expect the ceria to be mostly Ce+3. The deposition process produced regions of high (a) and low (b) particle density. The XPS photoelectron spectrum from the higher density of particles differed (some Ce+4) from the lower density region (only Ce+3).
Figure 11
Figure 11
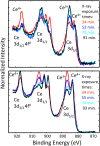
(Color online) Changes in the Ce 3d XPS spectra collected as a function of time for (a) particles formed in an aqueous solution, containing some amount of organic (toluene) (after Ref. 81), or (b) particles synthesized in a solution with no added organic. The 3–5 nm diameter particles produced in the solution with toluene (a) tended to become reduced upon x-ray exposure, while 10–14 nm particles formed in aqueous solution without added organics (b) tended to become oxidized upon x-ray exposure.
Figure 12
Figure 12
(Color online) Schematic model for the carboxylic-terminated SAM on a flat gold surface that was used in the SESSA calculations. Reprinted with permission from Techane et al., Anal. Chem. 83, 6704 (2011). Copyright 2011, American Chemical Society.
Figure 13
Figure 13
(Color online) For application of SESSA to predict the signal strengths from SAM-coated Au nanoparticles, the particles were modeled as multiconcentric cylinders, where each cylinder surface has an average photoelectron take-off angle of ai. The XPS detector is positioned at 0° from the central axis of the AuNP. (a) The sphere is divided into nine concentric cylinders. (b) The end of each cylinder is modeled as a flat surface tiled relative to the axis of the spectrometer with infinite thickness of gold, and (c) the surface composition of each flat Au sample is weighted by its geometric factor then summed together to find the AuNP surface composition. Reprinted with permission from Techane et al., Anal. Chem. 83, 6704 (2011). Copyright 2011, American Chemical Society.
Figure 14
Figure 14
(Color online) Schematic diagram showing the relationships of peak intensity ratios (a) and shell thickness' of nanoparticles based upon knowledge of the radius of the nanoparticles. Reprinted with permission from Shard, J. Phys. Chem. C 116, 16806 (2012). Copyright 2012, American Chemical Society.
Figure 15
Figure 15
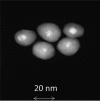
STEM dark field images of Ag-shell Au-core nanoparticles clearly show the presence of Au cores in most particles.
Figure 16
Figure 16
(Color online) Illustration of the SFG liquid cell and experimental geometry. The cell body was made of Teflon. The nanoparticles were deposited on the flat bottom of a CaF2 1 in. diameter hemisphere, which served as the optical window. The liquid flowed through ports sealed by Teflon plugs for studies not requiring the following liquid. The visible and infrared beams were propagated through the CaF2 hemisphere and overlap at the center of the flat surface of the CaF2 hemisphere. The SFG signals were collected in a reflective geometry.
Figure 17
Figure 17
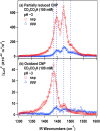
(Color online) SFG-VS spectra (2-cm−1-step scan) of (a) partially reduced ceria nanoparticles and (b) oxidized ceria nanoparticles in contact with CD3CO2H solutions. The vertical dashed lines reveal the shift of peak positions. The two major peaks are identified as bidentate bridging and chelating species of deprotonated acetic acid adsorbed on the particle surfaces. The relative ratio of the type of bonding varies for reduced and oxidized surfaces. There are two lines for each set of data related to the polarization combinations of the incident and SFG signals. The series ssp identifies s-polarizations for the SFG and visible beams and p-polarization for the IR beam, and ppp indicates p-polarizations for the SFG, visible, and IR beams.
Figure 18
Figure 18
(Color online) 1H/13C cross-polarization MAS NMR spectrum of 1-13C-ethanol dosed onto a sample of titania (anatase) nanoparticles, exhibiting two bonding environments for the ethanol molecules reacted with the anatase surface. Data were obtained at a 13C resonance frequency of 188.657 MHz, and a 1H resonance frequency of 750.198 MHz with TPPM 1H decoupling after a 2 ms cross-polarization contact time, using a 1H 90° pulse of 6.5 μs and a 5 s recycle delay. A total of 8192 transients were collected, and the data processing included 50 Hz of Lorentzian broadening.
Figure 19
Figure 19
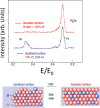
(Color online) Surface characterization of a Pt3Fe alloy using 1 keV Ne+ LEIS to collect data from mildly sputtered and annealed surfaces. As indicated by the schematic model, no Fe is observed for the annealed surface, indicating the formation of a thin Pt skin, which is destroyed upon even very mild sputtering. Reprinted with permission from Stamenkovic et al., Nat. Mater. 6, 241 (2007). Copyright 2007, Macmillan Publishers Nature Publishing Group.
Figure 20
Figure 20
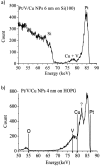
(a) TOF-MEIS spectrum of 6 nm Pt/V/Cu nanoparticles soft landed onto Si(100). The spectrum shows the composition of the particles, but the large peak associated with Si makes it difficult to detect low energy peaks from the particles, such as oxygen. (b) TOF-MEIS spectrum of 4 nm Pt/V/Cu nanoparticles soft landed onto RF plasma cleaned HOPG. The new peak appearing after deposition on the HOPG substrate was from Mo that was unintentionally deposited on the substrate during the cleaning process.
Figure 21
Figure 21
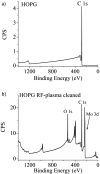
(a) XPS spectrum of HOPG placed in vacuum for 90 min. (b) XPS spectrum of HOPG RF plasma cleaned in Ar for 10 min. XPS data demonstrates that Mo was introduced into the soft landing process during the sputter cleaning of the HOPG substrate.
Figure 22
Figure 22
(Color online) Comparison of the relative rates of application of a wide range of analysis tools to nanomaterials based on a Web of Science search as described in the text. The most widely used surface analysis tools are XPS and AFM. Techniques not previously discussed in this paper include: Fourier transform infrared (FTIR) spectroscopy, dynamic light scattering (DLS), ultraviolet–visible spectroscopy (UV-VIS), x-ray adsorption spectroscopy (XAS), extended x-ray adsorption fine structure (EXAFS), and x-ray absorption near edge structure (XANES).

Similar articles

Cited by

References

    1. Richman E. K. and Hutchison J. E., ACS Nano 3, 2441 (2009).10.1021/nn901112p - DOI - PubMed
    1. Cressey D., Nature 467, 264 (2010).10.1038/467264b - DOI - PubMed
    1. Stuart C., Small Times 6, (2006); http://www.electroiq.com/articles/stm/2006/03/particle-size-matters-stud...
    1. Stefaniak A. B.et al., Nanotoxicology (2012).10.3109/17435390.2012.739664 - DOI - PubMed
    1. Nat. Nano 7, 545 (2012).

Publication types