. 2013 Nov 1;2(11):e26677.
doi: 10.4161/onci.26677. Epub 2013 Nov 4.

Longitudinal confocal microscopy imaging of solid tumor destruction following adoptive T cell transfer

Affiliations

Longitudinal confocal microscopy imaging of solid tumor destruction following adoptive T cell transfer

Andrea Schietinger et al. Oncoimmunology. .

Abstract

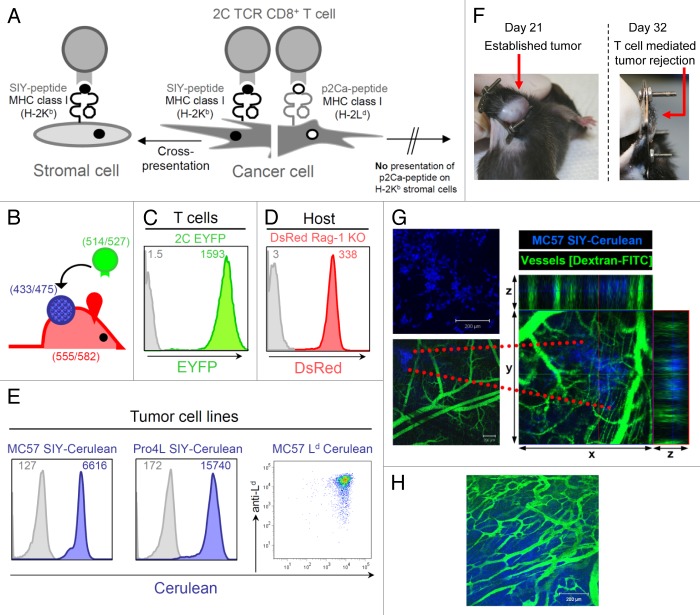
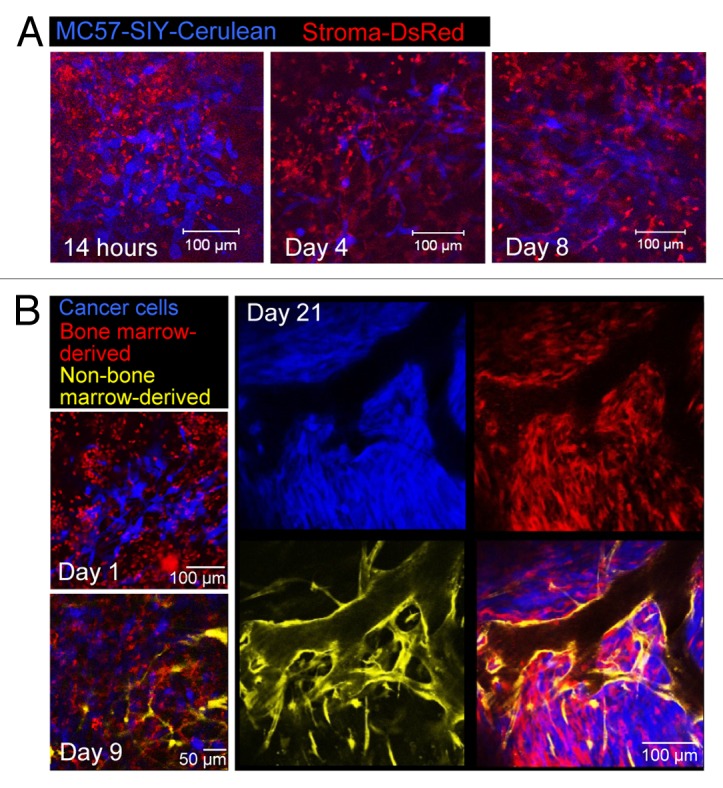
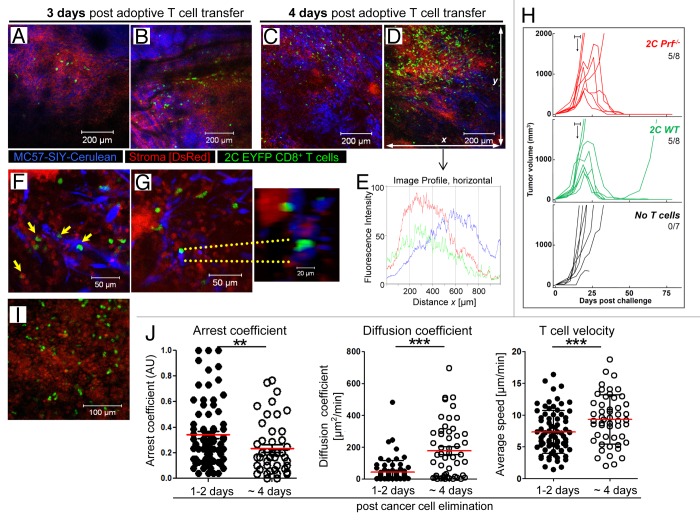
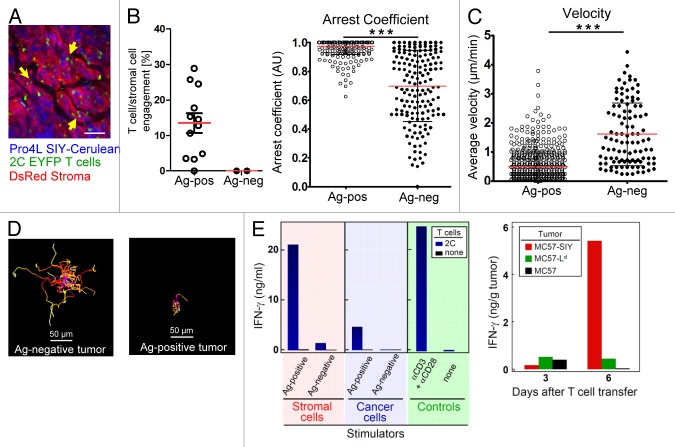
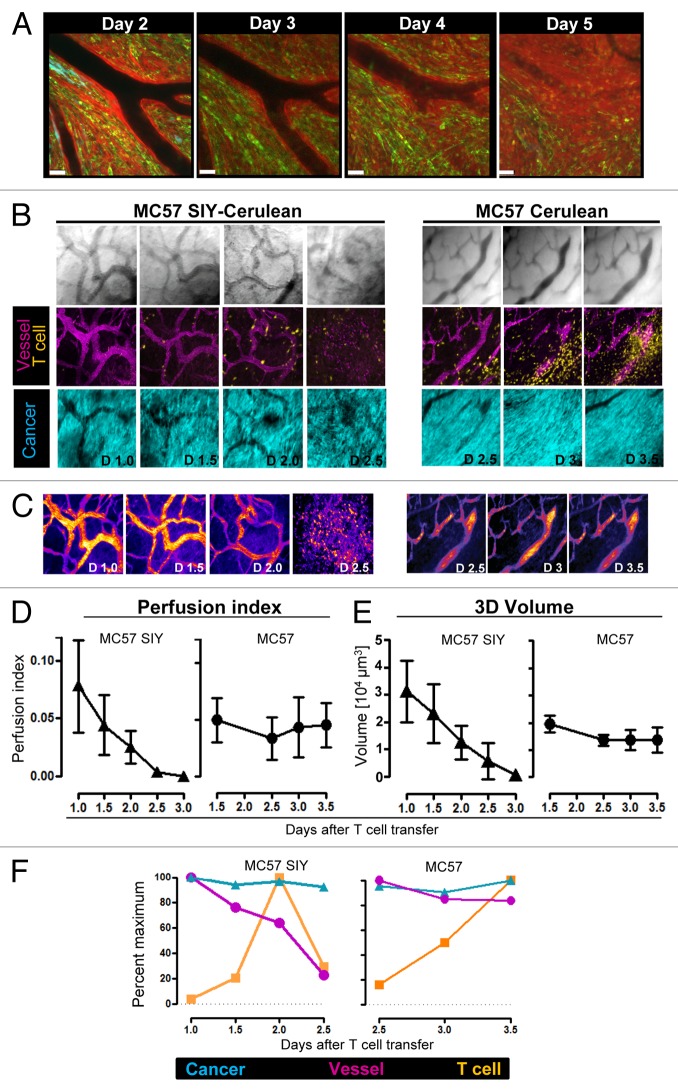
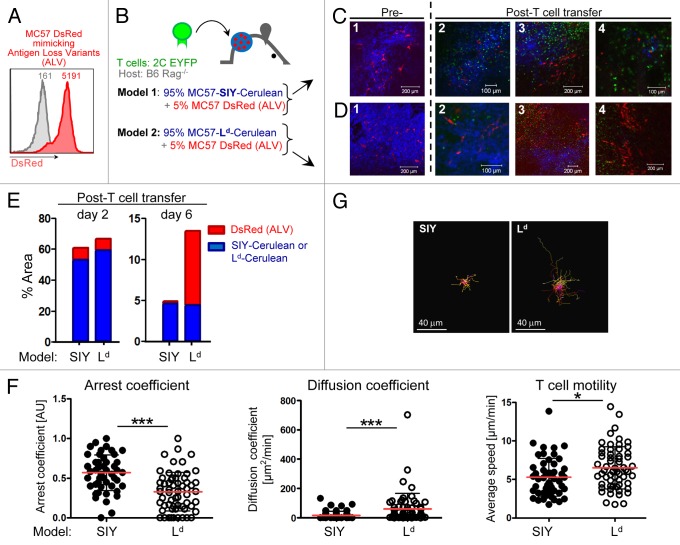
A fluorescence-based, high-resolution imaging approach was used to visualize longitudinally the cellular events unfolding during T cell-mediated tumor destruction. The dynamic interplay of T cells, cancer cells, cancer antigen loss variants, and stromal cells-all color-coded in vivo-was analyzed in established, solid tumors that had developed behind windows implanted on the backs of mice. Events could be followed repeatedly within precisely the same tumor region-before, during and after adoptive T cell therapy-thereby enabling for the first time a longitudinal in vivo evaluation of protracted events, an analysis not possible with terminal imaging of surgically exposed tumors. T cell infiltration, stromal interactions, and vessel destruction, as well as the functional consequences thereof, including the elimination of cancer cells and cancer cell variants were studied. Minimal perivascular T cell infiltrates initiated vascular destruction inside the tumor mass eventually leading to macroscopic central tumor necrosis. Prolonged engagement of T cells with tumor antigen-crosspresenting stromal cells correlated with high IFNγ cytokine release and bystander elimination of antigen-negative cancer cells. The high-resolution, longitudinal, in vivo imaging approach described here will help to further a better mechanistic understanding of tumor eradication by T cells and other anti-cancer therapies.

Keywords: CD8 T cell; cancer; imaging; stroma; tumor immunology; tumor microenvironment.


Figures

None
Figure 1. Tumor model for in vivo longitudinal imaging of solid established tumors growing behind skin-fold window chambers. (A) Model of T cell-recognized tumor antigens presented directly and/or indirectly to 2C transgenic CD8+ T cells. 2C T cells recognize the self-peptide p2Ca presented on MHC class I Ld which can only be presented directly. 2C T cells also recognize the synthetic SIYRYYGL (SIY) peptide in context of MHC class I Kb. SIY can be directly presented by Kb-positive cancer cells as well as cross-presented by antigen-presenting cells (APC) expressing Kb. (B) Color-coded T cells, cancer cells and host stromal cells; T cells express EYFP as transgene, cancer cells are transduced to express Cerulean, and host cells, including tumor stromal cells, express DsRed. Numbers indicate excitation/emission wavelengths for fluorescent proteins. (C) Fluorescence intensity of T cells from 2C TCR × EYFP transgenic F1 mice. EYFP expression of CD8+ and Vß8.1 double-positive cells was analyzed by flow cytometry; gray line represents the background fluorescence of T cells from 2C TCR transgenic mice lacking the fluorescent transgene. (D) CD11b+ cells isolated from a spleen of DsRed Rag1/ mice express high level of DsRed. CD11b+ splenocytes from a litter mate that does not express the transgene DsRed are used as control (gray line); DsRed expression might potentially vary in different types of stromal cells. (E) The MC57 cell line was transduced to express the model tumor antigens SIY-Cerulean or Ld and Cerulean. Pro4L was transduced to express SIY-Cerulean. All transduced tumor lines were FACS-sorted for high expression of Cerulean. The inset numbers indicate the mean fluorescence intensity. Untransduced tumor cells are included for comparison (gray lines). (F) Tumor growth and T cell-mediated eradication of large, established tumors developing behind the dorsal window. A dorsal window and MC57-SIY-Cerulean cancer cells were implanted onto the back skin fold of C57Bl/6 Rag/ mice as described in Methods and Figure S2. By day 21, large established tumors developed behind the window. After adoptive transfer of activated, antigen-specific 2C T cells tumors regressed and were eliminated (day 32). (G) Fourteen hours after window implantation and MC57-SIY-Cerulean cancer cell transplantation, cancer cells were imaged by confocal microscopy (top picture); to visualize pre-established vasculature, 2.000.000 MW fluorescein-conjugated dextran was injected i.v. into the mouse (lower picture); data are representative of more than 15 displays of different injection areas, n = 3 mice. Z-stack images were recorded and x-y plane, xz and yz projections are shown to the right (z = 220μm). (H) Eighteen days later, the same tumor, now large and established, was imaged. The existence of irregular micro-vasculature typical for established tumors was visualized by dextran-FITC injection; data are representative of at least 2 mice.
None
Figure 2. Longitudinal visualization of tumor stroma formation. (A) MC57-SIY-Cerulean cells were injected into a DsRed Rag1/ mouse. Images were taken 14h, 4d, and 8d post window and cancer cell implantation. While 14h after window/cancer cell implantation, the site is densely infiltrated with round, rapidly moving stromal cells (image corresponds to Video 1), 4–8d later the number of these cells is greatly reduced and many stromal cells acquire a stellate and spindle-like shape (image corresponds to Video 2). (B) Tumor growth in color-coded bone-marrow (BM) chimeric mice with cerulean-blue tumor cells, DsRed BM-derived host cells, and EYFP-yellow non-BM-derived host cells. Cancer cells mobilize BM-cells and non-BM cells for the formation of tumor stroma. Non-BM-derived cells account mainly for tumor vasculature. Data are representative of 3 independent experiments.
None
Figure 3. Entry, distribution, cytolytic activity, and motility of tumor-specific T cells in tumors after adoptive transfer. (A) and (B) T cells enter the tumor as early as 2–3 d after transfer. In vitro activated, tumor-specific 2C EYFP T cells adoptively transferred into a DsRed Rag1/ mouse bearing a MC57-SIY-Cerulean tumor extravasate and enter into the tumor tissue at few distinct sites (data are representative of more than 3 independent experiments). (C) and (D) 24 h later, T cells do not uniformly distribute within the tumor, but heterogeneously. (E) Fluorescence intensity profiles for Cerulean, EYFP, and DsRed were acquired throughout total fields of view (FOV) of Figure 3D. Increased fluorescence intensity indicates accumulation of cell populations. (F) and (G) Cell-cell interactions during T cell-mediated tumor destruction. 2C EYFP T cells engage with MC57-SIY-Cerulean cancer cells; apoptotic membrane blebbing of cancer cells (yellow arrows); enlarged, 3-dimensional, rotated display of the T cell-cancer cell engagement (right). T cells also engage with stromal cells [(F), yellow arrows]; image corresponds to Video 4. (H) Perforin is not needed for the rejection of established MC57-SIY tumors. In vitro activated 2C Prf/ or 2C WT T cells were adoptively transferred into MC57-SIY tumor bearing mice (when tumors reached a size of about 500 mm3 [between days 13 and 17 as indicated by the horizontal bars (┣┫)]. The number of rejected tumors per total number of tumors is indicated. Data are pooled from 5 independent experiments. P = 0.026 (2C Prf/ and 2C WT). (I) 1–2 d after cancer cell elimination T cells remain in microenvironment and stably engage with stromal cells; image corresponds to Video 6. Data are representative of 3 independent experiments (n = 4 mice). (J) Comparison of diffusion coefficient and average velocities of T cells in Video 6 (T cells remain arrested) and Video 7 (T cells regain motility ~4 d post cancer cell elimination). Each dot represents an individual T cell; red lines indicate mean; black bars indicate the time-domain standard deviation (td-StDev). Data are representative of 2 independent experiments (**P = 0.0064; ***P < 0.0001).
None
Figure 4. Antigen-dependent stromal engagement of 2C-EYFP CD8+ T cells in Pro4L-SIY-Cerulean tumors (A–D). T cells interact with DsRed-positive stromal cells (yellow arrows); scale bar = 75μm. Image corresponds to Video 8. (B) Left panel. Stromal engagement of T cells is antigen-dependent. Percentage of T cell/stromal cell engagements in Pro4L-SIY-Cerulean (Ag-positive) and Pro4L-Cerulean (Ag-negative) tumors. See Methods for further details. Right panel, Arrest coefficient, (C) average velocities, and (D) representative displacement tracks for 2C T cells in antigen-positive Pro4L-SIY and antigen-negative Pro4L control tumors are graphed (scale bar = 50μm). Red lines indicate mean; black bars indicate td-StDev. Data are representative of 3 experiments and mice, 2 with Pro4L-SIY tumors and 1 with Pro4L. A total of 12 movies (Pro4L-SIY) and 3 movies (Pro4L) were analyzed, 30–150 min long. In B and C, each dot represents an individual T cell. P values were obtained with Mann–Whitney analysis for (B–D); ***P < 0.0001. (E) Left panel: IFNγ secretion by 2C T cells stimulated with tumor-derived stromal cells or cancer cells. CD11b+ stromal cells were isolated from established antigen-positive MC57-SIY tumors (or antigen-negative MC57-hgp100 tumors as control) by magnetic separation and co-cultured with peptide-activated 2C T cells. Stromal cells were compared with equal numbers of cultured cancer cells expressing the same antigen. Supernatants were harvested after 24 h of co-culture and IFNγ was measured by ELISA. Non-stimulated T cells served as negative control (none) and a Data are representative for 4 independent experiments. Right panel: High in vivo IFNγ levels in solid tumors after adoptive T cell transfer only when cross-presentation is enabled. Rag/mice with established MC57, MC57-Ld, or MC57-SIY tumors were treated with activated 2C T cells. Three and 6 d after T cell transfer, in vivo IFNγ levels were determined in homogenized tissues of individual tumors by ELISA as per manufacturer’s instructions (eBioscience). Bars represent IFNγ levels per gram of tumor tissue. Data are representative for 2 experiments with 3 to 5 tumors per group.
None
Figure 5. Longitudinal imaging and quantification of vessel integrity, vessel perfusion, and 3D vessel volume in solid tumors after adoptive T cell transfer. (A) Activated 2C T cells were adoptively transferred into a DsRed host mice with a 21-d-old established solid tumor (95% MC57-SIY EGFP + 5% MC57 Cerulean). At indicated time points post T cell transfer same tumor area was imaged (scale bar = 50μm). (B–F) DsRed Rag1/ mice with established MC57-Cerulean or MC57 SIY-Cerulean tumors growing behind windows were injected with activated 2C EYFP CD8 T cells at day 18 of tumor growth. DiD-labeled red blood cells were injected intravenously into mice on the day of T cell transfer and tumors were imaged in 3D and longitudinally, every 12 h, at indicated time points by acquiring numerous sets of z-stack volumes. (B) Bright field images (top) and maximal projections of z-stacks (bottom) of DiD-labeled red blood cells (purple), 2C EYFP T cells (yellow), MC57-Cerulean (right), and MC57 SIY-Cerulean (left) cancer cells (cyan blue) at indicated time points post T cell transfer. (C) Representation of vessel perfusion indexes (VPI) generated from time-domain standard deviations (td-StDev) of DiD-intensities throughout the entire set of z-stacks. The higher the td-StDev values in the DiD channel per pixel, the higher the assigned color intensity values in the pseudo-colored image (option Fire LUT; Fiji). A detailed description of the generation of VPI is provided in Materials and Methods. VPI is an indirect measure of vessel integrity: high td-StDev in the DiD channel indicates fast blood flow and consequently good vessel integrity; low td-StDev results from static DiD-RBC reflecting impaired vessel integrity. Vessel leakiness/damage is observed in antigen-positive MC57 SIY tumors, but not in antigen-negative MC57 tumors after T cell transfer. (D) Vessel Perfusion Indexes, and (E) 3D volumetric vessel analysis for MC57 and MC57 SIY tumors measured over several days post T cell transfer. Calculations and methods used to quantify vessel density in 3D images are described in Materials and Methods. (D) and (E) show averages and StDev from several tumor regions followed longitudinally. N of regions at each time point is as follows (day, N); for antigen-positive tumor: (d1,6;d1.5,7;d2,9;d2.5,9;d3,4); for control tumor (d1,6;d1.5,5;d2.5,5;d3,4;d3.5,3). A second, independent longitudinal experiment with another mouse showed similar results. (F) The area occupied by cancer cells, T cells and vessels was measured for images displayed in Figure 5B. The maximum value of area fraction for each channel was assigned the value of 100% and all subsequent values for the specific channel were plotted as percent of maximum.
None
Figure 6. Visualization of bystander elimination of antigen-loss variants (ALV). (A) To visualize ALV, parental MC57 cells were transduced to express DsRed. The inset numbers indicate the mean fluorescence intensity by flow analysis. Parental MC57 is used as control (gray line). (B) Scheme. Model 1: antigen-positive MC57-SIY-Cerulean cancer cells are mixed with 5% of MC57-DsRed ALV and transplanted into C57Bl/6 Rag1/ mice (n = 3). Model 2: antigen-positive MC57-Ld-Cerulean cancer cells are mixed with 5% of MC57-DsRed ALV and transplanted into C57Bl/6 Rag1/ mice (n = 2). (C–D) Both cell mixtures grow with red ALV homogeneously embedded in the blue, antigen-positive tumor tissue [image 1]. Adoptively transferred 2C EYFP T cells arrive in the tumors [image 2; 3–4 d post T cell transfer]. While T cells eliminate the blue antigen-positive MC57-SIY-Cerulean and MC57-Ld-Cerulean cancer cells, the red ALV are not killed and “red-only areas” emerge [image 3; 4 d post T cell transfer]. While red ALV in the MC57-SIY-Cerulean microenvironment disappear over time (model 1 [image 4; 6 d post T cell transfer]), ALV in the MC57-Ld Cerulean microenvironment persist and continue to grow (model 2 [image 4; 5 d post T cell transfer]). (E) Percent of image occupied by DsRed ALV and blue SIY- or Ld-expressing cancer cells before (left panel; corresponding to Figure 6C and D (image 2) or during/after (right panel; corresponding to Figures 6C and D (images 4)) T cell mediated destruction. While the presence of ALV in the SIY model significantly decreases, ALV in the Ld-tumor persist and continue to grow. Images were acquired using different magnifications and subsequently adjusted digitally to be in the same scale. (F) Arrest coefficient, diffusion coefficient and average velocities of 2C T cells in the microenvironment of MC57-SIY or MC57-Ld tumors are graphed. Red lines indicate mean, black bars indicate td-StDev; ***P < 0.0001; *P = 0.0122. (G) Representative displacement tracks from 2C T cells in MC57-SIY or MC57-Ld tumors (scale bar = 40μm).

References

    1. Rabinovich GA, Gabrilovich D, Sotomayor EM. Immunosuppressive strategies that are mediated by tumor cells. Annu Rev Immunol. 2007;25:267–96. doi: 10.1146/annurev.immunol.25.022106.141609. - DOI - PMC - PubMed
    1. Pekarek LA, Starr BA, Toledano AY, Schreiber H. Inhibition of tumor growth by elimination of granulocytes. J Exp Med. 1995;181:435–40. doi: 10.1084/jem.181.1.435. - DOI - PMC - PubMed
    1. Seung LP, Rowley DA, Dubey P, Schreiber H. Synergy between T-cell immunity and inhibition of paracrine stimulation causes tumor rejection. Proc Natl Acad Sci U S A. 1995;92:6254–8. doi: 10.1073/pnas.92.14.6254. - DOI - PMC - PubMed
    1. Seung LP, Seung SK, Schreiber H. Antigenic cancer cells that escape immune destruction are stimulated by host cells. Cancer Res. 1995;55:5094–100. - PubMed
    1. Wyckoff J, Wang W, Lin EY, Wang Y, Pixley F, Stanley ER, Graf T, Pollard JW, Segall J, Condeelis J. A paracrine loop between tumor cells and macrophages is required for tumor cell migration in mammary tumors. Cancer Res. 2004;64:7022–9. doi: 10.1158/0008-5472.CAN-04-1449. - DOI - PubMed

Publication types

LinkOut - more resources