. 2014 Jan;1840(1):656-66.
doi: 10.1016/j.bbagen.2013.10.028.

Palmitate interaction with physiological states of myoglobin

Palmitate interaction with physiological states of myoglobin

Lifan Shih et al. Biochim Biophys Acta. 2014 Jan.

Abstract

Background: Previous studies have shown that palmitate (PA) can bind specifically and non-specifically to Fe(III)MbCN. The present study has observed PA interaction with physiological states of Fe(II)Mb, and the observations support the hypothesis that Mb may have a potential role in facilitating intracellular fatty acid transport.

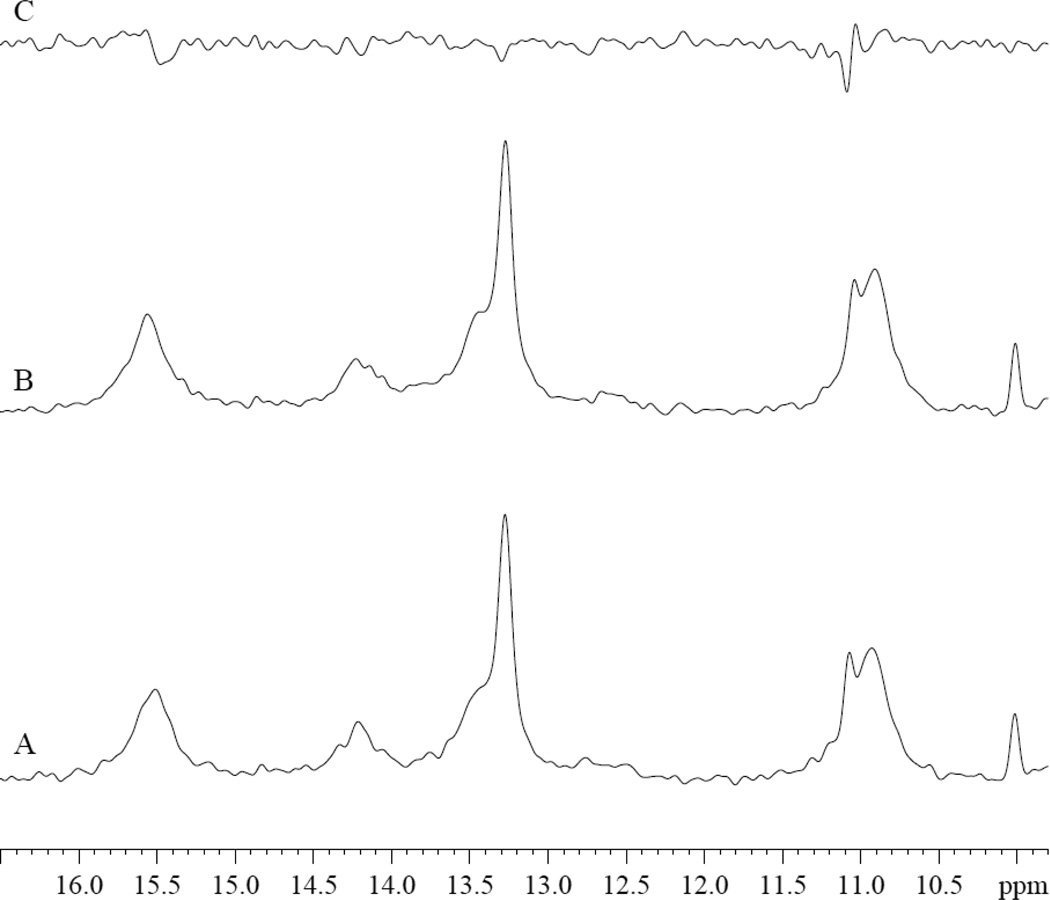
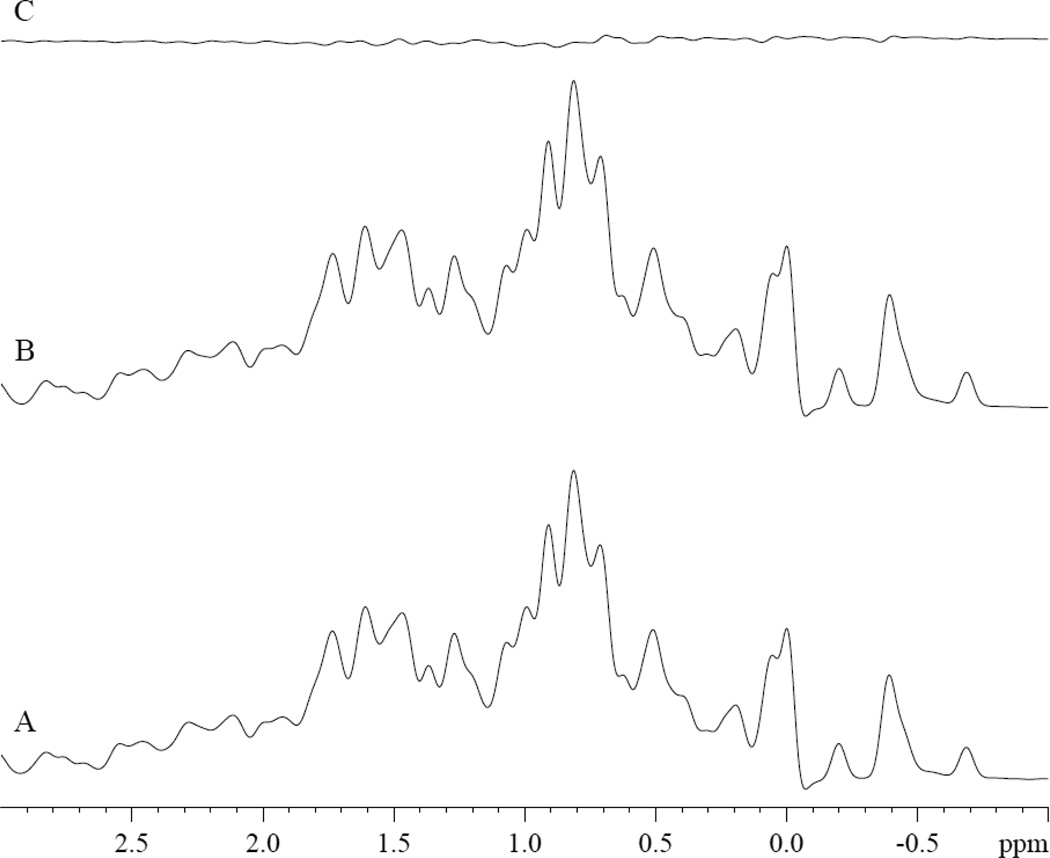
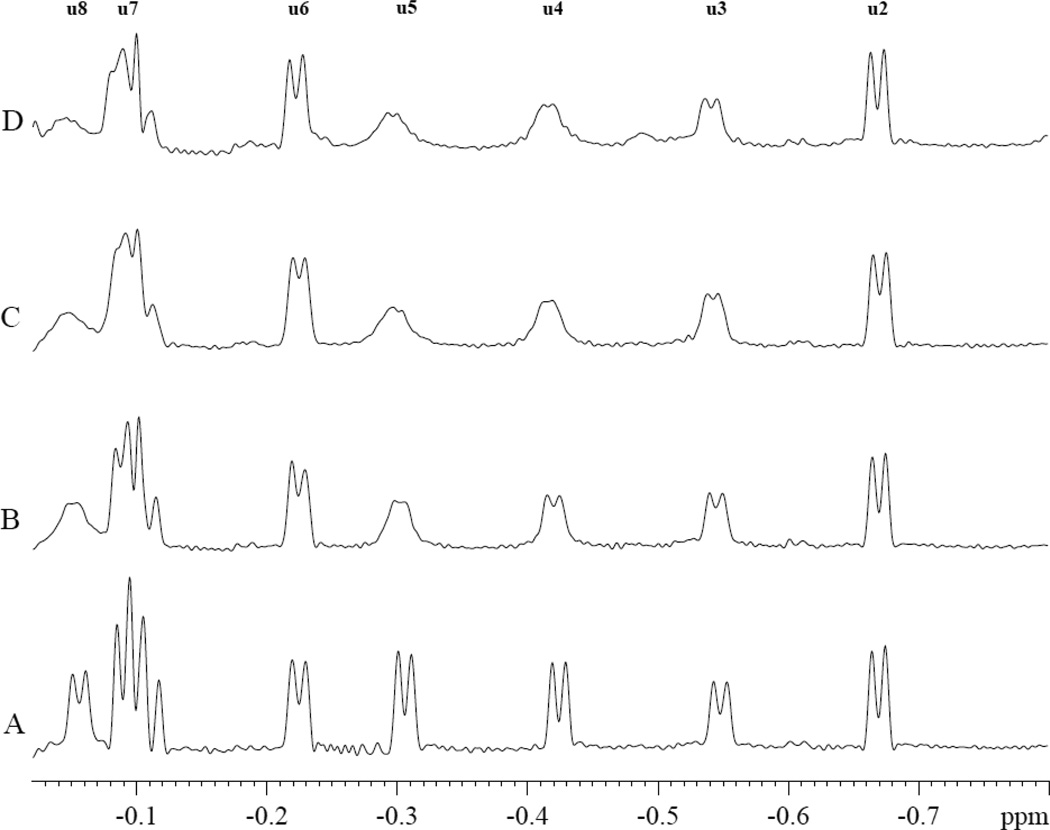
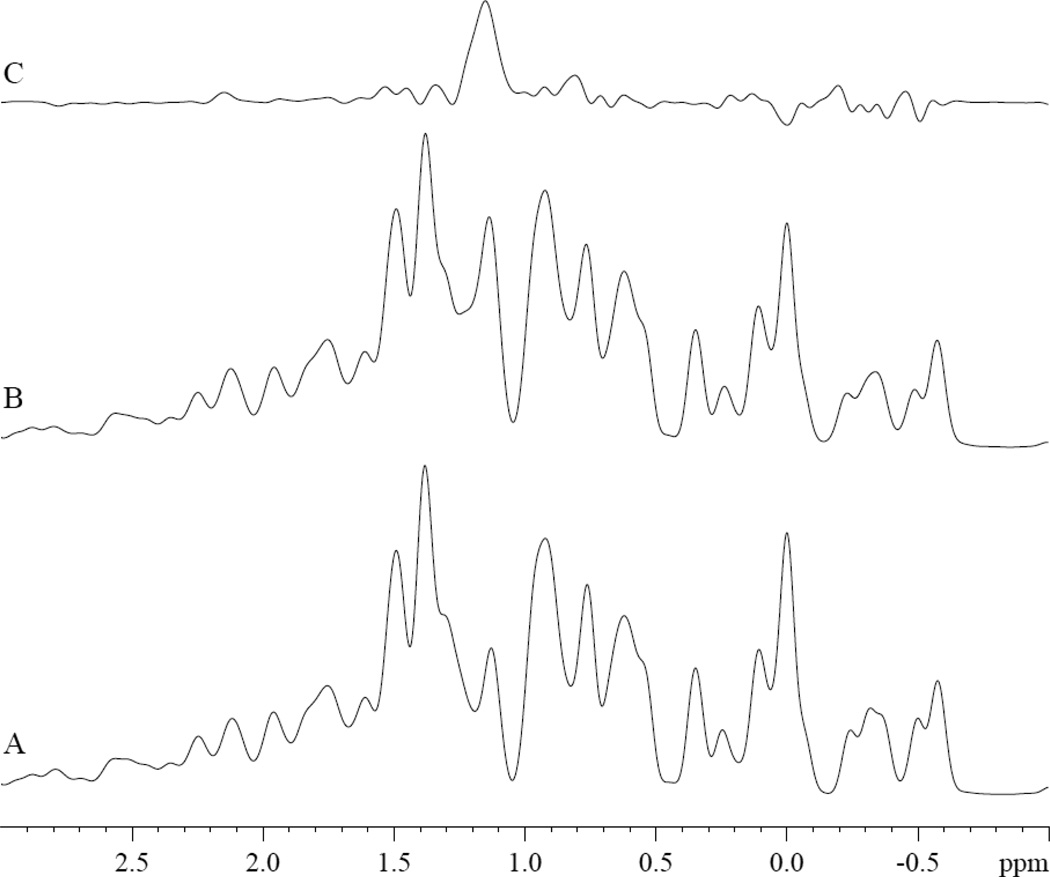
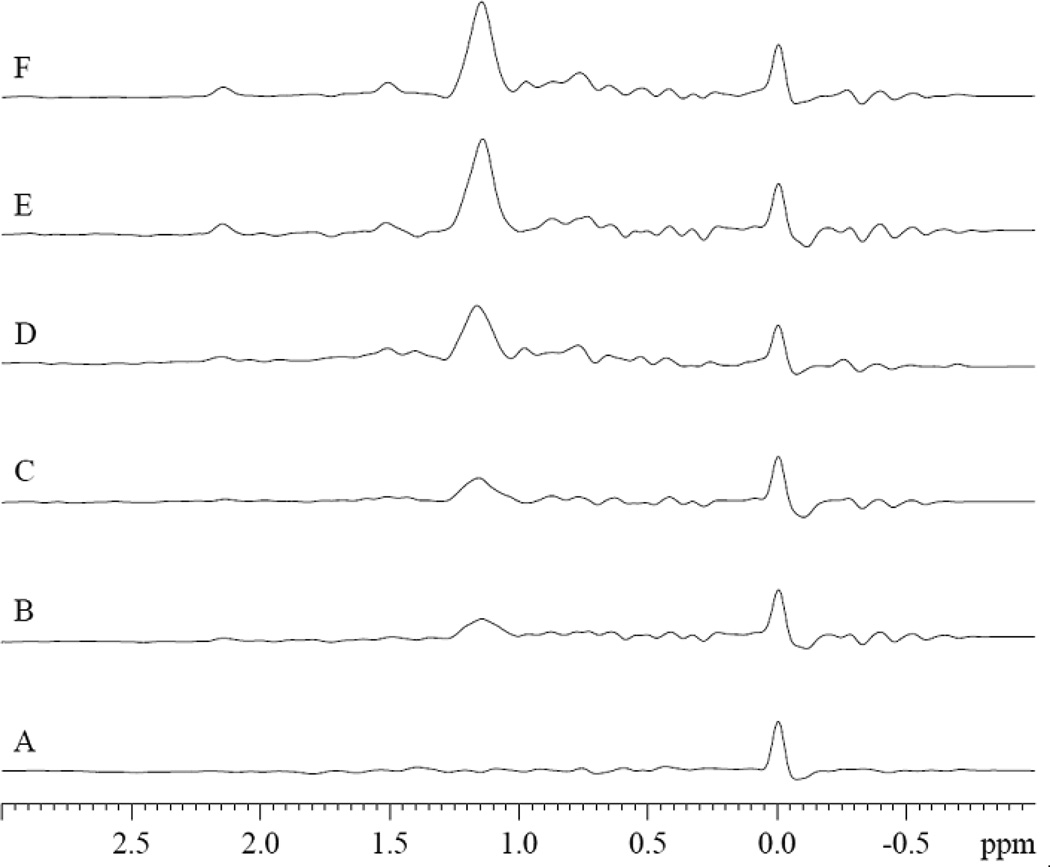
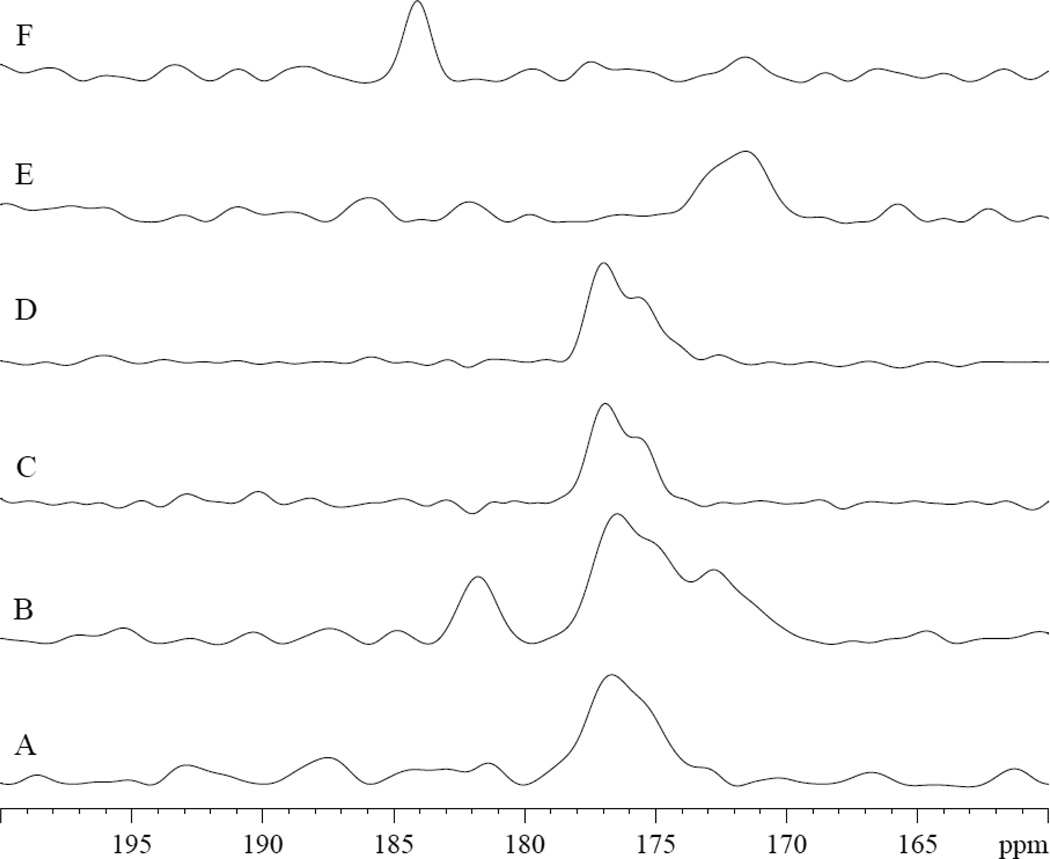
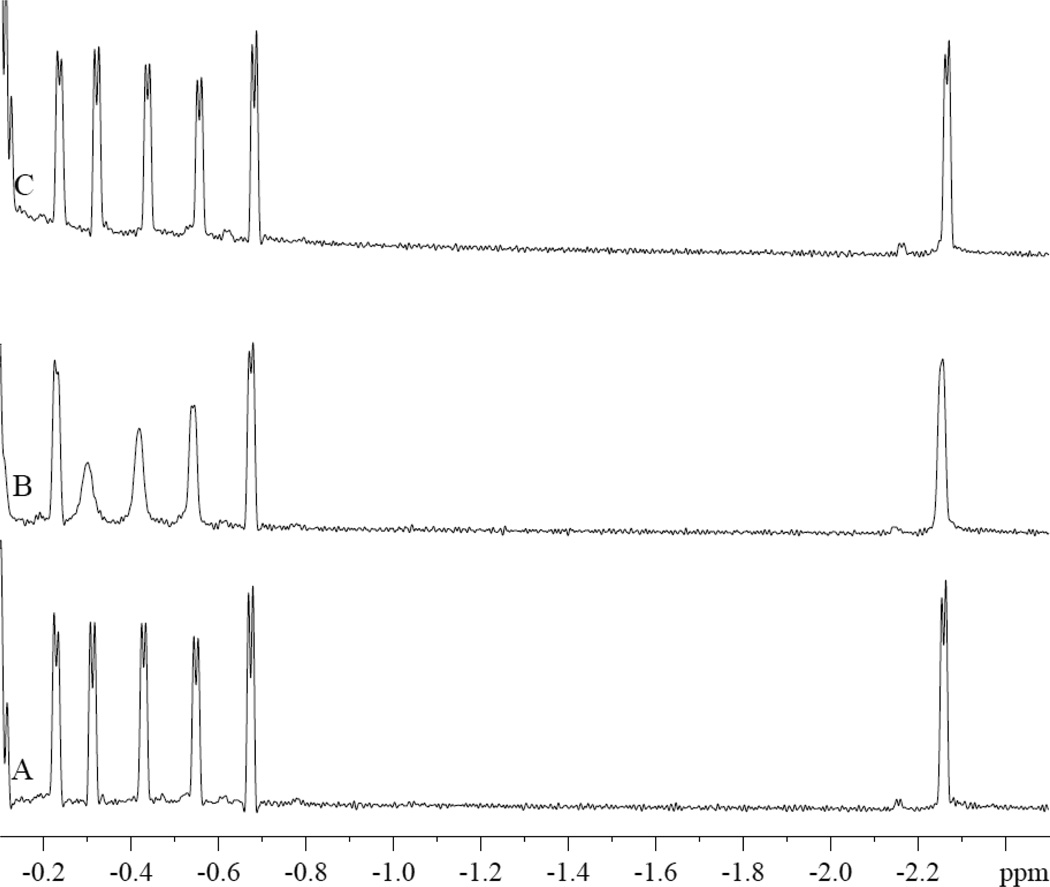
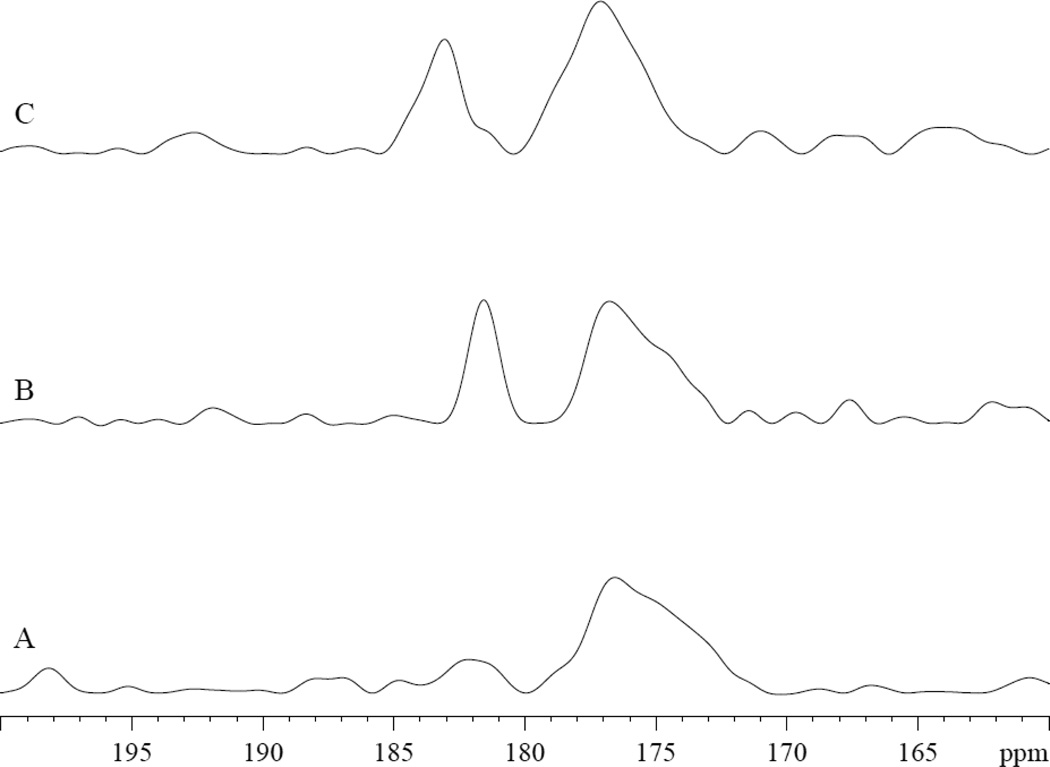
Methods: 1H NMR spectra measurements of the Mb signal during PA titration show signal changes consistent with specific and non-specific binding.

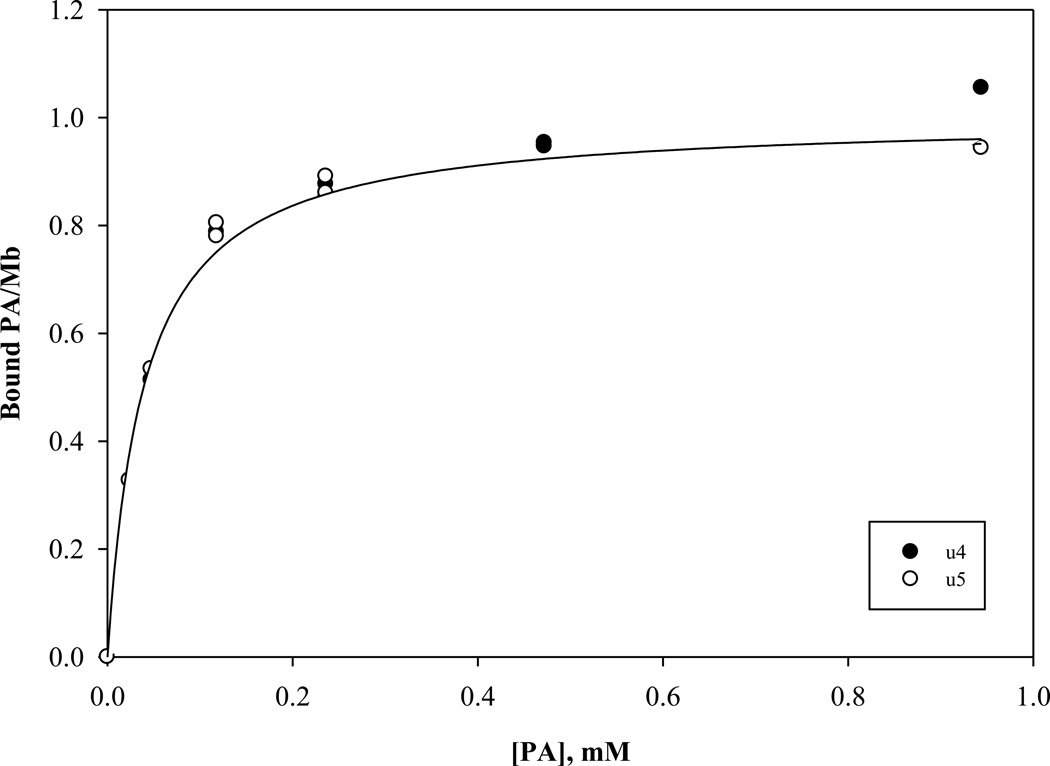
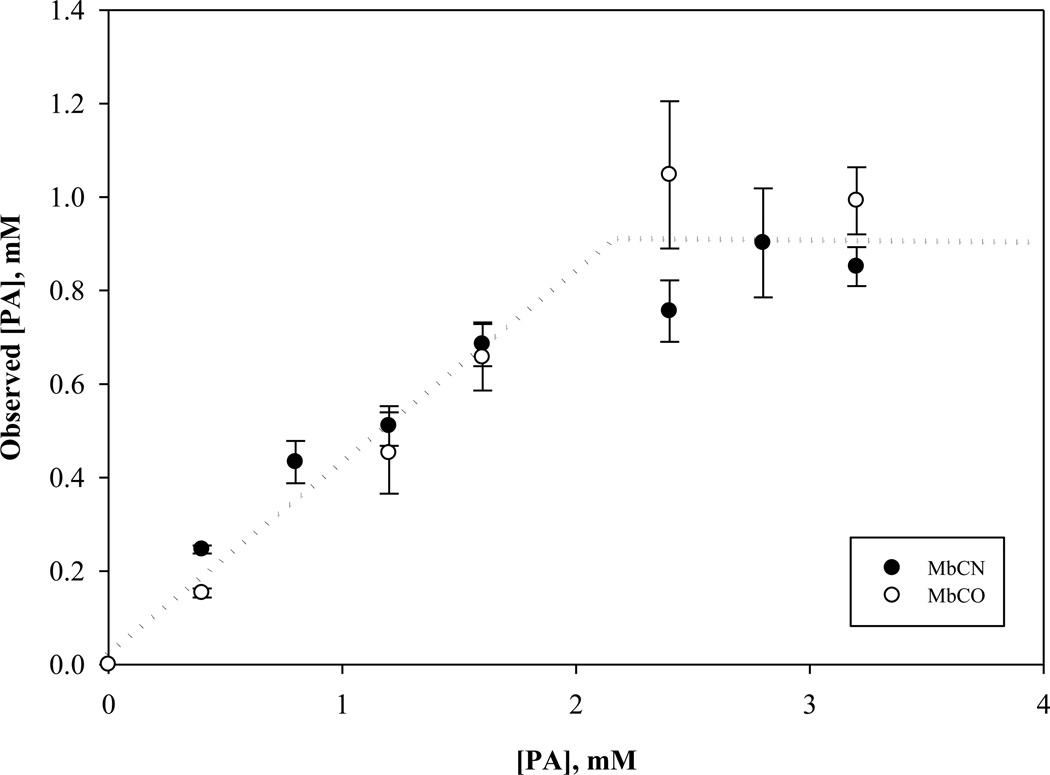
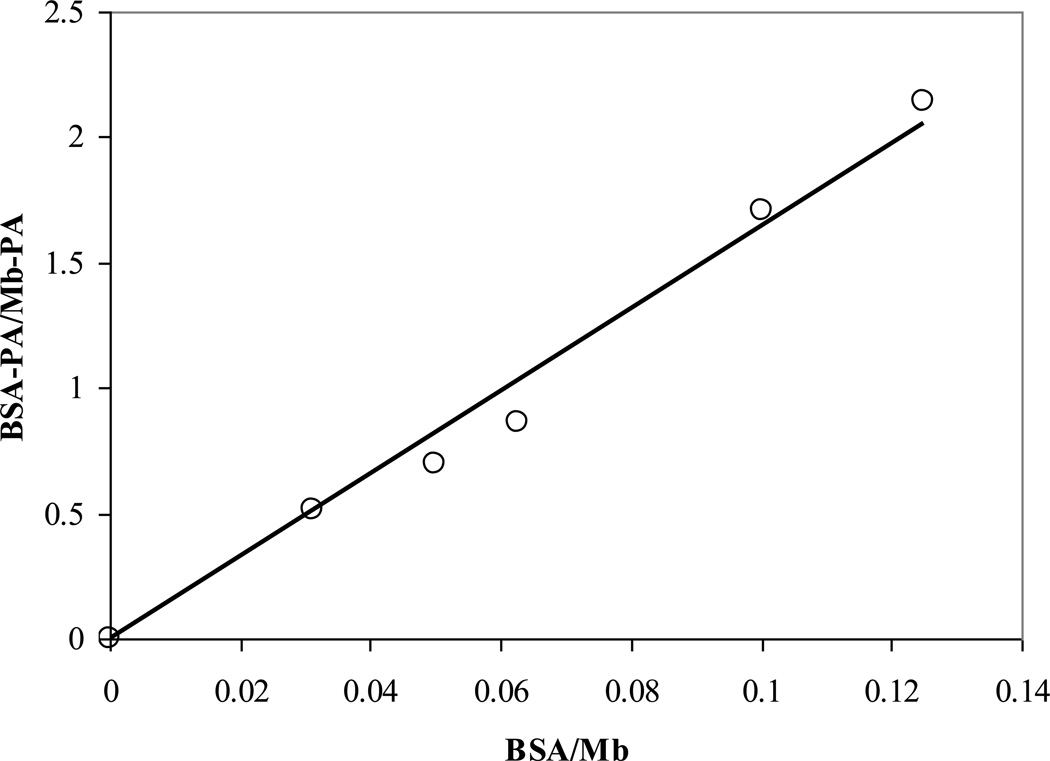
Results: Palmitate (PA) interacts differently with physiological states of Mb. Deoxy Mb does not interact specifically or non-specifically with PA, while the carbonmonoxy myoglobin (MbCO) interaction with PA decreases the intensity of selective signals and produces a 0.15ppmupfield shift of the PAmethylene peak. The selective signal change upon PA titration provides a basis to determine an apparent PA binding constant,which serves to create a model comparing the competitive PA binding and facilitated fatty acid transport of Mb and fatty acid binding protein(FABP).

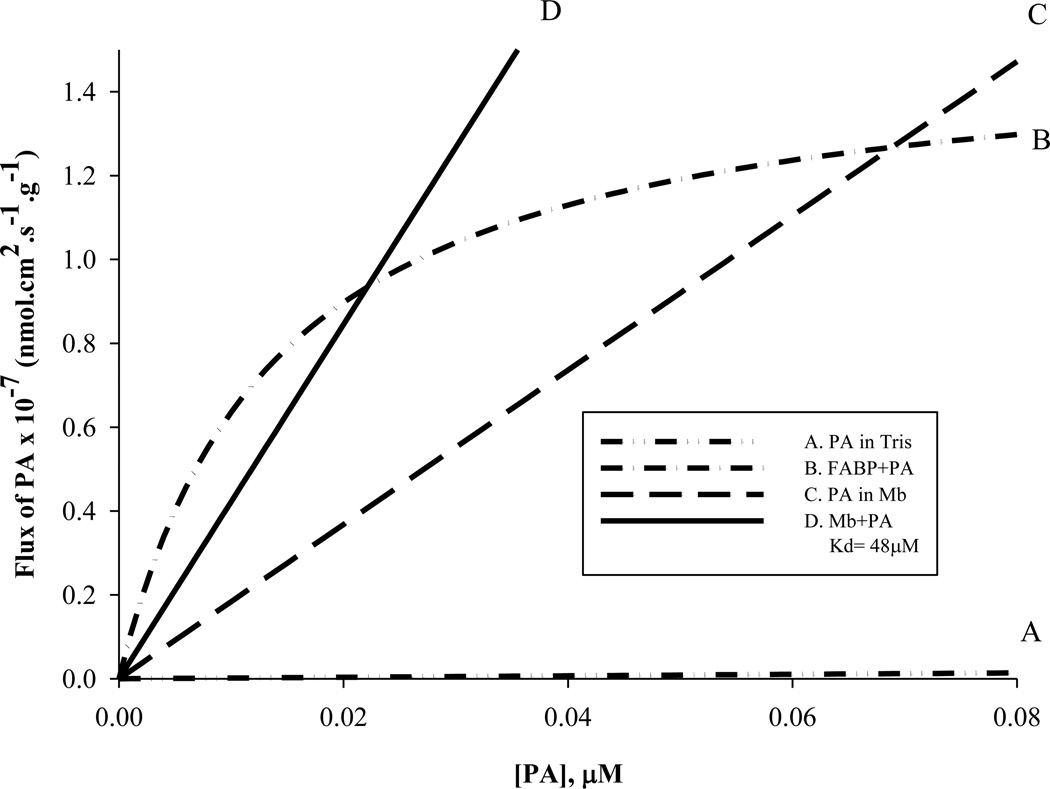
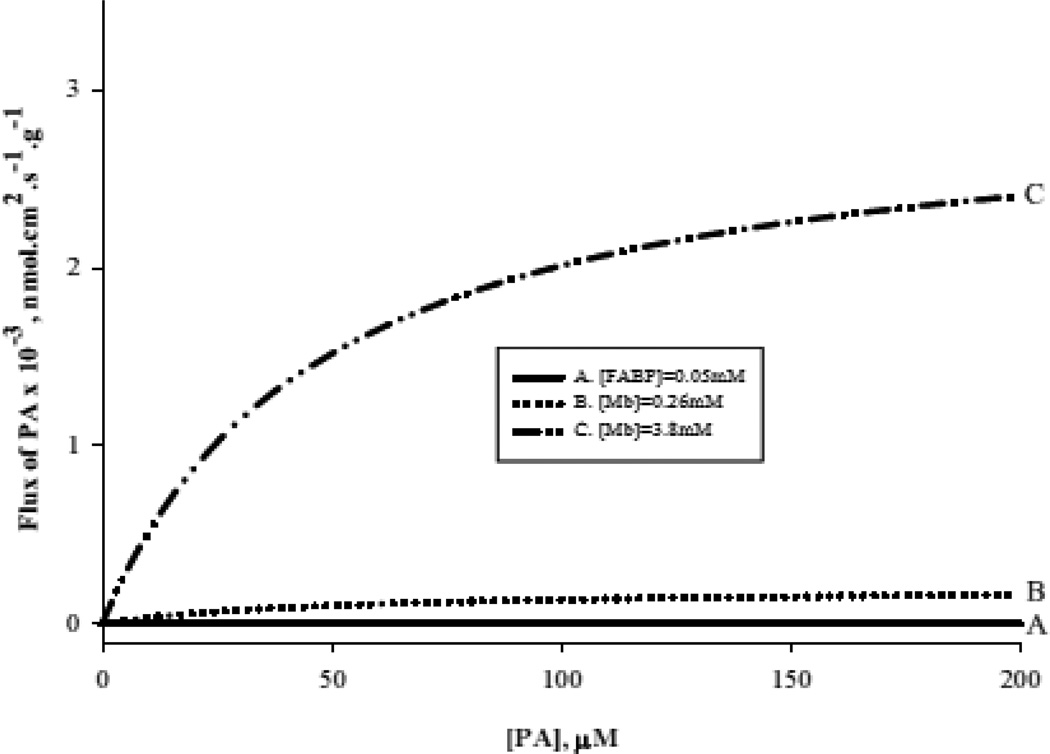
Conclusions: Given contrasting PA interaction of ligated vs. unligated Mb, the cellular fatty acid binding protein(FABP) and Mb concentration in the cell, the reported cellular diffusion coefficients, the PA dissociation constants from ligated Mb and FABP, a fatty acid flux model suggests that Mb can compete with FABP transporting cellular fatty acid.

General significance: Under oxygenated conditions and continuous energy demand, Mb dependent fatty acid transport could influence the cell's preference for carbohydrate or fatty acid as a fuel source and regulate fatty acid metabolism.


Figures

Figure 1
Figure 1
1H NMR Spectra of hyperfine shifted region of deoxyMb Tris buffer at pH 7.4 at 35°C: A. 0.8mM deoxyMb. B. 0.8mM deoxyMb and 3.2 mM PA. C. difference of B-A.
Figure 2
Figure 2
1H NMR spectra of 0.8mM deoxyMb in Tris buffer at pH 7.4 at 35°C: Spectra of A. 0.8mM deoxyMb B. 0.8mM deoxyMb and 3.2mM PA, C. difference of B-A.
Figure 3
Figure 3
PA perturbs specifically the MbCO hyperfine shifted 1H NMR peaks (u3, u4, u5, u7, and u8) in the spectral region from −0.05 to −0.8 ppm. PA has no effect on peaks u2, u6, and other peaks. The spectra show the signals from 0.8 mM MbCO with and without palmitate in 30mM Tris and 1mM EDTA buffer with 3.2mM TSP at pH 7.4 and 35°C. A). No PA, B. MbCO:PA=1:0.38, C). MbCO:PA=1:1.9, D). MbCO:PA=1:3.8.
Figure 4
Figure 4
1H NMR spectra of A) MbCO, B) MbCO with 3.2 mM PA, and C) difference spectrum (B-A). The PA -CH2 peak appears at 1.14 ppm, 0.15 ppm upfield from its 1.29 ppm chemical shift in Tris buffer at pH 7.4 and 35°C [67].
Figure 5
Figure 5
1H NMR difference spectra of MbCO (MbCO with varying amount of PA and TSP –MbCO without PA and TSP) in 30mM Tris buffer and with 1mM EDTA and with and without 3.2mM TSP at pH of 7.4 at 35°C at varying Mb:PA ratio: A). MbCO:PA=1:0, B). MbCO:PA=1:0.5, C). MbCO:PA=1:1, D). MbCO:PA=1:2, E). MbCO:PA=1:3.5, F). MbCO:PA=1:4. The peak at 0 ppm corresponds to 3.2 mM TSP. The PA -CH2 peak intensity increases, as PA level increases.
Figure 6
Figure 6
The signal intensity graph of u4 and u5 during a PA titration reveals a concentration dependence that reaches a saturating PA-Mb level. The analysis of these curves yields apparent dissociation constants 39 and 48 µM for u4 and u5 respectively.
Figure 7
Figure 7
Graph of the observed PA as a function of actual PA titrated into 0.8 mM MbCN and MbCO in Tris buffer at pH 7.4 at 35°C. Below 2.2 mM added PA, the observed PA based on the concentration determined from the PA –CH2 signal follows a linear relationship with a slope of 0.41. Above 2.2 mM, the observed PA remains constant at 0.91 mM. Both MbCO and MbCN exhibit a similar non-specific PA interaction profile. The NMR visible PA fraction suggests a solubility that exceeds the corresponding PA solubility in Tris buffer.
Figure 8
Figure 8
13C1 PA in MbCO, deoxy Mb, and Tris exhibit contrasting spectra: A) 0.8mM MbCO in 30mM Tris buffer at pH 7.4 at 35°C B) 0.8 mM MbCO with 0.8 mM PA. PA peaks appear at 172 and 182 ppm, fig 8A–8B C) 0.8mM deoxy Mb D) 0.8mM deoxy Mb with 0.8 mM PA E) 3.2 mM PA in Tris buffer, pH 7.4. 13C1 PA appears at 172 ppm. F) 3.2 mM PA in Tris buffer, pH 9.5. 13C1 PA appears at 184 ppm.
Figure 9
Figure 9
Bovine serum albumin (BSA) and PA bound Mb. 1H NMR spectra from A) 0.8 mM MbCN B) MbCN:PA 1:1 C) MbCN:PA:BSA 1:1:1. PA binding to Mb reduces selectively the intensity of peaks u4 and u5. Upon addition of BSA, these peaks restore to their respective control level.
Figure 10
Figure 10
Bovine serum albumin (BSA) and 13C1 PA bound Mb. 13C NMR spectra from A) 0.8 mM MbCN B) MbCN: 13C1 PA 1:1 C) MbCN: 13C1 PA:BSA 1:1:1. PA binding to Mb introduces a signal at 182 ppm. Upon addition of BSA, the signal shifts to 184 ppm. 13C1 PA in BSA also shows a peak at 184 ppm (data not shown).
Figure 11
Figure 11
Adding BSA to a 1:1 PA:Mb solution reveals a partition coefficient of 16 for the Mb vs. BSA PA affinity.
Figure 12
Figure 12
Model of palmitate flux at low palmitate concentration: A) PA in Tris (0.8% solubility) B) FABP facilitated transport of fatty acid (50µM FABP, Kd=14nM) C) PA in the presence of Mb (41% solubility) D) Mb facilitated transport of PA (Mb=0.26mM, Kd=48µM). PA flux in the presence of Mb exceeds FABP facilitated PA flux above 0.07µM PA. Mb mediated transport of PA exceeds FABP-PA flux at PA concentration above 0.02 µM PA. The Vmax values per g tissue for FABP= 1.5 × 10⁻⁷ nmolcm2s−1g−1 for Mb=2.0 × 10⁻⁴ nmolcm2s−1g−1. The corresponding 1/2 Vmax for FABP= 7.5 × 10⁻⁸ nmolcm2s−1g−1 and for Mb =1.0 × 10⁻⁴ nmolcm2s1 −1 g .
Figure 13
Figure 13
Model of fatty acid flux at high palmitate concentration: A) FABP facilitated transport of fatty acid (50µM FABP, Kd=14nM) B) Mb facilitated transport of PA (Mb=0.26mM, Kd=48µM) C) Mb facilitated transport of PA (Mb=3.8 mM, Kd=48µM). The Vmax values per g tissue for Mb facilitated fatty acid transport in rat heart =2.0 × 10⁻⁴ nmolcm2s−1g−1 and in seal muscle = 30 × 10−4 nmolcm2s−1g−1

Similar articles

Cited by

References

    1. Beyer R, Fattore J. The influence of age and endurance exercise on the myoglobin concentration of skeletal muscle of the rat. Journal of Gerontology. 1984;39:525–530. - PubMed
    1. Bojesen IN, Bojesen E. Water-phase palmitate concentrations in equilibrium with albumin-bound palmitate in a biological system. J. Lipid Res. 1992;33:1327–1334. - PubMed
    1. Brooks GA, Mercier J. Balance of carbohydrate and lipid utilization during exercise: the "crossover" concept. J. Appl Physiol. 1994;76:2253–2261. - PubMed
    1. Burczynski FJ, Cai ZS. Palmitate uptake by hepatocyte suspensions: effect of albumin. Am. J. Physiol. 1994;267:G371–G379. - PubMed
    1. Burczynski FJ, Cai ZS, Moran JB, Forker EL. Palmitate uptake by cultured hepatocytes: albumin binding and stagnant layer phenomena. Am. J. Physiol. 1989;257:G584–G593. - PubMed

Publication types