

A versatile omnibus test for detecting mean and variance heterogeneity
- PMID: 24482837
- PMCID: PMC4019404
- DOI: 10.1002/gepi.21778
A versatile omnibus test for detecting mean and variance heterogeneity
Abstract
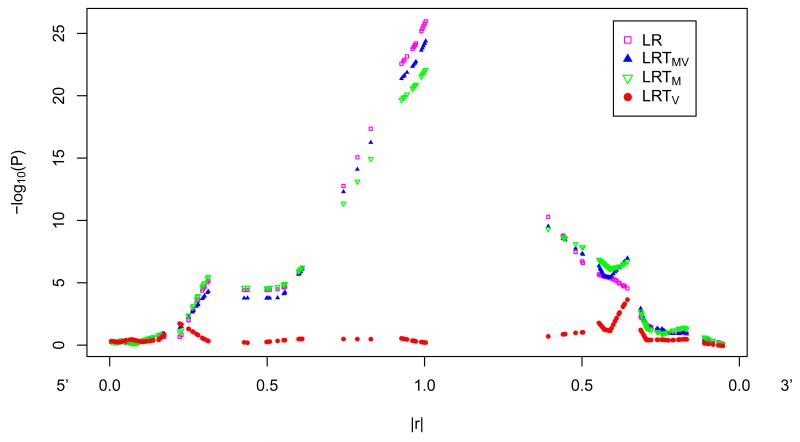
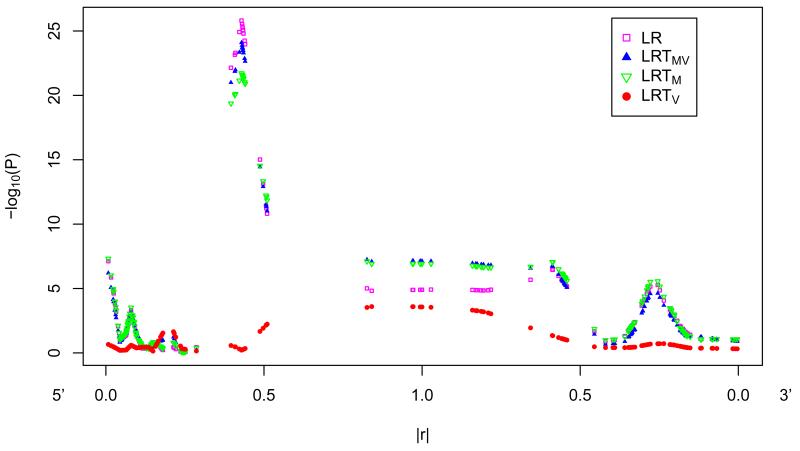
Recent research has revealed loci that display variance heterogeneity through various means such as biological disruption, linkage disequilibrium (LD), gene-by-gene (G × G), or gene-by-environment interaction. We propose a versatile likelihood ratio test that allows joint testing for mean and variance heterogeneity (LRT(MV)) or either effect alone (LRT(M) or LRT(V)) in the presence of covariates. Using extensive simulations for our method and others, we found that all parametric tests were sensitive to nonnormality regardless of any trait transformations. Coupling our test with the parametric bootstrap solves this issue. Using simulations and empirical data from a known mean-only functional variant, we demonstrate how LD can produce variance-heterogeneity loci (vQTL) in a predictable fashion based on differential allele frequencies, high D', and relatively low r² values. We propose that a joint test for mean and variance heterogeneity is more powerful than a variance-only test for detecting vQTL. This takes advantage of loci that also have mean effects without sacrificing much power to detect variance only effects. We discuss using vQTL as an approach to detect G × G interactions and also how vQTL are related to relationship loci, and how both can create prior hypothesis for each other and reveal the relationships between traits and possibly between components of a composite trait.
Figures
References
-
- Ansari AR, Bradley RA. Rank-sum tests for dispersions. The Annals of Mathematical Statistics. 1960;31:1174–1189.
-
- Balding DJ. The advance of Bayesian methods for genetic association analysis; Presented at the 59th Annual Meeting of The American Society of Human Genetics; Honolulu, HI. November 22, 2009.2009.
-
- Bartlett M. A note on the multiplying factors for various χ2 approximations. Journal of the Royal Statistical Society. Series B. 1954;16:296–298.
Publication types
MeSH terms
Substances
Grants and funding
LinkOut - more resources
Full Text Sources
Other Literature Sources
Research Materials
Miscellaneous
