. 2014 Feb;55(2):233-44.
doi: 10.1111/epi.12511. Epub 2014 Jan 31.

Increased cortical extracellular adenosine correlates with seizure termination

Affiliations

Increased cortical extracellular adenosine correlates with seizure termination

Jamie J Van Gompel et al. Epilepsia. 2014 Feb.

Erratum in

  • Epilepsia. 2014 Sep;55(9):1475

Abstract

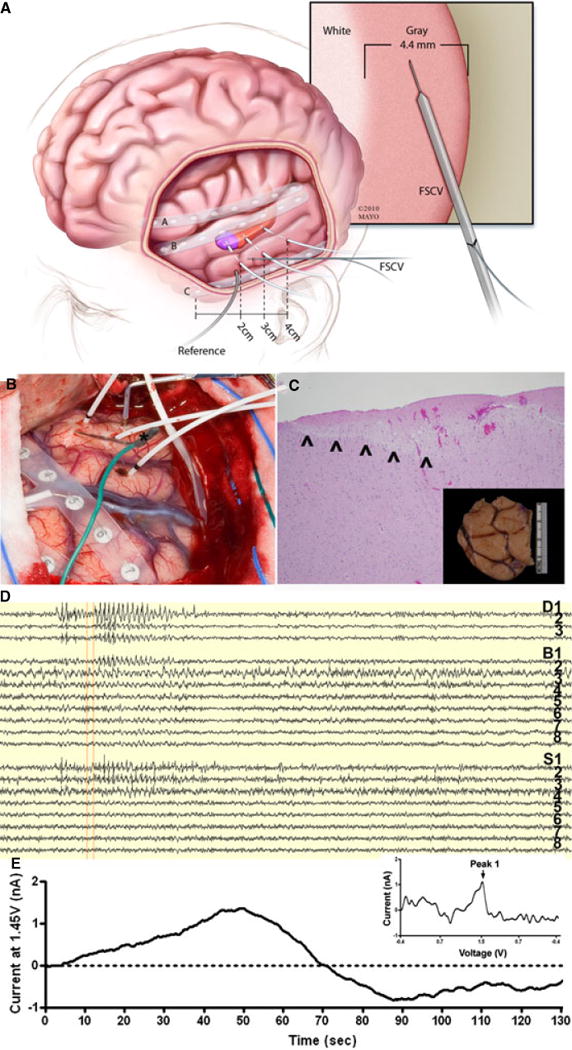
Objective: Seizures are currently defined by their electrographic features. However, neuronal networks are intrinsically dependent on neurotransmitters of which little is known regarding their periictal dynamics. Evidence supports adenosine as having a prominent role in seizure termination, as its administration can terminate and reduce seizures in animal models. Furthermore, microdialysis studies in humans suggest that adenosine is elevated periictally, but the relationship to the seizure is obscured by its temporal measurement limitations. Because electrochemical techniques can provide vastly superior temporal resolution, we test the hypothesis that extracellular adenosine concentrations rise during seizure termination in an animal model and humans using electrochemistry.

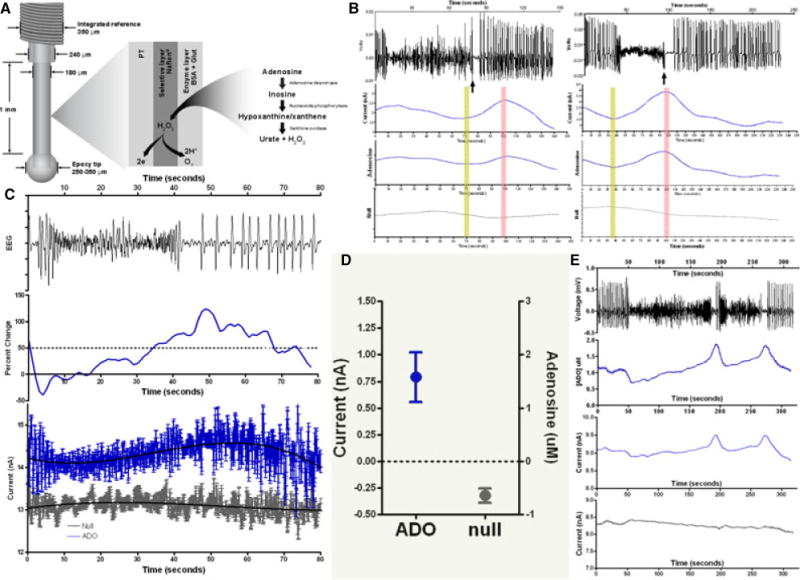
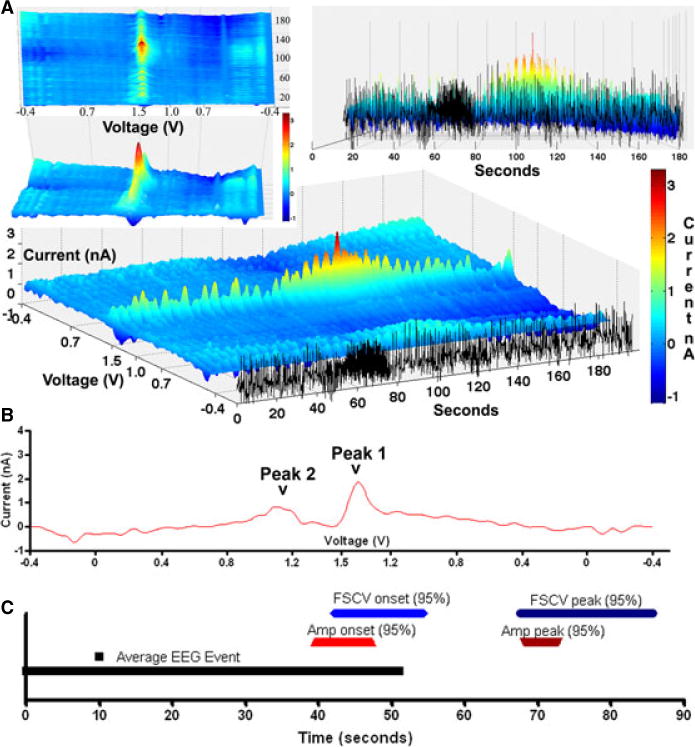
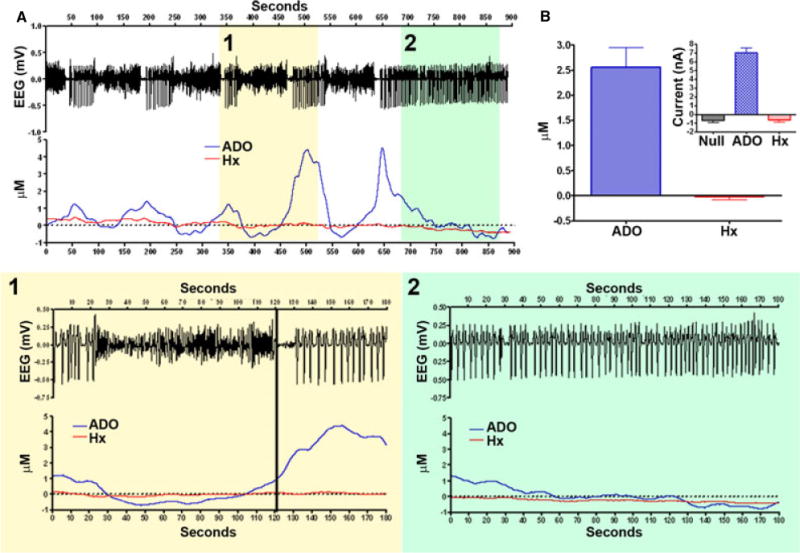
Methods: White farm swine (n = 45) were used in an acute cortical model of epilepsy, and 10 human epilepsy patients were studied during intraoperative electrocorticography (ECoG). Wireless Instantaneous Neurotransmitter Concentration Sensor (WINCS)-based fast scan cyclic voltammetry (FSCV) and fixed potential amperometry were obtained utilizing an adenosine-specific triangular waveform or biosensors, respectively.

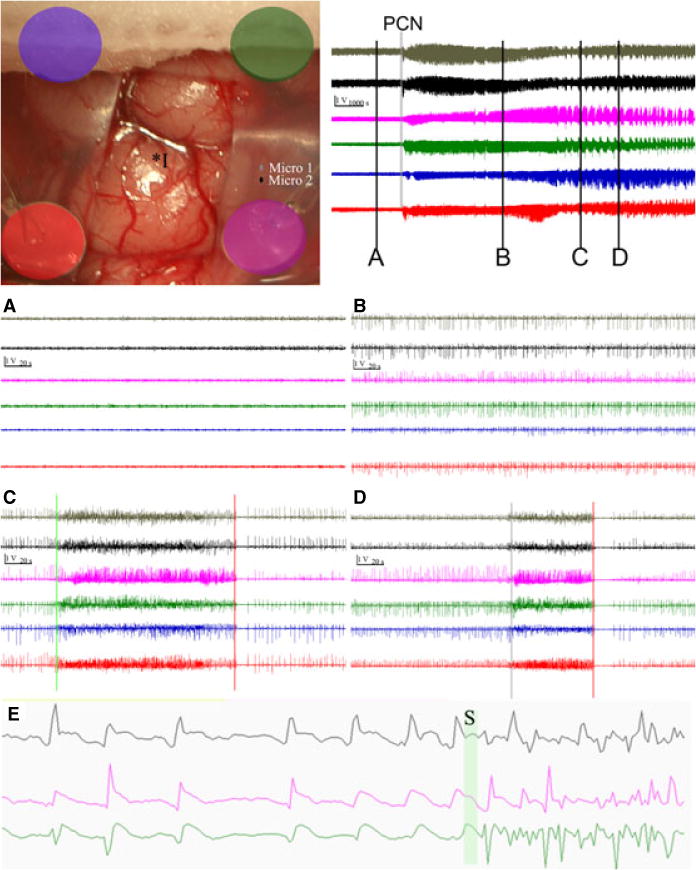
Results: Simultaneous ECoG and electrochemistry demonstrated an average adenosine increase of 260% compared to baseline, at 7.5 ± 16.9 s with amperometry (n = 75 events) and 2.6 ± 11.2 s with FSCV (n = 15 events) prior to electrographic seizure termination. In agreement with these animal data, adenosine elevation prior to seizure termination in a human patient utilizing FSCV was also seen.

Significance: Simultaneous ECoG and electrochemical recording supports the hypothesis that adenosine rises prior to seizure termination, suggesting that adenosine itself may be responsible for seizure termination. Future work using intraoperative WINCS-based FSCV recording may help to elucidate the precise relationship between adenosine and seizure termination.

Keywords: Adenosine; Amperometry; Electrochemistry; Epilepsy; Fast scan cyclic voltammetry; Human trial; Large animal model; Purine; Seizure.


Conflict of interest statement

Disclosures and Conflict of Interest: We confirm that we have read the Journal’s position on issues involved in ethical publication and affirm that this report is consistent with those guidelines. Author Kendall H. Lee has received support from: NIH (K08 NS052232, R01 NS 70872 and R01 NS075013), and Mayo Foundation (2008–2010 Research Early Career Development Award for Clinician Scientists award). Author Gregory A. Worrell has received support from NIH (R01 NS063039-01). Author Jamie J. Van Gompel received support from the Bernard and Irene Waterman Award in Individualized Medicine as well as the Epilepsy Foundation. The remaining authors Mark R. Bower, Matt Stead, Su-Youne Chang, Stephen Goerss, Inyong Kim, Kevin Bennet, Fredric B. Meyer, W. Richard Marsh, and Charles D. Blaha have no conflicts of interest or support to disclose. This publication was further supported by NIH/NCRR CTSA Grant Number UL1 RR024150. Its contents are solely the responsibility of the authors and do not necessarily represent the official views of the NIH.

Figures

Figure 1
Figure 1
upper left: Intraoperative picture of grid implantation and electrode setup. Color coded electrodes correspond to channels in attached EEG data. Position of PCN injection (I*) and microwire EEG channels (micro 1 and 2) are also shown. Upper right top: overall time course after injection (vertical bar is 1 volt, horizontal bar is 1000 seconds), bars with letter labels correspond to time for panels with appropriate letter below (vertical bar is 1 volt, horizontal is 20 seconds): grey bar labeled by PCN is the PCN injection. (A) grade 1 activity, EEG prior to injection of 5500 U of PCN (B) grade 2 activity, spiking seen for first 1–2 hours after PCN injection (C, D) examples of electrographic events (grade 3–4 activity) used to evaluate electrochemical data. Note the clear transition to synchronized activity greater than 3.5 Hz (green bars) and the most reliable time point for each event, the clear seizure stoppage with prolonged electrographic silence (red bars). (E) 10 seconds of EEG data from 1 microwire electrode (top) and two macrocontacts (bottom two) at increased magnification demonstrates the spike waveform. The green bar (S) represents a transition into an event.
Figure 2
Figure 2. Fixed potential amperometry (FPA) analysis of adenosine release during epileptiform events
Amperometric (FPA) analysis of acute seizure model in swine: (A) schematic drawing of the dimensions and enzymatic setup of the biosensor used to detect adenosine; (B) two separate examples of seizures (EEG top) (note there is little variation in the raw null signal (bottom grey), but the raw (adenosine) and differential (adenosine-conrtrol (null)) signal demonstrate an increase in relative adenosine). The rising adenosine signal (yellow bar) and peak (pink bar) are noted; (C) averaged adenosine response for 5 seizures: top represents EEG signal, middle graph represents the normalized response of differential adenosine recordings (intervening pink bars represent mean + SEM (error bars) of the onset of adenosine increase and peak signal relative to seizure pause); bottom represents mean ± SD of the raw signal with blue the adenosine, grey control (null), and black lines the mean polynomial fit for this data; (D) 95% confidence interval for average peak values of adenosine (left y-axis nA, right is uM) and null. As expected there is a decrease in signal across time in the control (null) (grey), but also a marked increase in the adenosine concentration; (E) example of one event in which there were two pauses, each of which is associated with a unique adenosine increase.
Figure 3
Figure 3. Fast scan cyclic voltammetry (FSCV) analysis of epileptiform events
Time-locked FSCV and EEG: (A) Example of a epileptiform event evaluated by FSCV synchronized to EEG data with 3D mesh plots of the continuous data with the x axis representing seconds, the black tracing set apart, representing ne channel of EEG data, the y axis representing the voltage (V) of voltammogram scans starting at −0.4 to 1.5 (mid-y axis) to −0.4; and the z-axis representing the current (nA). Note after termination of the terminates, there is an elevation in the current at 1.5 V; (B) unfolded voltammogram demonstrating the unique Peak 1 (1.5V) and Peak 2 (1.0V) increases consistent with adenosine; (C) timeline showing average length of EEG event (black line), 95% CI of the onset and peaks of FSCV (blue) (n=15) and a comparative technique, amperometry (red) (n=75).
Figure 4
Figure 4. Biosensor amperometric separation of adenosine and hypoxanthene (Hx) during epileptiform events
(A) Continuous fixed potential amperometry (FPA) recording over 900 seconds demonstrating 5 epileptiform events in which (1) represents a higher magnification of such an event, and (2) shows continuous spiking at the end. Note there is little variation in Hx, but adenosine consistently varies with the epileptiform activity; (B) adenosine and Hx micromolar change with event termination, 95% CI for adenosine is 1.7 to 3.4 μM and for Hx is −0.2 to 0.1. Inset shows variation in raw current (nA) of the FPA recordings. Note that there is a general decrement with null and Hx as is typical with amperometry.
Figure 5
Figure 5. Human Intraoperative Fast Scan Cyclic Voltammetry (FSCV) Recording
Representative intraoperative human FSCV recorded by the wireless instantaneous neurochemical concentration sensing system (WINCS): (A) a schematic demonstrating the human intraoperative implantation, experimental setup, illustrating the implantation depth electrophysiology electrodes and glass-insulated CFM in the gray matter of temporal cortex targeted for resection for seizure control; (B) intraoperative photo of human surgery utilizing FSCV. A glass capillary carbon fiber microelectrode (*green wire) is delivered into the lateral neocortex near the electrocorticography electrode S3 during pre-lobectomy electrocorticography. FSCV is performed relative to a stainless steel electrode. There is an eight contact strip over the inferior temporal gyrus (right of exposure), an eight contact strip over the superior temporal gyrus (most visible in center of exposure) and a separate strip is over the interior frontal lobe. There are 3 mesial temporal depths in the exposure (white leads) penetrating the middle temporal gyrus; (C) 10x hematoxylin and eosin stain of electrode insertion site on pathology. Note the entire FSCV electrode tract is within grey matter (inset shows the gross anterior temporal lobe specimen with methylene blue at the insertion site); (D) 140 seconds of electrocorticography demonstrating spontaneous epileptiform activity with that from 7 to 30 seconds most prominent in the mesial temporal lobe (D1–3) with associated lateral neocortical activity (S1–3). (E) Current (at 1.45 V or Peak 1 of adenosine) vs. time plot corresponding in time to the above (D) EEG. Note there appears to be an increase in Peak 1 of adenosine with the peak near the termination of this epileptiform event in patient 2. Inset: unfolded voltammogram of the signal at 53 seconds, when scanning from −0.4 to 1.5, showing a unique oxidation peak at 1.45 Volts.

References

    1. Boison D. The adenosine kinase hypothesis of epileptogenesis. Progress in Neurobiology. 2008;84:249–62. - PMC - PubMed
    1. Boison D. Adenosine as a neuromodulator in neurological diseases. Current Opinion in Pharmacology. 2008;8:2–7. - PMC - PubMed
    1. Boison D. Adenosine as a modulator of brain activity. Drug News & Perspectives. 2007;20:607–11. - PubMed
    1. Boison D. Adenosine kinase, epilepsy and stroke: mechanisms and therapies. Trends in Pharmacological Sciences. 2006;27:652–8. - PubMed
    1. Aden U, O’Connor WT, Berman RF. Changes in purine levels and adenosine receptors in kindled seizures in the rat. Neuroreport. 2004;15:1585–9. - PubMed

Publication types