

Lactobacillus GG restoration of the gliadin induced epithelial barrier disruption: the role of cellular polyamines
- PMID: 24483336
- PMCID: PMC3911798
- DOI: 10.1186/1471-2180-14-19
Lactobacillus GG restoration of the gliadin induced epithelial barrier disruption: the role of cellular polyamines
Abstract
Background: Celiac disease is characterized by enhanced intestinal paracellular permeability due to alterations of function and expression of tight junction (TJ) proteins including ZO-1, Claudin-1 and Occludin. Polyamines are pivotal in the control of intestinal barrier function and are also involved in the regulation of intercellular junction proteins. Different probiotic strains may inhibit gliadin-induced toxic effects and the Lactobacillus rhamnosus GG (L.GG) is effective in the prevention and treatment of gastrointestinal diseases. Aims of the study were to establish in epithelial Caco-2 cells whether i) gliadin affects paracellular permeability and polyamine profile; ii) co-administration of viable L.GG, heat-killed L.GG (L.GG-HK) or its conditioned medium (L.GG-CM) preserves the intestinal epithelial barrier integrity. Additionally, the effects of L.GG on TJ protein expression were tested in presence or absence of polyamines.
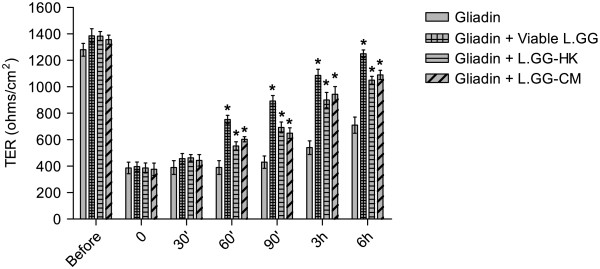
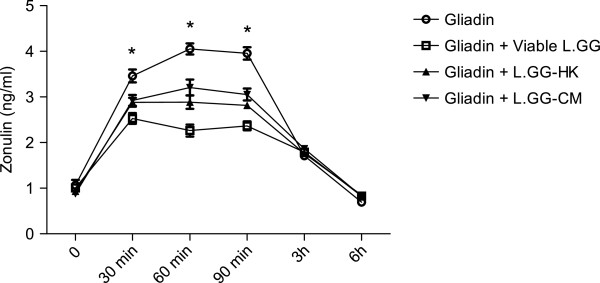
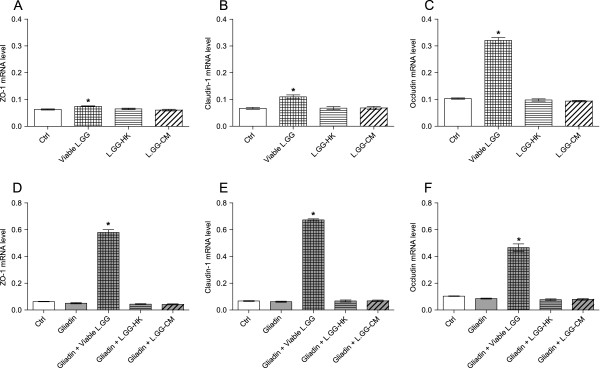
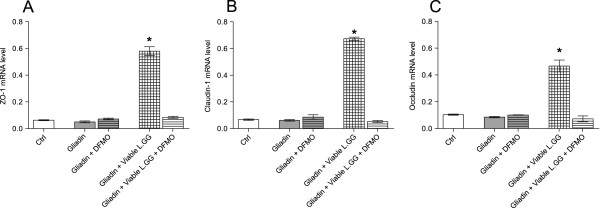
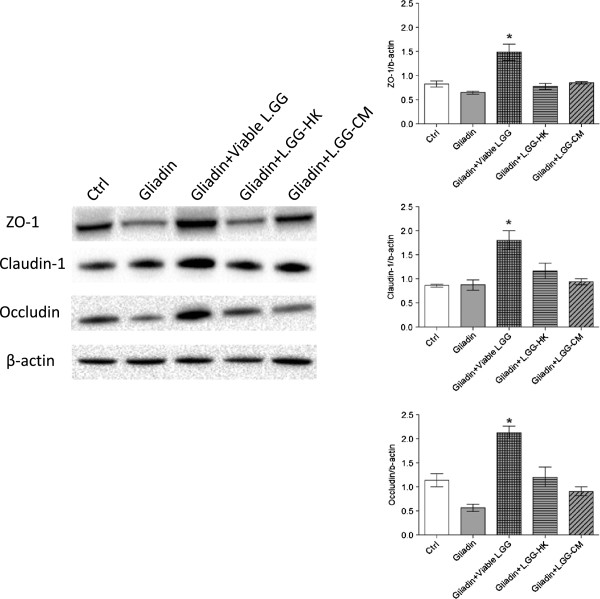
Results: Administration of gliadin (1 mg/ml) to Caco-2 cells for 6 h caused a significant alteration of paracellular permeability as demonstrated by the rapid decrease in transepithelial resistance with a concomitant zonulin release. These events were followed by a significant increase in lactulose paracellular transport and a slight lowering in ZO-1 and Occludin expression without affecting Claudin-1. Besides, the single and total polyamine content increased significantly. The co-administration of viable L.GG (10(8) CFU/ml), L.GG-HK and L.GG-CM with gliadin significantly restored barrier function as demonstrated by transepithelial resistance, lactulose flux and zonulin release. Viable L.GG and L.GG-HK, but not L.GG-CM, led to a significant reduction in the single and total polyamine levels. Additionally, only the co-administration of viable L.GG with gliadin significantly increased ZO-1, Claudin-1 and Occludin gene expression compared to control cells. When Caco-2 cells treated with viable L.GG and gliadin were deprived in the polyamine content by α-Difluoromethylornithine, the expression of TJ protein mRNAs was not significantly different from that in controls or cells treated with gliadin alone.
Conclusions: Gliadin modifies the intestinal paracellular permeability and significantly increases the polyamine content in Caco-2 cells. Concomitant administration of L.GG is able to counteract these effects. Interestingly, the presence of cellular polyamines is necessary for this probiotic to exert its capability in restoring paracellular permeability by affecting the expression of different TJ proteins.
Figures
Similar articles
-
Lactobacillus rhamnosus GG Protects the Epithelial Barrier of Wistar Rats from the Pepsin-Trypsin-Digested Gliadin (PTG)-Induced Enteropathy.Nutrients. 2018 Nov 7;10(11):1698. doi: 10.3390/nu10111698. Nutrients. 2018. PMID: 30405050 Free PMC article.
-
Lactobacillus rhamnosus strain GG prevents enterohemorrhagic Escherichia coli O157:H7-induced changes in epithelial barrier function.Infect Immun. 2008 Apr;76(4):1340-8. doi: 10.1128/IAI.00778-07. Epub 2008 Jan 28. Infect Immun. 2008. PMID: 18227169 Free PMC article.
-
Gliadin, zonulin and gut permeability: Effects on celiac and non-celiac intestinal mucosa and intestinal cell lines.Scand J Gastroenterol. 2006 Apr;41(4):408-19. doi: 10.1080/00365520500235334. Scand J Gastroenterol. 2006. PMID: 16635908
-
Effect of lactobacilli on paracellular permeability in the gut.Nutrients. 2011 Jan;3(1):104-17. doi: 10.3390/nu3010104. Epub 2011 Jan 12. Nutrients. 2011. PMID: 22254077 Free PMC article. Review.
-
Intestinal permeability and its regulation by zonulin: diagnostic and therapeutic implications.Clin Gastroenterol Hepatol. 2012 Oct;10(10):1096-100. doi: 10.1016/j.cgh.2012.08.012. Epub 2012 Aug 16. Clin Gastroenterol Hepatol. 2012. PMID: 22902773 Free PMC article. Review.
Cited by
-
Probiotics to Prevent Celiac Disease and Inflammatory Bowel Diseases.Adv Exp Med Biol. 2024;1449:95-111. doi: 10.1007/978-3-031-58572-2_6. Adv Exp Med Biol. 2024. PMID: 39060733 Review.
-
Microbial interventions in yak colibacillosis: Lactobacillus-mediated regulation of intestinal barrier.Front Cell Infect Microbiol. 2024 Feb 6;14:1337439. doi: 10.3389/fcimb.2024.1337439. eCollection 2024. Front Cell Infect Microbiol. 2024. PMID: 38390621 Free PMC article.
-
The potential role of adherence factors in probiotic function in the gastrointestinal tract of adults and pediatrics: a narrative review of experimental and human studies.Gut Microbes. 2022 Jan-Dec;14(1):2149214. doi: 10.1080/19490976.2022.2149214. Gut Microbes. 2022. PMID: 36469568 Free PMC article. Review.
-
In vitro Effects of Bacterial Exposure on Secretion of Zonulin Family Peptides and Their Detection in Human Tissue Samples.Front Microbiol. 2022 Apr 14;13:848128. doi: 10.3389/fmicb.2022.848128. eCollection 2022. Front Microbiol. 2022. PMID: 35495638 Free PMC article.
-
An In Vitro Study on Mitochondrial Compensatory Response Induced by Gliadin Peptides in Caco-2 Cells.Int J Mol Sci. 2019 Apr 15;20(8):1862. doi: 10.3390/ijms20081862. Int J Mol Sci. 2019. PMID: 30991726 Free PMC article.
References
MeSH terms
Substances
LinkOut - more resources
Full Text Sources
Other Literature Sources
Molecular Biology Databases
