. 2014 Oct 20;21(12):1675-92.
doi: 10.1089/ars.2013.5597. Epub 2014 Mar 12.

Concomitant inactivation of foxo3a and fancc or fancd2 reveals a two-tier protection from oxidative stress-induced hydrocephalus

Affiliations

Concomitant inactivation of foxo3a and fancc or fancd2 reveals a two-tier protection from oxidative stress-induced hydrocephalus

Xiaoli Li et al. Antioxid Redox Signal. .

Abstract

Aims: This study seeks at investigating the cause of hydrocephalus, and at identifying therapeutic targets for the prevention of hydrocephalus.

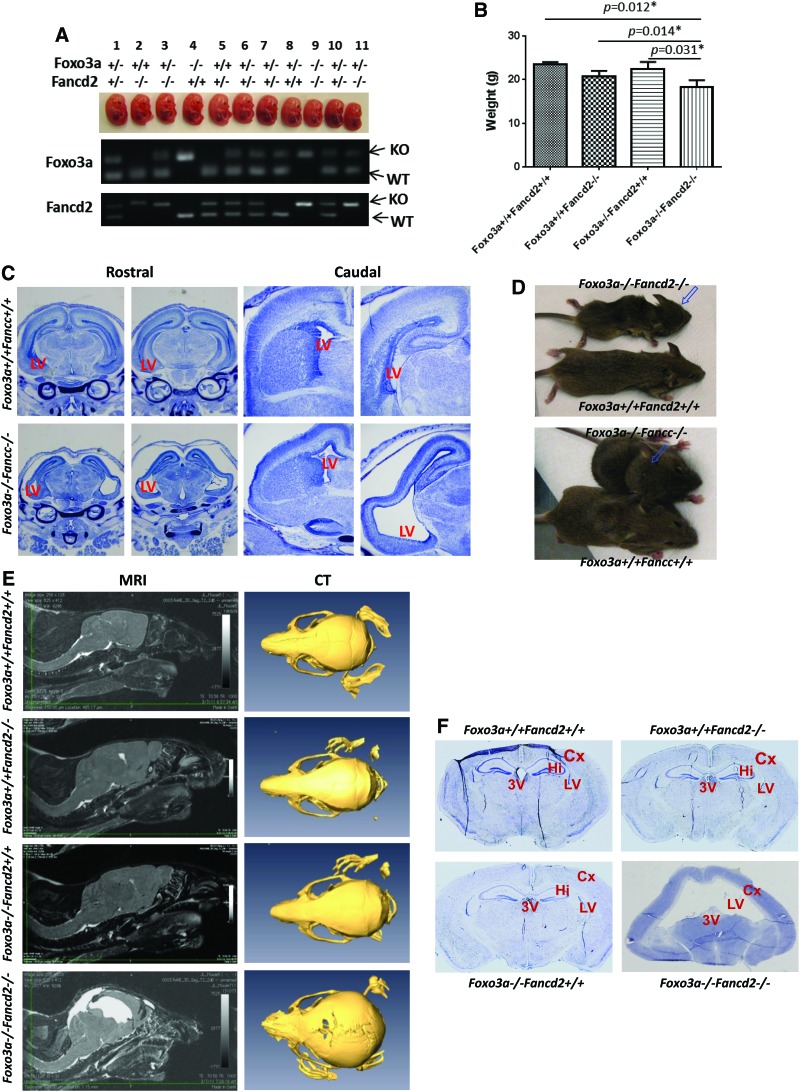
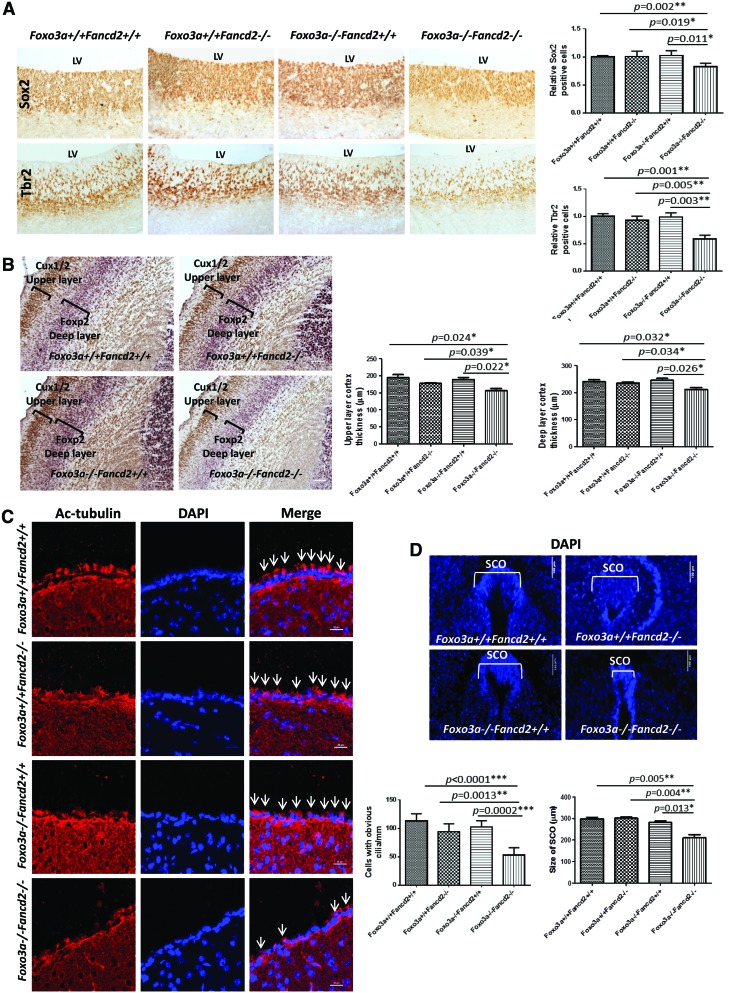
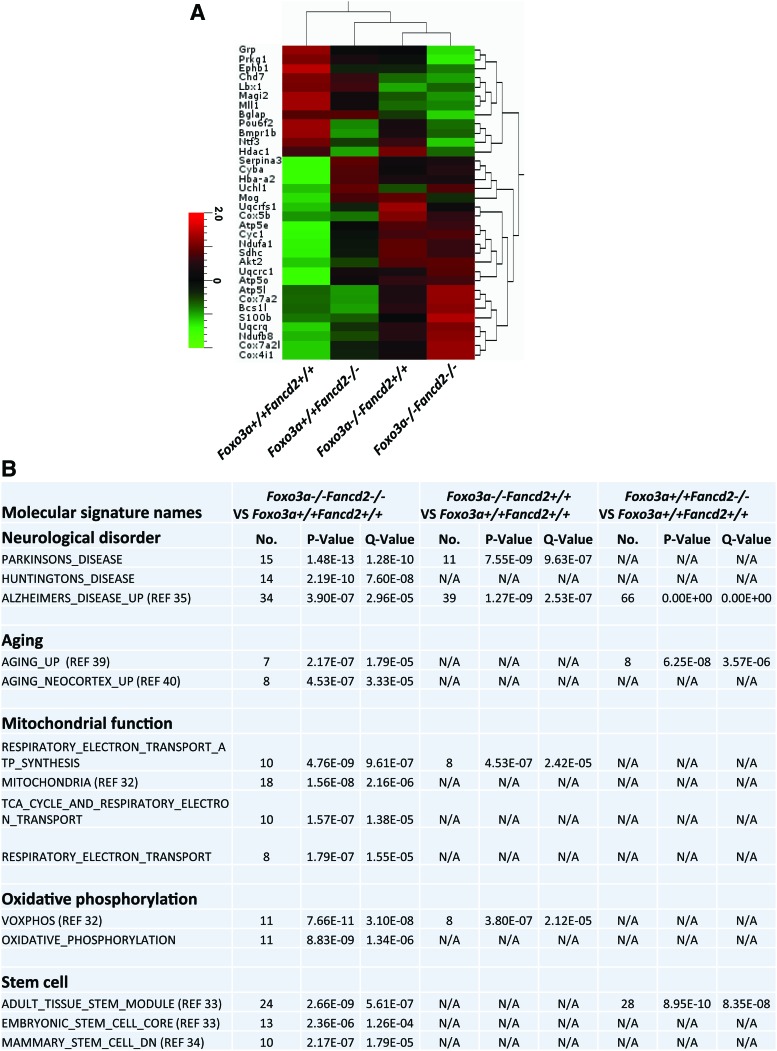
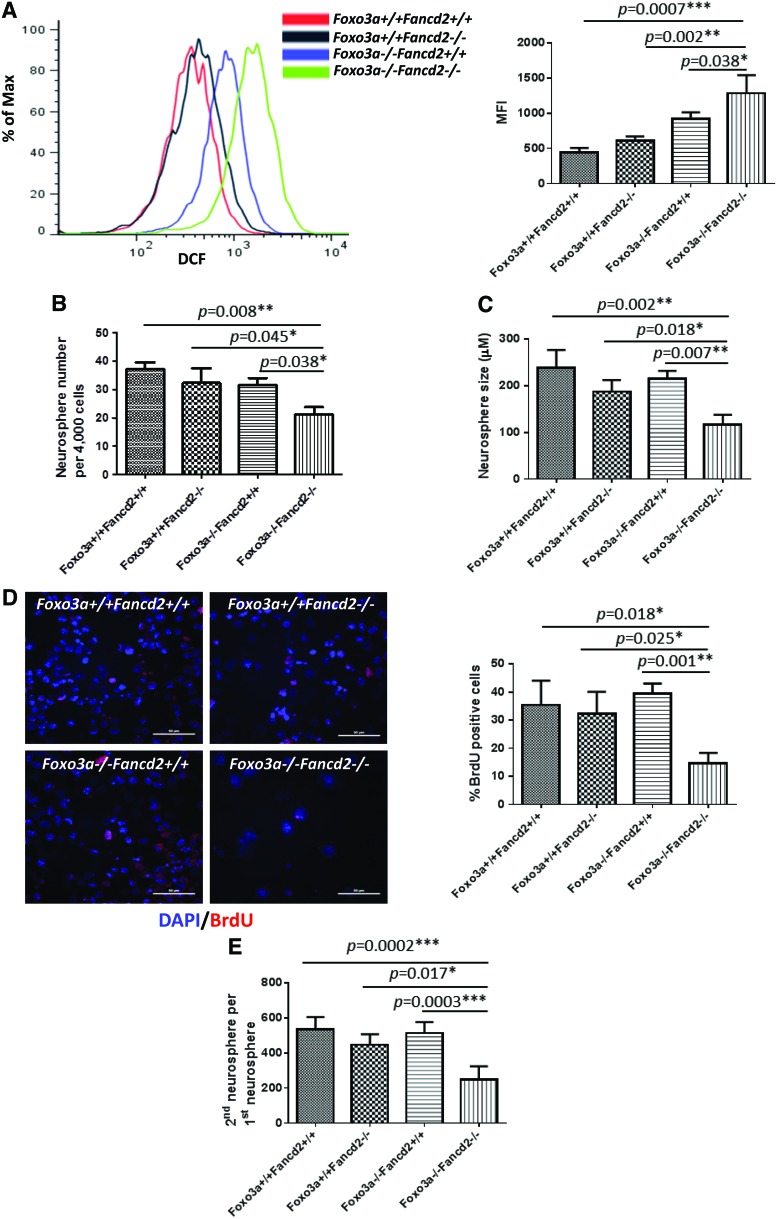
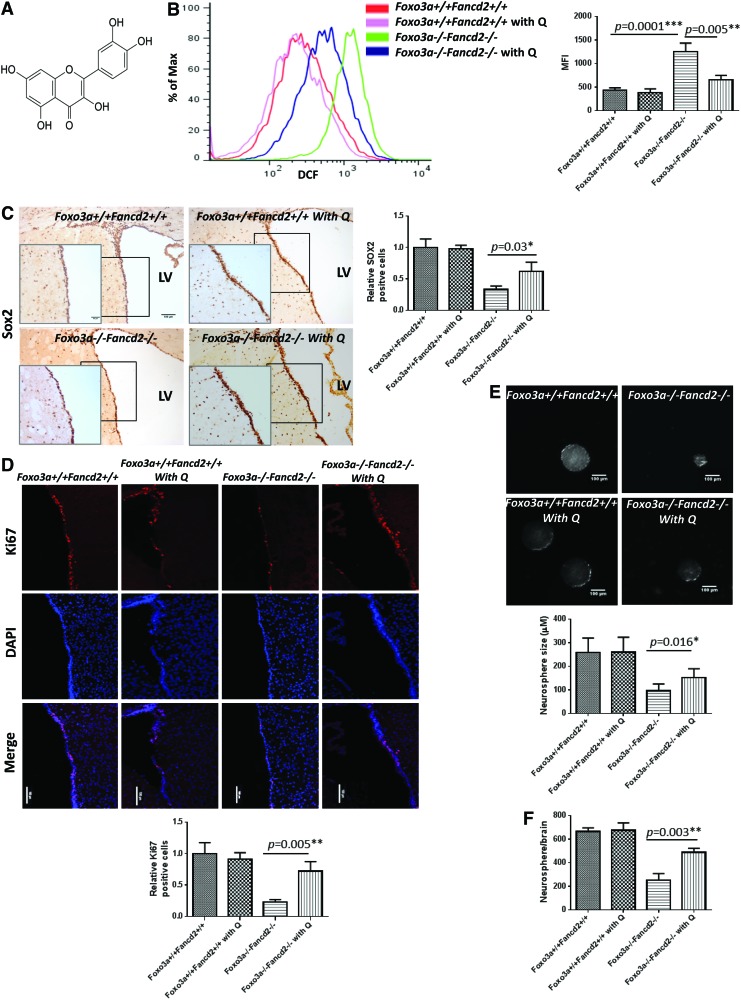
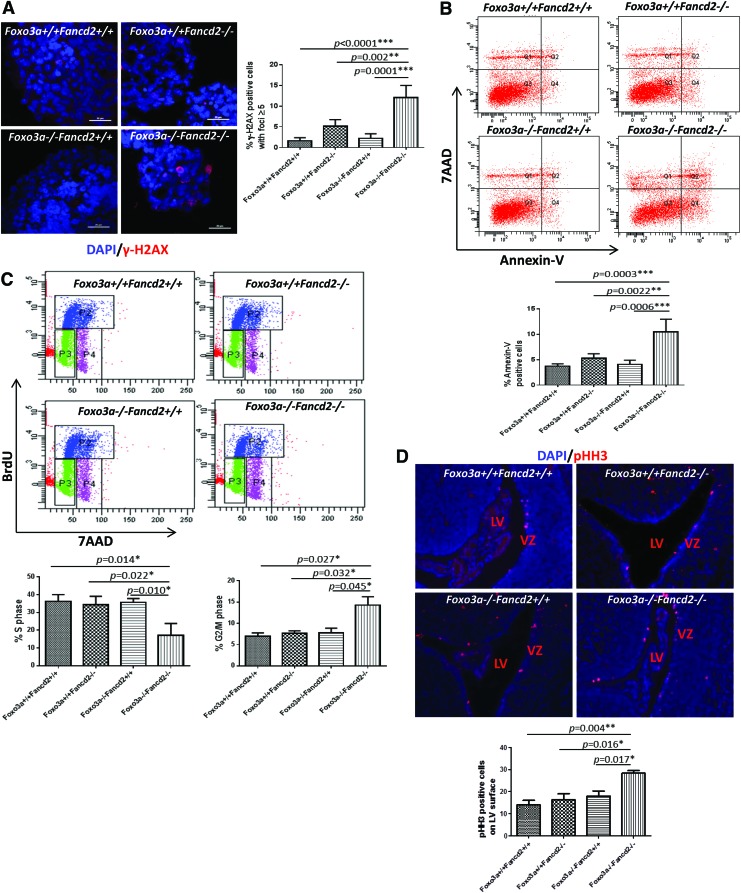
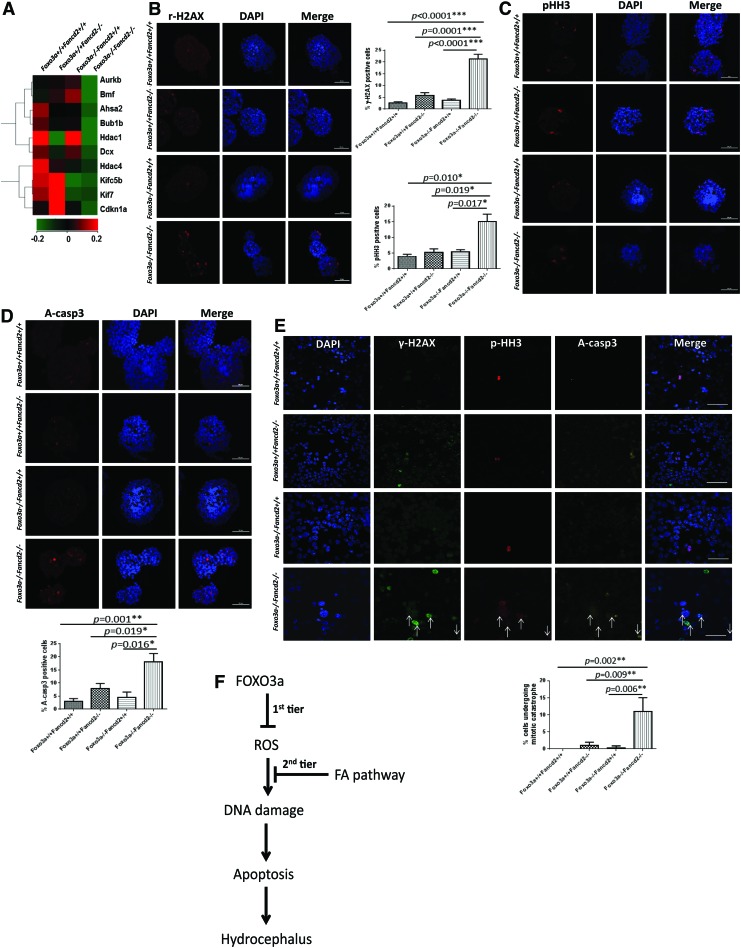
Results: In this study, we show that inactivation of the Foxo3a gene in two mouse models of Fanconi anemia (FA) leads to the development of hydrocephalus in late embryonic stage and after birth. More than 50% of Foxo3a(-/-) Fancc(-/-) or Foxo3a(-/-) Fancd2(-/-) mice die during embryonic development or within 6 months of life as a result of hydrocephalus characterized by cranial distortion, dilation of the ventricular system, reduced thickness of the cerebral cortex, and disorganization of the ependymal cilia and subcommissural organ. Combined deficiency of Foxo3a and Fancc or Fancd2 not only impairs the self-renewal capacity but also markedly increases the apoptosis of neural stem and progenitor cells (NSPCs), leading to defective neurogenesis. Increased accumulation of reactive oxygen species (ROS) and subsequently de-regulated mitosis and ultimately apoptosis in the neural stem or progenitor cells is identified as one of the potential mechanisms of congenital obstructive hydrocephalus.

Innovation: The work unravels a two-tier protective mechanism for preventing oxidative stress-induced hydrocephalus.

Conclusion: The deletion of Foxo3a in FA mice increased the accumulation of ROS and subsequently de-regulated mitosis and ultimately apoptosis in the NSPCs, leading to hydrocephalus development.


Figures

<b>FIG. 1.</b>
FIG. 1.
Deletion of Foxo3a in FA mice leads to embryonic lethality and hydrocephalus. (A) A representative image of E13.5 littermates from a Foxo3a+/− Fancd2+/− breeder and genotyping of the embryos. (B) The body weight of 6-week-old WT, Fancd2−/− SKO, Foxo3a−/− SKO, and Foxo3a−/− Fancd2−/− DKO mice. (C) Nissl staining of serial rostral (r) to caudal (c) coronal sections of E18.5 brain with each pair of sections representing approximately the same coronal plane. (D) Dome-shaped head was shown in both Foxo3a−/− Fancd2−/− and Foxo3a−/− Fancc−/− DKO mice. (E) MRI and CT scanning of WT, Fancd2−/− SKO, Foxo3a−/− SKO, and Foxo3a−/− Fancd2−/− DKO mice. The DKO mouse showed increased CSF volume, enlarged LV, and increased diameter of brain skull. (F) Nissel staining of the coronal adult brain sections of the WT, Fancd2−/− SKO, Foxo3a−/− SKO, and Foxo3a−/− Fancd2−/− DKO mice. LV, lateral ventricle; 3V, third ventricle; Hi, hippocampus; Cx, cortex; CSF, cerebrospinal fluid; FA, Fanconi anemia; DKO, double knockout; SKO, single knockout; WT, wild type; MRI, magnetic resonance imaging; CT, computerized tomography. To see this illustration in color, the reader is referred to the web version of this article at www.liebertpub.com/ars
<b>FIG. 2.</b>
FIG. 2.
Decreased NSPCs in Foxo3a−/− Fancd2−/− DKO mice. (A) Sox2 and Tbr2 staining of the coronal brain sections from WT, SKO, and DKO E13.5 embryos. Scale bar represents 50 μm. The bar graph (right) shows quantitation of SOX2-positive cells in the VZ area (n=5). (B) The thickness of upper layer cortex (stained by Cux1/2) and deeper layer cortex (stained by Foxp2) in the WT, SKO, and DKO E18.5 embryos was measured (n=5). Scale bar represents 25 μm. (C) Ependymal cilia were examined at P5 by staining for Ac-tubulin. Scale bar represents 20 μm. (D) Representative DAPI staining of the SCO of WT, SKO, and DKO E18.5 embryos, and quantitation showing a greatly reduced size of the SCO of DKO brain (n=5). Scale bar represents 100 μm. Quantitation is compared between WT, SKO, and DKO embryos (n=5). *p<0.05; **p<0.01. NSPC, neural stem and progenitor cell; Ac-tubulin, acetylated α-tubulin; SCO, subcommissural organ; VZ, ventricle zone. To see this illustration in color, the reader is referred to the web version of this article at www.liebertpub.com/ars
<b>FIG. 3.</b>
FIG. 3.
Deregulated expression of genes in ROS metabolism, mitochondrial function, stem cell proliferation, and neurogenesis in DKO brains. Whole-genome microarray data were obtained from 2-month-old WT, SKO, and DKO brain tissues. (A) Heat-map presentation of differentially expressed genes in altered pathway of neurogenesis, NSCs, neurological disorder, oxidative phosphorylation, and mitochondrial dysfunction in the DKO mouse brain. (B) Selected publicly available molecular signature highly enriched for genes up-regulated or down-regulated in DKO brain tissue as provided by GSEA (gene set enrichment analysis). ROS, reactive oxygen species; NSC, neural stem cell. To see this illustration in color, the reader is referred to the web version of this article at www.liebertpub.com/ars
<b>FIG. 4.</b>
FIG. 4.
Foxo3a−/− Fancd2−/− DKO NSCs show increased ROS and decreased self-renewal potential. (A) ROS production in WT, SKO, and DKO neurospheres isolated from E12.5 embryos. Cells were treated with DCF-DA, and ROS production was examined by flow cytometry. (B) Primary neurospheres formed by NSCs from E12.5 embryos of the indicated genotypes. The number of neurospheres formed 1 week after seeding was counted. Values represent mean±SD from three independent experiments with n=5 for each genotype. (C) Size of primary neurospheres described in (B). Values represent mean±SD from three independent experiments with n=5 for each genotype. (D) Primary neurospheres were dissociated, single-cell suspensions were cultured for 24 h in medium that was supplemented with 10 μM BrdU, and level of BrdU incorporation was determined by BrdU immunostaining. Scale bar represents 100 μm. (E) Defective secondary neurosphere formation of DKO NSCs. Dissociated cells from the primary neurospheres described in (B) were cultured for 1 week, and the number of secondary neurospheres was counted. Values represent mean±SD from three independent experiments with n=5 for each genotype. *p<0.05; **p<0.01; and ***p<0.001. DCF-DA, 2′-7′-dichlorofluorescein diacetate. To see this illustration in color, the reader is referred to the web version of this article at www.liebertpub.com/ars
<b>FIG. 5.</b>
FIG. 5.
Quercetin rescues embryonic lethality and NSC defects of DKO mice. (A) Chemical structure of Quercetin (3,5,7,3′,4′-pentahydroxy-flavone). (B) ROS production in the SVZ area of 2-month-old normal diet-feeding or Quercetin diet-feeding WT and Foxo3a−/− Fancd2−/− DKO mice. Cells were labeled with DCF-DA, and ROS production was examined by flow cytometry. Right panel, quantification of ROS levels in mice described in the left panel (n=5). (C) Sox2 staining of LV area of the 2-month-old normal diet-feeding or Quercetin diet-feeding WT and Foxo3a−/− Fancd2−/− DKO mice. Original magnification,×20; insert,×40.×20 scale bar: 100 μm;×40 scale bar: 50 μm. The bar graph (right) shows quantitation (n=5). Quercetin diet-feeding DKO mice demonstrated more SOX2-positive cells when compared with normal diet-feeding DKO mice. (D) Ki67-positive cells in the LV area of 2-month-old normal diet-feeding or Quercetin diet-feeding WT and Foxo3a−/− Fancd2−/− DKO mice. Scale bar represents 100 μm. Bottom panel, quantification of Ki67-positive cells in mice described in the left panel (n=5). Quercetin diet-feeding DKO mice demonstrated more Ki67-positive NSCs when compared with normal diet-feeding DKO mice. (E, F) Size and self-renewal ability of neurosphere from the SVZ area of 2-month-old normal diet-feeding or Quercetin diet-feeding WT and Foxo3a−/− Fancd2−/− DKO mice. Neurospheres formed by SVZ cells from Quercetin-fed DKO mice exhibited a significant increase in average diameter compared with normal diet-fed controls (E; n=5). Scale bar represents 100 μm. The number of neurospheres formed by SVZ NSCs of Quercetin-fed DKO mice was twofold higher than the neurospheres derived from normal-diet-fed mice (F; n=5). P2: S phase; P3: G1 phase; P4: G2/M phase. *p<0.05; **p<0.01; and ***p<0.001. SVZ, subventricular zone. To see this illustration in color, the reader is referred to the web version of this article at www.liebertpub.com/ars
<b>FIG. 6.</b>
FIG. 6.
Increased DNA damage, apoptosis, and mitosis in DKO NSCs. (A) γ-H2AX staining of neurospheres formed by WT, Foxo3a−/− SKO, Fancd2−/− SKO, and Foxo3a−/− Fancd2−/− DKO NSCs. Right panel, quantification of cells with γ-H2AX foci ≥5 described in the left panel (n=5). Scale bar represents 20 μm. (B) Flow cytometric analysis of apoptotic cells in the neurospheres formed by WT, Foxo3a−/− SKO, Fancd2−/− SKO, and Foxo3a−/− Fancd2−/− DKO NSCs. Bottom panel, quantification of Annexin V-positive cells (n=5). (C) Cell-cycle analysis by BrdU incorporation of the NSCs in the neurospheres formed by WT, Foxo3a−/− SKO, Fancd2−/− SKO, and Foxo3a−/− Fancd2−/− DKO NSCs. Bottom panels, quantification of cells in the S and G2/M phases (n=5). (D) pHH3 staining of E18.5 embryo brain sections of mice with the indicated genotypes. Original magnification,×20. Bottom panel, quantification of dividing (pHH3-positive) cells on the ventricular surface of cortices in WT, SKO, and DKO brains at E18.5 (n=5). *p<0.05; **p<0.01; and ***p<0.001. pHH3, phospho-histone H3. To see this illustration in color, the reader is referred to the web version of this article at www.liebertpub.com/ars
<b>FIG. 7.</b>
FIG. 7.
DKO NSCs display mitotic catastrophe. (A) Heat map of mitotic catastrophe-related genes in WT, SKO, and DKO brains. The expression levels of those genes are lower in DKO mice than in WT mice. (B) Primary neurospheres formed by the indicated NSCs were stained for γ-H2AX. Scale bar represents 50 μm. (C) Primary neurospheres formed by the indicated NSCs were stained for pHH3. Scale bar represents 50 μm. (D) Primary neurospheres formed by the indicated NSCs were stained for A-casp3. Scale bar represents 50 μm. (E) NSCs suspensions were stained for γ-H2AX, pHH3, A-casp3, and nuclear DNA. Cells simultaneously expressing γ-H2AX, pHH3, and A-casp3 are interpreted as mitotic catastrophe (indicated by arrows). Scale bar represents 50 μm. Panels with quantification are presented as mean±SD from three independent experiments with n=5 for each genotype. *p<0.05; **p<0.01. A-casp3, active-caspase-3. To see this illustration in color, the reader is referred to the web version of this article at www.liebertpub.com/ars

Similar articles

Cited by

References

    1. Bani-Yaghoub M, Tremblay RG, Lei JX, Zhang D, Zurakowski B, Sandhu JK, Smith B, Ribecco-Lutkiewicz M, Kennedy J, Walker PR, and Sikorska M. Role of Sox2 in the development of the mouse neocortex. Dev Biol 295: 52–66, 2006 - PubMed
    1. Banizs B, Pike MM, Millican CL, et al. . Dysfunctional cilia lead to altered ependyma and choroid plexus function, and result in the formation of hydrocephalus. Development 132: 5329–5339, 2005 - PubMed
    1. Blalock EM, Geddes JW, Chen KC, Porter NM, Markesbery WR, and Landfield PW. Incipient Alzheimer's disease: microarray correlation analyses reveal major transcriptional and tumor suppressor responses. Proc Natl Acad Sci U S A 101: 2173–2178, 2004 - PMC - PubMed
    1. Brunet A, Sweeney LB, Sturgill JF, et al. . Stress-dependent regulation of FOXO transcription factors by the SIRT1 deacetylase. Science 303: 2011–2015, 2004 - PubMed
    1. Caner H, Atasever A, Kilinc K, Durgun B, Peker S, and Ozcan OE. Lipid peroxide level increase in experimental hydrocephalus. Acta Neurochir (Wien) 121: 68–71, 1993 - PubMed

Publication types

MeSH terms

Substances