. 2014 Jan 31:14:53.
doi: 10.1186/1471-2334-14-53.

A metabolic biosignature of early response to anti-tuberculosis treatment

Affiliations

A metabolic biosignature of early response to anti-tuberculosis treatment

Sebabrata Mahapatra et al. BMC Infect Dis. .

Abstract

Background: The successful treatment of tuberculosis (TB) requires long-term multidrug chemotherapy. Clinical trials to evaluate new drugs and regimens for TB treatment are protracted due to the slow clearance of Mycobacterium tuberculosis (Mtb) infection and the lack of early biomarkers to predict treatment outcome. Advancements in the field of metabolomics make it possible to identify metabolic profiles that correlate with disease states or successful chemotherapy. However, proof-of-concept of this approach has not been provided for a TB-early treatment response biosignature (TB-ETRB).

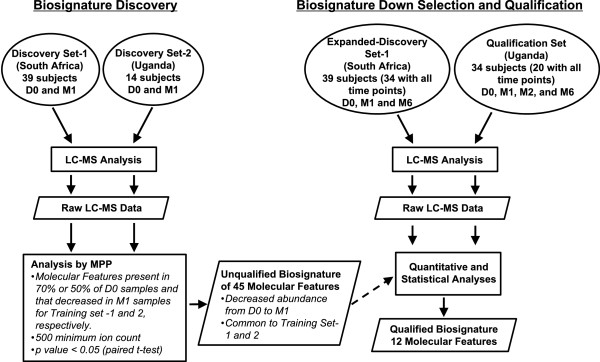
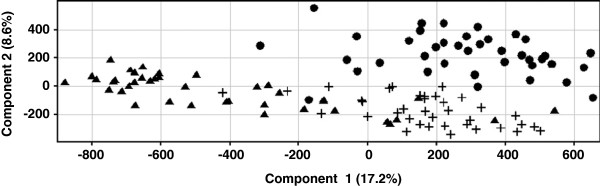
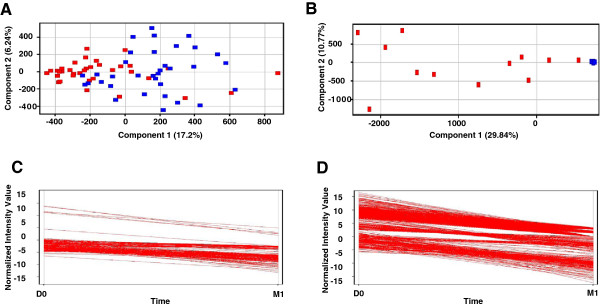
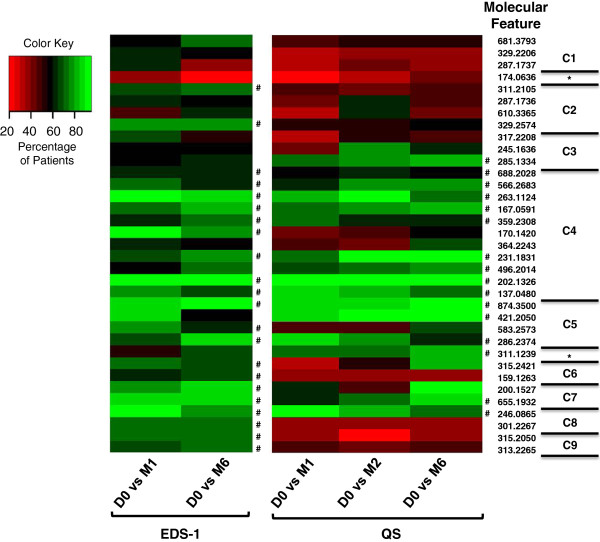
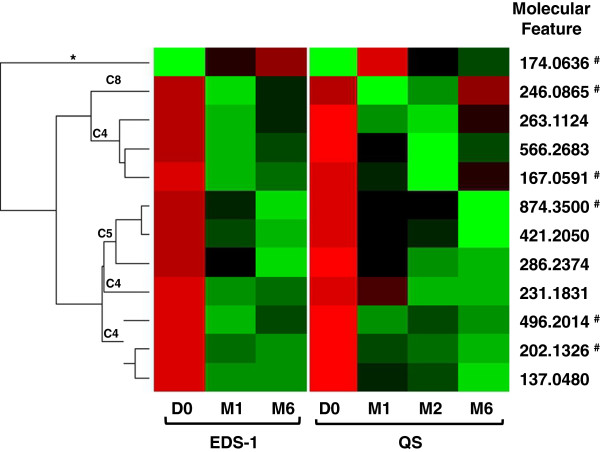
Methods: Urine samples collected at baseline and during treatment from 48 Ugandan and 39 South African HIV-seronegative adults with pulmonary TB were divided into discovery and qualification sets, normalized to creatinine concentration, and analyzed by liquid chromatography-mass spectrometry to identify small molecule molecular features (MFs) in individual patient samples. A biosignature that distinguished baseline and 1 month treatment samples was selected by pairwise t-test using data from two discovery sample sets. Hierarchical clustering and repeated measures analysis were applied to additional sample data to down select molecular features that behaved consistently between the two clinical sites and these were evaluated by logistic regression analysis.

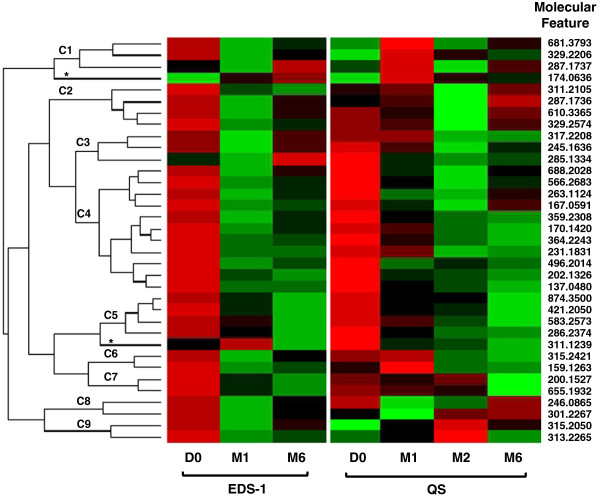
Results: Analysis of discovery samples identified 45 MFs that significantly changed in abundance at one month of treatment. Down selection using an extended set of discovery samples and qualification samples confirmed 23 MFs that consistently changed in abundance between baseline and 1, 2 and 6 months of therapy, with 12 MFs achieving statistical significance (p < 0.05). Six MFs classified the baseline and 1 month samples with an error rate of 11.8%.

Conclusions: These results define a urine based TB-early treatment response biosignature (TB-ETRB) applicable to different parts of Africa, and provide proof-of-concept for further evaluation of this technology in monitoring clinical responses to TB therapy.


Figures

Figure 1
Figure 1
Work flow for the development and qualification of a urine metabolite biosignature of TB treatment response. Biosignature discovery (left) utilized D0 and M1 samples from two distinct geographical locations. This yielded 45 MFs that decreased in abundance between D0 and M1. Biosignature down selection and qualification (right) also used samples from two geographically distinct locations and expanded the analyses to additional time points after the start of anti-TB therapy.
Figure 2
Figure 2
Unsupervised PCA of D0 (triangle), M1 (circle), and M6 (cross) samples from South African patients. The PCA was constructed based on MFs that were present in at least 60% of the samples for any given time point and differed in abundance between time points by at least 2 fold with a p < 0.05.
Figure 3
Figure 3
Unsupervised PCA of D0 (triangle) and M1 (circle) patient samples, and MFs demonstrating a decrease in abundance after the start of anti-TB treatment. The PCAs were constructed based on MFs present in at least 70% and 50% of the samples for any given time point of Discovery Set-1 (A) and Discovery Set-2 (B), respectively, and that decreased in abundance between D0 and M1 by at least 2 fold with a p < 0.05. A k-means clustering analysis was performed to select MFs that decreased in abundance between D0 and M1 of Discovery Set-1 (C) and Discovery Set-2 (D).
Figure 4
Figure 4
Heat map of 35 MFs showing the change in abundance across multiple time point. A cluster analysis was performed on log2 transformed averaged abundances of individual MFs at each time point for samples of Expanded Discovery Set-1 (EDS-1) and the Qualification Set (QS). MFs are displayed in rows and noted by the monoisotopic mass of the MF. Columns display time points. Visual analysis of the heat map revealed four clusters (C1, C3, C6, C9) of MFs that behaved dissimilarly between qualification sets; five clusters (C2, C4, C5, C7, C8) of MFs that behaved similarly between qualification sets; and two MFs (*) that did not fit into a specific cluster because of the low abundance at D0. Red indicates high abundance, green indicates low abundance.
Figure 5
Figure 5
Heat map based on the percentage of patients that demonstrated a decreased abundance in each of the 35 MFs between D0 and other time points. The MFs are ordered based on the clusters identified in Figure  3, and the MF clusters are noted to the right of the individual MFs that are designated by their monoisotopic mass. The Expanded Discovery Set-1 (EDS-1) and the Qualification Set (QS) were evaluated separately for the percent of patients demonstrating a decrease in MF abundance. # indicates MFs that consistently decreased in abundance from D0 in at least 60% of the patients for all time points of a sample group. The exact patient percentages used to derive this graphical representation are provided in Additional file 3.
Figure 6
Figure 6
Heat map of 12 MFs determined to have the highest statistical significance in both the Expanded Discovery Set-1 (EDS-1) and Qualification Set (QS). The heat map displays change in abundance across multiple time point (columns) for each MF (rows). The MFs were arranged based on clustering analysis (left) and the associated clusters identified in Figure  4 are noted (C4, C5, C8 and *). #indicates the molecular features identified by logistic regression analysis that classify D0 and M1 samples with an error rate of 11.8%.

Similar articles

Cited by

References

    1. Wallis RS, Kim P, Cole S, Hanna D, Andrade BB, Maeurer M, Schito M, Zumla A. Tuberculosis biomarkers discovery: developments, needs, and challenges. Lancet Infect Dis. 2013;14(4):362–372. doi: 10.1016/S1473-3099(13)70034-3. - DOI - PubMed
    1. Wallis RS, Pai M, Menzies D, Doherty TM, Walzl G, Perkins MD, Zumla A. Biomarkers and diagnostics for tuberculosis: progress, needs, and translation into practice. Lancet. 2010;14(9729):1920–1937. doi: 10.1016/S0140-6736(10)60359-5. - DOI - PubMed
    1. Perrin FM, Lipman MC, McHugh TD, Gillespie SH. Biomarkers of treatment response in clinical trials of novel antituberculosis agents. Lancet Infect Dis. 2007;14(7):481–490. doi: 10.1016/S1473-3099(07)70112-3. - DOI - PubMed
    1. Nahid P, Saukkonen J, Mac Kenzie WR, Johnson JL, Phillips PP, Andersen J, Bliven-Sizemore E, Belisle JT, Boom WH, Luetkemeyer A. et al.CDC/NIH workshop. Tuberculosis biomarker and surrogate endpoint research roadmap. Am J Respir Crit Care Med. 2011;14(8):972–979. doi: 10.1164/rccm.201105-0827WS. - DOI - PMC - PubMed
    1. Walzl G, Ronacher K, Djoba Siawaya JF, Dockrell HM. Biomarkers for TB treatment response: challenges and future strategies. J Infect. 2008;14(2):103–109. doi: 10.1016/j.jinf.2008.06.007. - DOI - PubMed

Publication types

LinkOut - more resources