. 2014 Feb 1:15:92.
doi: 10.1186/1471-2164-15-92.

The chromatin architectural proteins HMGD1 and H1 bind reciprocally and have opposite effects on chromatin structure and gene regulation

Affiliations

The chromatin architectural proteins HMGD1 and H1 bind reciprocally and have opposite effects on chromatin structure and gene regulation

Narasimharao Nalabothula et al. BMC Genomics. .

Abstract

Background: Chromatin architectural proteins interact with nucleosomes to modulate chromatin accessibility and higher-order chromatin structure. While these proteins are almost certainly important for gene regulation they have been studied far less than the core histone proteins.

Results: Here we describe the genomic distributions and functional roles of two chromatin architectural proteins: histone H1 and the high mobility group protein HMGD1 in Drosophila S2 cells. Using ChIP-seq, biochemical and gene specific approaches, we find that HMGD1 binds to highly accessible regulatory chromatin and active promoters. In contrast, H1 is primarily associated with heterochromatic regions marked with repressive histone marks. We find that the ratio of HMGD1 to H1 binding is a better predictor of gene activity than either protein by itself, which suggests that reciprocal binding between these proteins is important for gene regulation. Using knockdown experiments, we show that HMGD1 and H1 affect the occupancy of the other protein, change nucleosome repeat length and modulate gene expression.

Conclusion: Collectively, our data suggest that dynamic and mutually exclusive binding of H1 and HMGD1 to nucleosomes and their linker sequences may control the fluid chromatin structure that is required for transcriptional regulation. This study provides a framework to further study the interplay between chromatin architectural proteins and epigenetics in gene regulation.


Figures

Figure 1
Figure 1
HMGD and H1 are associated with euchromatic and heterochromatic fractions respectively. (A) Salt fractionation of chromatin procedure. (B) Western blot of H1 and HMGD1 in heterochromatic (P2) and euchromatic (S2) chromatin fractions. We digested chromatin from S2 nuclei with micrococcal nuclease and fractionated it to yield supernatant (S2) and pellet (P2) fractions. The western blot shows that H1 is primarily found in the heterochromatic fraction (P2) and HMGD1 is primarily found in the euchromatic fraction (S2). The histone mark H4K16ac is a positive marker for active euchromatin and the histone H4 antibody is used as a chromatin loading marker. (C) Ethidium bromide stained 3.3% Nusieve™ agarose gel showing the DNA associated with the S2 (magnesium-soluble) and P (magnesium-insoluble) fractions. (D) Sucrose gradient fractionation procedure. (E) Western blot analysis of H1 and HMGD1 released from MNase-digested chromatin from S2 cells. The 6 – 40% sucrose gradient reveals that H1 is bound to the heavier heterochromatin, while HMGD1 is bound to the lighter euchromatin.
Figure 2
Figure 2
Density of HMGD1 and H1 across different chromosomes and genomic regions in S2 cells. (A) Density of midpoints from mapped HMGD1 and H1 ChIP-seq reads on each chromosome. (B) Density of HMGD1 and H1 ChIP-seq reads in different genomic regions: promoters (defined as 1 kb upstream and downstream of TSSs), exons, introns, and intergenic regions in the D. melanogaster genome. “Upstream” and “Downstream” regions are defined as 1 kb upstream and 1 kb downstream of the transcription start site, respectively.
Figure 3
Figure 3
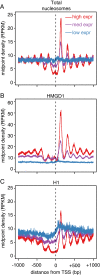
HMGD1 is enriched around the promoters of active genes and H1 is depleted. (A) Density of total nucleosome midpoints from S2 cells around transcription start sites (TSSs). Midpoints are aggregated across genes with high, medium and low expression. (B) Density of HMGD1 ChIP-seq midpoints around TSSs in S2 cells for genes with high, medium and low expression. (C) Density of H1 ChIP-seq midpoints around TSSs in S2 cells for genes with high, medium and low expression.
Figure 4
Figure 4
HMGD1 and H1 are correlated with gene expression. (A) Scatter plots of normalized HMGD1 and (B) H1 versus RNA-seq gene expression. Each data point represents a single gene. The HMGD1 rate is the log2 ratio of HMGD1 midpoints to total nucleosome midpoints from the promoter region -100 to +500 bp. The H1 rate is calculated similarly but for the region -550 to +50 bp. (C) Pearson correlations of RNA-seq gene expression with HMGD1 (red), H1 (blue), total nucleosome (black) or the HMGD1/H1 ratio (green). The correlations are computed for non-overlapping genomic regions corresponding roughly to the locations of well-positioned nucleosomes and the nucleosome depleted region (NDR). Vertical line segments represent 95% confidence intervals for the correlations.
Figure 5
Figure 5
HMGD1 and H1 density are correlated with distance from DNaseI hypersensitive sites. Box plots show (A) the distribution of HMGD1 and (B) H1 densities calculated from non-overlapping 1 kb regions. The box represents the inter-quartile range of the distribution and the bar represents the median. The whiskers extend to the most extreme data point that is no more than 1.5 times the interquartile range from the box. Regions are grouped by their distance to the nearest DNase I hypersensitive site (DHS). (C) Distributions of HMGD1/H1 ratio for DHS regions less than 2 kb from the nearest annotated TSS.
Figure 6
Figure 6
Hierarchical clustering of HMGD1 and H1 with histone post-translational modifications at TSSs. The colors in the heat map indicate the pairwise correlation between histone PTM signals from ChIP-chip experiments, H1 density and HMGD1 density. Correlations were computed from 2 kb regions centered on the TSSs of annotated genes. Blue indicates negative correlation, white indicates no correlation and orange to red indicates positive correlation.
Figure 7
Figure 7
Nucleosome repeat length (NRL) is associated with HMGD1/H1 ratio. (A) Density of total nucleosome MNase-seq midpoints as a function of distance from an anchor midpoint. The genome was divided into non-overlapping 1 kb regions from which anchor midpoints were taken. Regions were stratified by HMGD/H1 quintile, as indicated by the colored lines. (B) Plot of the peak position versus the peak number. The NRL for each HMGD/H1 quintile is estimated from the slope of a line fit by least-squares.
Figure 8
Figure 8
HMGD1 and H1 knockdown reciprocally mediate higher order chromatin structure leading to changes in distinct gene expression outcomes. (A) S2 cells were treated with the indicated siRNA for 48 hours and knockdown (KD) was validated by western blot. For the H1 KD, there was a ~40% reduction in H1 protein levels; for the HMGD1 KD, there was a ~90% reduction in HMGD1 protein levels. (B) Relative occupancy of HMGD1 and H1 as measured by ChIP-qPCR at promoters that were initially bound by H1 and HMGD1. Relative occupancy was computed by setting the IgG control to 1. (C) Gene expression changes measured by RT-qPCR following HMGD1 or H1 knockdown in S2 cells. Expression was normalized to β-actin levels and fold change in expression was calculated by setting the expression in the mock control to 1. In (B) and (C), error bars are mean ± SD from three independent experiments. Using a student t-test, the p values from all experiments were significant with values ranging from p = 1.35 × 10-4 to p = 2.87 × 10-8(D) Nucleosome repeat length changes caused by KD of H1 or HMGD1. S2 nuclei (5 × 106) were digested with 25 units of MNase for 1, 3, 5, 7 and 10mins. Purified DNA from these digests was run on a 3.3% Nusieve™ agarose gel. M indicates DNA ladders. Red stars indicate the nucleosome ladders. A decrease in H1 levels decreased the nucleosome repeat length by ~24 bp. Knockdown of HMGD1 increased the nucleosome repeat length by ~7 bp.

References

    1. Luger K, Mader AW, Richmond RK, Sargent DF, Richmond TJ. Crystal structure of the nucleosome core particle at 2.8 A resolution. Nature. 1997;15:251–260. doi: 10.1038/38444. - DOI - PubMed
    1. Richmond TJ, Davey CA. The structure of DNA in the nucleosome core. Nature. 2003;15:145–150. doi: 10.1038/nature01595. - DOI - PubMed
    1. Thoma F, Koller T, Klug A. Involvement of histone H1 in the organization of the nucleosome and of the salt-dependent superstructures of chromatin. J Cell Biol. 1979;15:403–427. doi: 10.1083/jcb.83.2.403. - DOI - PMC - PubMed
    1. Allan J, Hartman PG, Crane-Robinson C, Aviles FX. The structure of histone H1 and its location in chromatin. Nature. 1980;15:675–679. doi: 10.1038/288675a0. - DOI - PubMed
    1. Crane-Robinson C, Ptitsyn OB. Binding of the globular domain of linker histones H5/H1 to the nucleosome: a hypothesis. Protein Eng. 1989;15:577–582. doi: 10.1093/protein/2.8.577. - DOI - PubMed

Publication types

MeSH terms