. 2014 Feb 1:15:24.
doi: 10.1186/1471-2369-15-24.

Resolution of the three dimensional structure of components of the glomerular filtration barrier

Affiliations

Resolution of the three dimensional structure of components of the glomerular filtration barrier

Kenton P Arkill et al. BMC Nephrol. .

Abstract

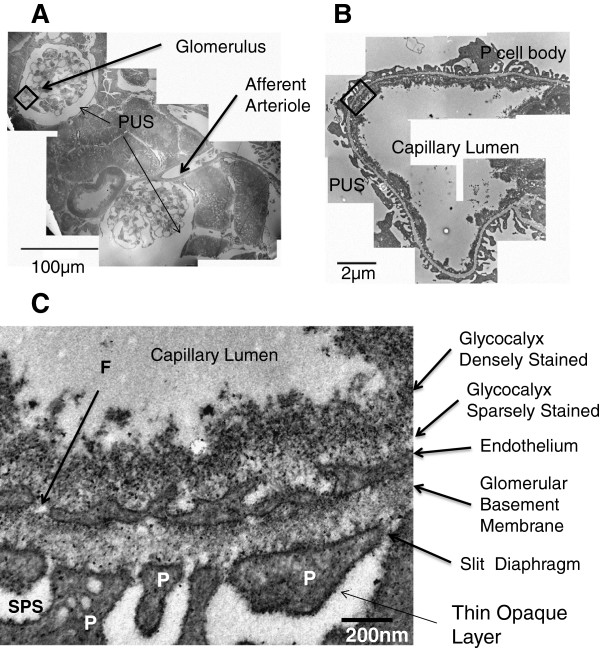
Background: The human glomerulus is the primary filtration unit of the kidney, and contains the Glomerular Filtration Barrier (GFB). The GFB had been thought to comprise 3 layers - the endothelium, the basement membrane and the podocyte foot processes. However, recent studies have suggested that at least two additional layers contribute to the function of the GFB, the endothelial glycocalyx on the vascular side, and the sub-podocyte space on the urinary side. To investigate the structure of these additional layers is difficult as it requires three-dimensional reconstruction of delicate sub-microscopic (<1 μm) cellular and extracellular elements.

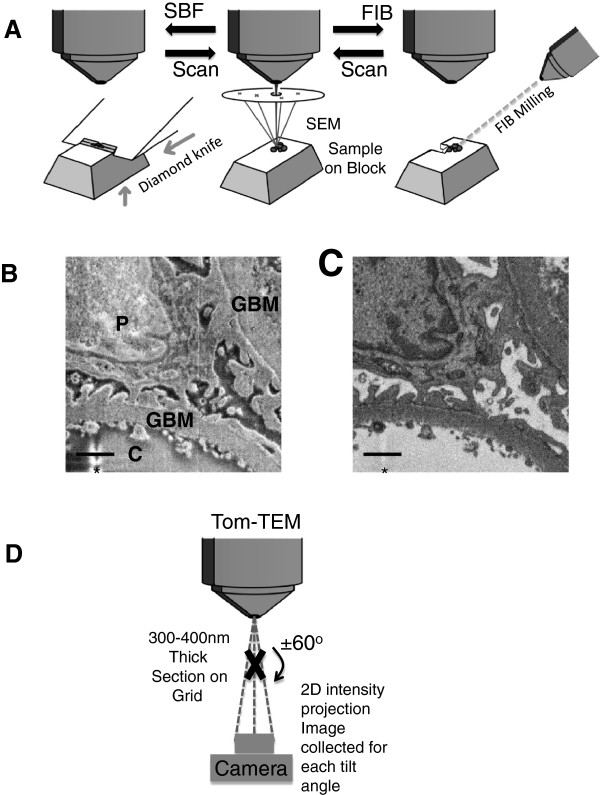
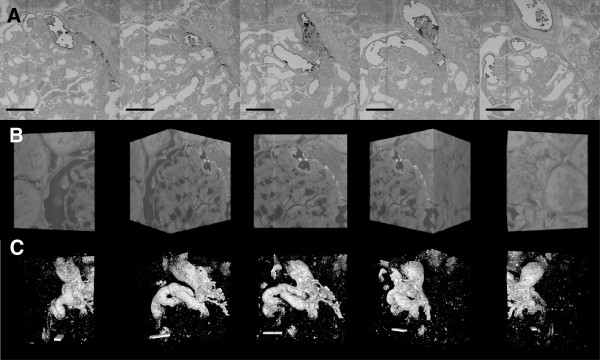
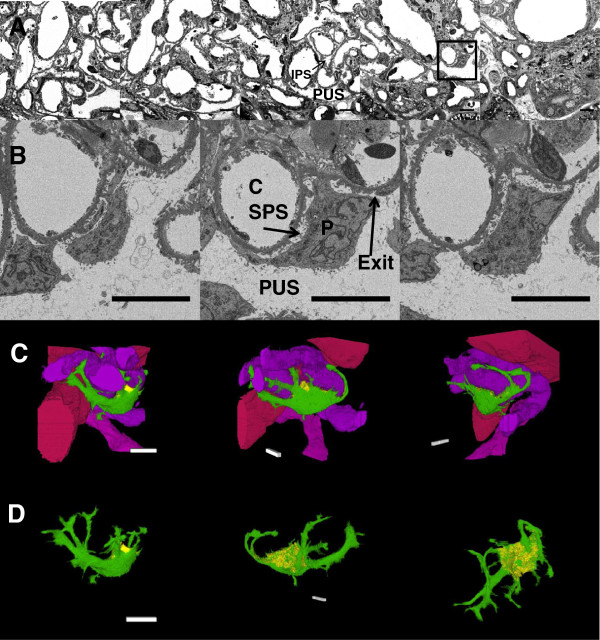
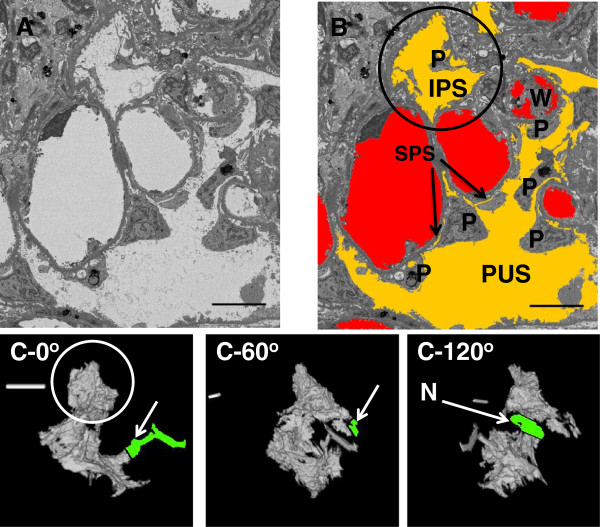
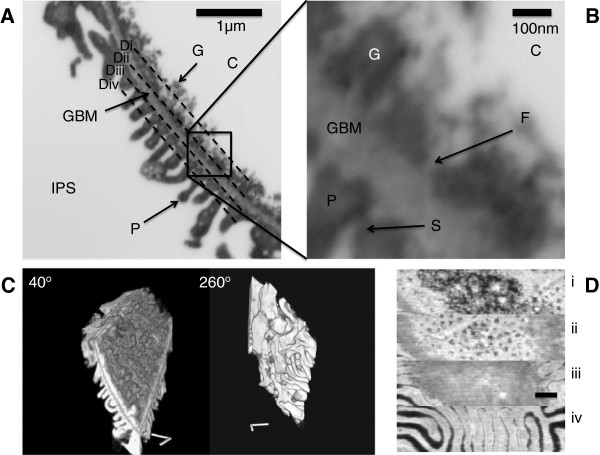
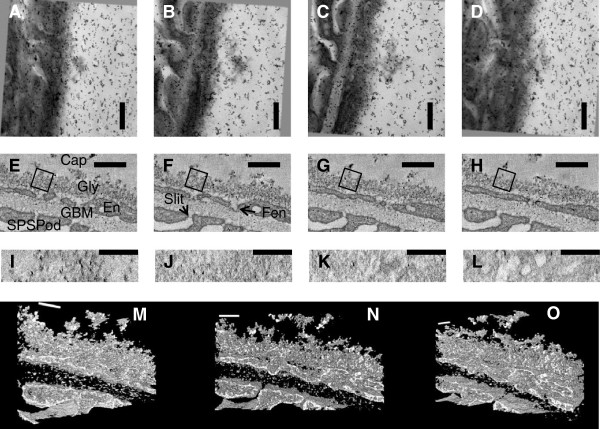
Methods: Here we have combined three different advanced electron microscopic techniques that cover multiple orders of magnitude of volume sampled, with a novel staining methodology (Lanthanum Dysprosium Glycosaminoglycan adhesion, or LaDy GAGa), to determine the structural basis of these two additional layers. Serial Block Face Scanning Electron Microscopy (SBF-SEM) was used to generate a 3-D image stack with a volume of a 5.3 x 105 μm3 volume of a whole kidney glomerulus (13% of glomerular volume). Secondly, Focused Ion Beam milling Scanning Electron Microscopy (FIB-SEM) was used to image a filtration region (48 μm3 volume). Lastly Transmission Electron Tomography (Tom-TEM) was performed on a 0.3 μm3 volume to identify the fine structure of the glycocalyx.

Results: Tom-TEM clearly showed 20 nm fibre spacing in the glycocalyx, within a limited field of view. FIB-SEM demonstrated, in a far greater field of view, how the glycocalyx structure related to fenestrations and the filtration slits, though without the resolution of TomTEM. SBF-SEM was able to determine the extent of the sub-podocyte space and glycocalyx coverage, without additional heavy metal staining. Neither SBF- nor FIB-SEM suffered the anisotropic shrinkage under the electron beam that is seen with Tom-TEM.

Conclusions: These images demonstrate that the three dimensional structure of the GFB can be imaged, and investigated from the whole glomerulus to the fine structure of the glycocalyx using three dimensional electron microscopy techniques. This should allow the identification of structural features regulating physiology, and their disruption in pathological states, aiding the understanding of kidney disease.


Figures

Figure 1
Figure 1
Structure of the glomerular filtration barrier. Transmission electron microscopy of a perfusion fixed rat glomerulus with addition of LaDy GAGa stain (section 80 nm thick). A: A montage of low magnification images depicting two glomeruli. B: A montage of higher magnification images depicting a glomerular filtration capillary (boxed in A). C: A high resolution (24,500 times magnification, boxed in B) of the five layers of the glomerular filtration barrier. There are two layers of staining (dense and sparse) present in this example of endothelial glycocalyx. A thin layer of contrast outside of the podocyte membrane is also commonly present. P = podocyte, C = capillary lumen, PUS = periphery urinary space, F = fenestration, SPS = sub-podocyte space.
Figure 2
Figure 2
Illustration of methods for SBF-SEM, FIB-SEM and Tom-TEM. A: Illustration of the imaging procedure for SBF-SEM and FIB-SEM. The scanning electron beam (centre) raster scans a specific area of the surface and backscattered (or secondary electron) micrographs are collected. For SFB-SEM (left) the sample is raised and then cut with a diamond knife, for FIB-SEM (right) a focused ion beam mills a layer from the surface before returning to the scanning mode. B: Secondary Electron and C: Backscattered Electron Micrographs from SFB-SEM. P = Podocyte, GBM = Glomerular basement membrane and C = Capillary Lumen. * Knife mark is less visible in C than B. Scale Bars = 1 μm D: Electron tomography (Tom-TEM) The electron beam passes through the sample. The sample is tilted so that images are taken at different angles without moving the detector (camera). The images at known viewing angles can then be reconstructed, for example using weighted back-projection, to produce a 3D image of the sample.
Figure 3
Figure 3
SBF-SEM contrast imaging of glomerular glycocalyx. A: Section sequence (every 7.5 μm) from raw data stack (71 μm × 71 μm × 84 μm) The LaDy GAGa stained components can be seen as dark regions adjacent to the lower contrast of a conventionally processed TEM resin block (Additional file 2: Movie S3A). B: An inverted contrast image sequence (every 40o) of a 3D surface projection of the same Image Stack as above (Additional file 2: Movie S3B). C: The 3D surface projection has been intensity thresholded to reveal the LaDy GAGa (glycocalyx) stained vessels and structures (Additional file 4: Movie S3C). Scale Bars = 20 μm in length.
Figure 4
Figure 4
Serial block face scanning electron microscopy of a human glomerulus. A: Micrographs of complete field of view, slices 15 μm apart (z) at the edge of a glomerulus (Additional file 5: Movie S4A). B Micrographs of a podocyte (P) from inset in A to illustrate the sub-podocyte space (SPS). C = Capillary lumen, PUS = periphery urinary space, IPS = inter-podocyte space, and Exit is an exit region for an SPS (Additional file 6: Movie S4B). C: The same podocyte as in B and adjacent capillaries after highlighting and reconstructing (Additional file 7: Movie S4C). D: as C: The podocyte is differently oriented, and capillaries have been removed to display the SPS (Additional file 8: Movie S4D). Purple/Pink = Capillaries. Green = Podocyte cell body. Yellow = SPS (under the main cell body). Scale bar is 10 μm in all cases.
Figure 5
Figure 5
The IPS in human glomeruli. A: Example SBF-SEM micrographs of the human glomerulus (Additional file 9: Movie S5A). B: The same micrograph as A but with capillaries (red) and urinary spaces (orange) highlighted and example podocytes (P) and white blood cell (W) labelled. The inter-podocyte space (IPS) and periphery urinary spaces (PUS) are shown (Additional file 10: Movie S5B). C: The extracted IPS as a volume at different angles. The circle is the IPS marked by the circle in B. The arrows and highlights in C-0 and C-60 point to the two connections with larger IPS. The arrow in C-0 is a substantial connection (circa 5 μm wide, though this channel is filled with podocyte cell bodies), but the connection between this IPS and the circled IPS is a narrow (<1.5 μm) neck (label: N in C-120) and is tortuous with podocyte parts occluding the channel. The other connection to the circled IPS (arrow in C-60) is highly tortuous and very narrow channel if it connects at all. See Additional file (Additional file 11: Movie S5C) for the whole image and reconstruction. Scale Bars = 10 μm.
Figure 6
Figure 6
FIB-SEM micrographs of a glomerular capillary wall. A and B: The glomerular filtration barrier using backscattered electron imaging (Additional file 12: Movie S6A). Labels: (C) capillary lumen, (IPS) interpodocyte space, (P) podocyte foot process, (GBM) glomerular basement membrane, (G) glycocalyx stained with LaDy GAGa, (F) fenestration and (S) slit diaphragm. C: A 3D surface image of the xyz stack (Scale Bar is 1 μm) (Additional file 13: Movie S6B). D: A set of stills through the glomerular filtration barrier (Approximately perpendicular to and indicated by dashed lines in 6A). i) Glycocalyx, ii) fenestrations, iii) glomerular basement membrane, iv) podocyte foot processes (Scale Bar is 500 nm).
Figure 7
Figure 7
Tomographic reconstruction of rat glomerular capillary glycocalyx using LaDy GAGa staining on a 300 nm thick section. A-D: raw transmission electron microscopy at -60o,-30o,30o and 60o respectively (Additional file 14: Movie S7A). E-H: reconstructed images of glycocalyx in cross-section 30 nm apart (Additional file 15: Movie S7B). There is the appearance of a gap between the glycocalyx (Gly) and the endothelial cell (En). Small holes can be seen throughout Gly, these are gaps between the fibres. Boxes are examples of areas used for spacing analysis. I-L: are the reconstruction viewed perpendicular to the membrane. I: is at the top of the glycocalyx, J: is 70 nm from the top, K: is 140 nm from the top and L: is within the endothelial layer (fenestrations can clearly be seen). M-O: Are stills from the 3D projection (Additional file 16: Movie S7C). A-L: scale bar is 300 nm. M-O: scale bar is 150 nm. Labels: Cap = capillary lumen, Gly = glycocalyx, Fen = Fenestration, GBM = glomerular basement membrane, SPS = subpodocyte space, Slit = Slit Diaphram (the diaphragm is discernable), Pod = Podocyte (foot process), En = endothelial cell.

References

    1. Deen WM, Lazzara MJ, Myers BD. Structural determinants of glomerular permeability. Am J Physiol Renal Physiol. 2001;281:F579–F596. - PubMed
    1. Salmon AHJ, Neal CR, Harper SJ. New aspects of glomerular filtration barrier structure and function: five layers (at least) not three. Curr Opin Nephrol Hypertens. 2009;18:197–205. - PubMed
    1. Avasthi PS, Koshy V. Glomerular endothelial glycocalyx. Contrib Nephrol. 1988;68:104–113. - PubMed
    1. Avasthi PS, Koshy V. The anionic Matrix at the rat glomerular enodothelial surface. Anat Rec. 1988;220:258–266. doi: 10.1002/ar.1092200306. - DOI - PubMed
    1. Rostgaard J, Qvortrup K. Sieve plugs in fenestrae of glomerular capillaries - site of the filtration barrier? Cells Tissues Organs. 2002;170:132–138. doi: 10.1159/000046186. - DOI - PubMed

Publication types

LinkOut - more resources