. 2014 Jan 30;156(3):440-55.
doi: 10.1016/j.cell.2013.12.039.

Lung stem cell differentiation in mice directed by endothelial cells via a BMP4-NFATc1-thrombospondin-1 axis

Affiliations

Lung stem cell differentiation in mice directed by endothelial cells via a BMP4-NFATc1-thrombospondin-1 axis

Joo-Hyeon Lee et al. Cell. .

Abstract

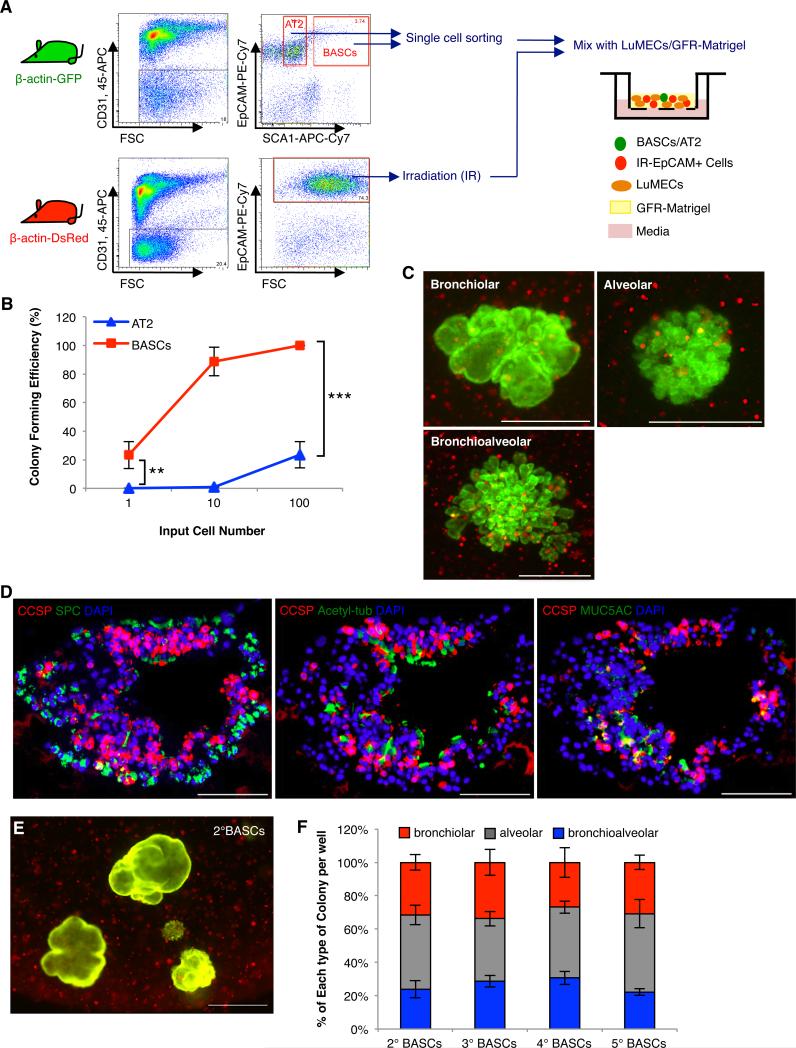
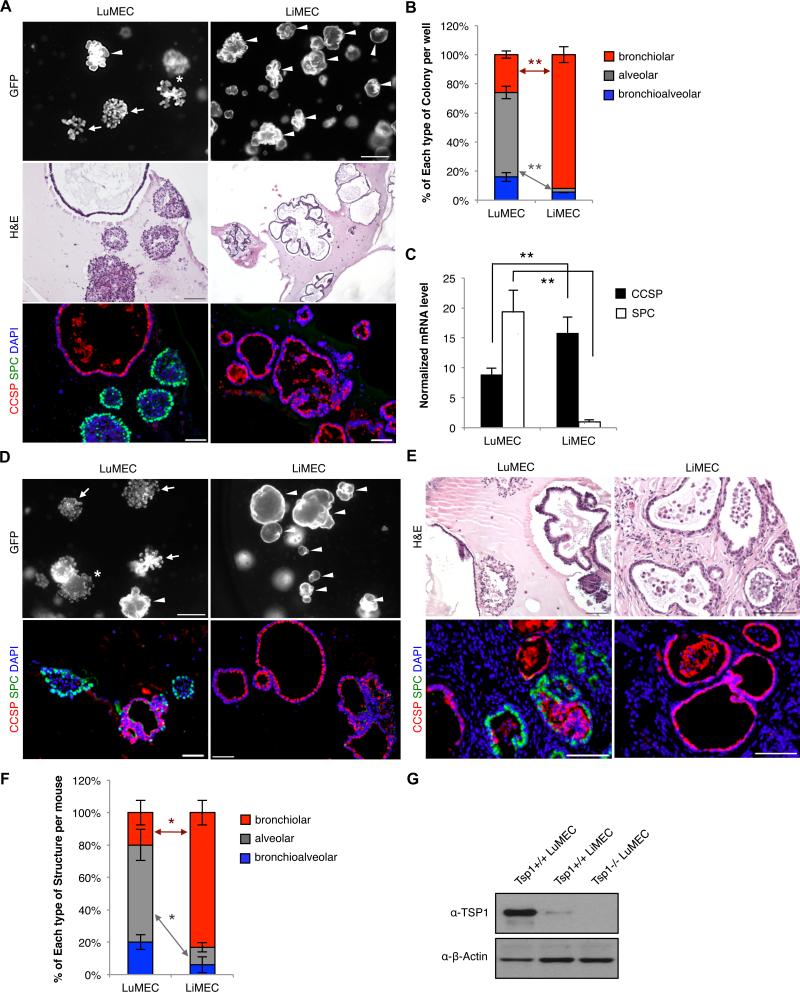
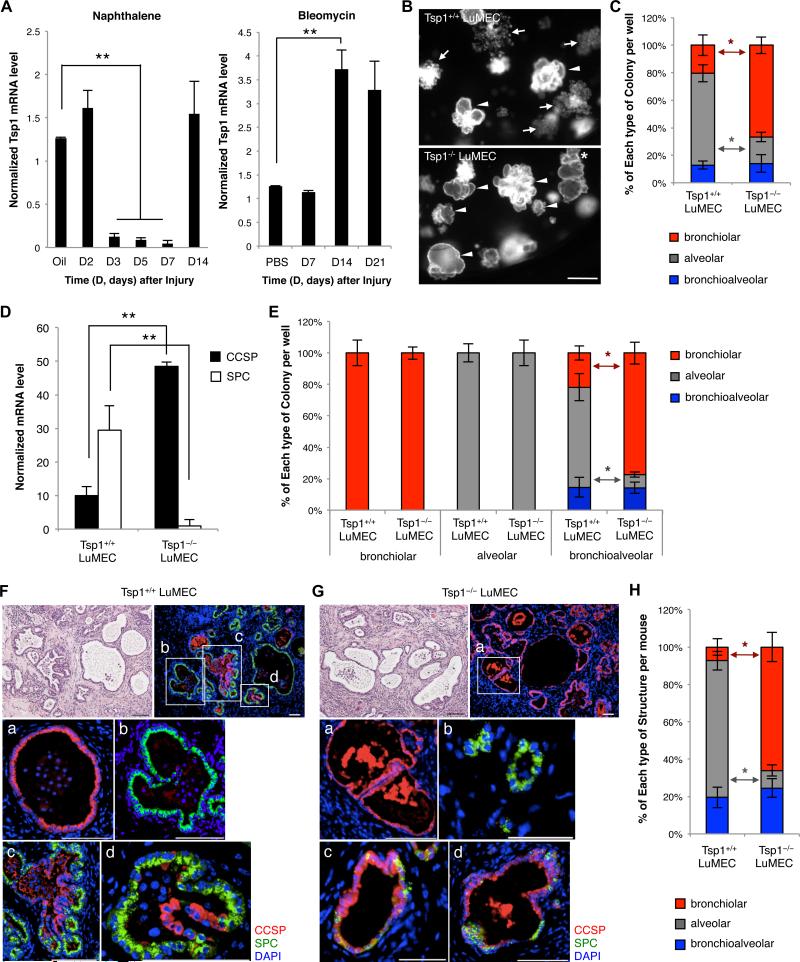
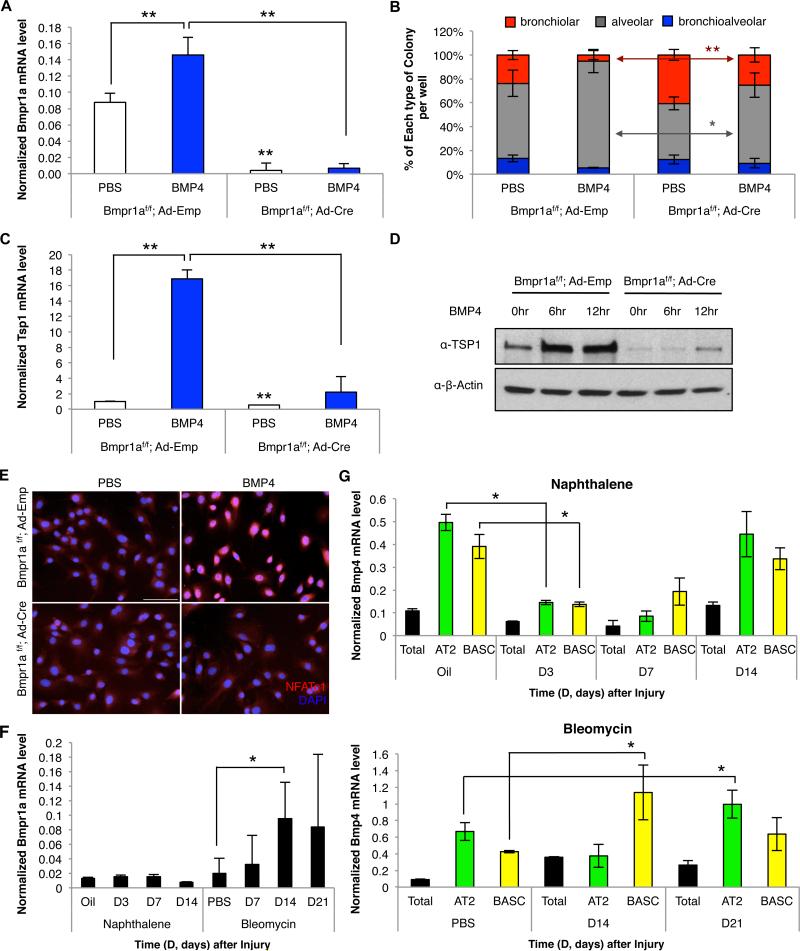
Lung stem cells are instructed to produce lineage-specific progeny through unknown factors in their microenvironment. We used clonal 3D cocultures of endothelial cells and distal lung stem cells, bronchioalveolar stem cells (BASCs), to probe the instructive mechanisms. Single BASCs had bronchiolar and alveolar differentiation potential in lung endothelial cell cocultures. Gain- and loss-of-function experiments showed that BMP4-Bmpr1a signaling triggers calcineurin/NFATc1-dependent expression of thrombospondin-1 (Tsp1) in lung endothelial cells to drive alveolar lineage-specific BASC differentiation. Tsp1 null mice exhibited defective alveolar injury repair, confirming a crucial role for the BMP4-NFATc1-TSP1 axis in lung epithelial differentiation and regeneration in vivo. Discovery of this pathway points to methods to direct the derivation of specific lung epithelial lineages from multipotent cells. These findings elucidate a pathway that may be a critical target in lung diseases and provide tools to understand the mechanisms of respiratory diseases at the single-cell level.


Figures

Figure 1
Figure 1. LuMECs support BASC self-renewal and differentiation in vitro and in vivo
(A) Schematic of FACS strategy to enrich for AT2 cells and BASCs from β-actin-GFP mice and 3D co-culture with LuMECs. CD45+ hematopoietic and CD31+ endothelial cells were excluded. EpCAM+ epithelial cells were selected. From these selections, Sca1-positive cells were BASCs and Sca1-negative cells were AT2 cells. (B) Representative images of GFP fluorescent colonies from 3D co-culture of AT2 cells (left) or BASCs (right) with LuMECs after 14 days. Arrowhead, bronchiolar colony; arrow, alveolar colony; asterisk, bronchioalveolar colony. Scale bar, 500um. (C) Self-renewal of AT2 cells and BASCs in 3D LuMEC co-cultures. Primary colonies (1°) were dissociated a nd GFP+ cells were replated for secondary (2°) and subsequent (3°, 4°, 5°, 6°) colony formati on. Colony forming efficiency: number of colonies formed/number of cells plated per well as a percentage. Data presented are the mean of three independent experiments with triplicate wells. Error bars indicate standard deviation. (D) Representative GFP images of alveolar colonies from AT2 cells (top, left) and bronchiolar, alveolar, and bronchioalveolar colonies from BASCs (top, right). H&E (middle) and IF (bottom) for CCSP (red), SPC (green), and DAPI (blue) show BASC differentiation into club (Clara) cells and AT2 cells. Scale bar, 100um. (E) Quantification of each colony type from AT2 cell (n=687) or BASC co-cultures (n=842). 25.4% of colonies were bronchiolar, 53.5% were alveolar, and 21.1% were mixed. The mean percentage of total colonies per well represented by each type of colony is shown. n=number of colonies scored. Data presented are the mean of seven independent experiments with triplicate wells. Error bars indicate standard deviation. (F) Subcutaneous co-transplantation of AT2 cells or BASCs mixed with LuMEC/Matrigel. H&E (top) and IF (bottom) for CCSP (red), SPC (green), and DAPI (blue) show that only BASCs co-injected with LuMECs formed epithelial structures with cells positive for CCSP, SPC, or both; BASCs, n=7/8 mice injected formed epithelial structures; AT2 cells, n=9/9 mice injected did not yield epithelial structures. Images are representative of three independent experiments. Scale bar, 100um. (G) Schematic of clonal serial passage analysis. 1° colonies were plated for 2° or 3° colony formation (I) and half of the cells were used for qPCR (H and J). Data shown are from 20 individual colonies per type analyzed over four independent experiments. (H) Representative qPCR analysis validating expression of SPC (white bars) and CCSP (black bars) in cells from two different individual colonies. B1, B2: primary bronchiolar colony; A1, A2: primary alveolar colony; BA1, BA2: primary bronchioalveolar colony. Normalized to Gapdh. Data presented are the mean of triplicate wells. Error bars indicate standard deviation (**, p<0.001). (I) Representative GFP images of 2° colo nies from passage of each colony type. Arrowhead, bronchiolar colony; arrow, alveolar colony; asterisk, bronchioalveolar colony. Scale bar, 500um (top); H&E (middle) and IF (bottom) analysis for CCSP (red), SPC (green), and DAPI (blue) in tissue sections from subcutaneous transplantation of cells from BASC-derived bronchiolar (left)(n=3/8 mice formed epithelial structures), alveolar (middle)(n=15/15 mice did not yield epithelial structures), or bronchioalveolar colonies (right)(n=9/9 mice generated epithelial structures). Scale, 100um. (J) Representative qPCR analysis in tertiary colonies as in H. 3°B1, 3°B2: tertiary bronchiolar colony; 3°A1, 3°A2: tertiary alveolar colony; 3°BA1, 3°BA2: tertiary bronchioalveolar colony. N ormalized to Gapdh. Data presented are the mean of triplicate wells. Error bars indicate standard deviation (**, p<0.001). See also Figure S1.
Figure 2
Figure 2. Single BASCs develop multi-lineage lung organoids
(A) Schematic of “helper cell” 3D co-cultures. Single GFP+ BASCs were mixed with irradiated EpCAM+ DsRed lung epithelial cells and co-cultured with LuMECs. (B) Limiting dilution assay in helper cell 3D co-cultures. The percentage of wells with colony formation from 1, 10, or 100 GFP+ cells for each population (BASCs, red; AT2, blue) is shown. n=180, 105, and 90 wells with 1, 10 or 100 cells plated, respectively. Data presented are the mean of four independent experiments with multiplicate wells. Error bars indicate standard deviation (**, p<0.001; ***, p<0.0001). (C) Representative merged fluorescent images (GFP, DsRed) from single GFP+ BASC helper cell co-cultures. Scale bar, 500um. (D) Representative IF in a bronchioalveolar colony derived from a single BASC; CCSP (red), SPC (green), and DAPI (blue) (top); CCSP (red), Acetylated-tubulin (green), and DAPI (blue) (middle); CCSP (red), MUC5AC (green), and DAPI (blue) (bottom). Scale bar, 100um. (E) Representative merged image (GFP, DsRed) of single BASC-derived secondary colonies. Scale bar, 500um. (F) Quantification of colony types from single BASC-derived bronchioalveolar colonies (n=14 bronchioalveolar colonies tested, n=384 secondary colonies (2°BASCs) scored) or from subsequent serial passage (n=475 3°BASCs, n=465 4°BASCs, n=452 5°BASCs). n= number of colonies scored. Data presented are the mean of three independent experiments with four individual colonies. Error bars indicate standard deviation.
Figure 3
Figure 3. Organ-specific endothelial effects on BASC differentiation
(A) Representative images from BASCs co-cultured with lung endothelial cells (LuMECs) or liver endothelial cells (LiMECs). Arrowhead, bronchiolar colony; arrow, alveolar colony; asterisk, bronchioalveolar colony. Scale bar, 500um (top); H&E (middle); IF (bottom) for CCSP (red), SPC (green), and DAPI (blue). Scale bar, 100um. (B) Quantification of colony types from LuMEC or LiMEC co-cultures with; BASC/LiMEC co-cultures yielded 3.5-fold increased bronchiolar and 21.5-fold diminished alveolar colony yield per well compared to BASC/LuMEC cultures (p<0.001) (LuMECs, n=663 colonies; LiMECs, n=627). n=number of colonies scored. Data presented are the mean of five independent experiments with triplicate wells. Error bars indicate standard deviation (**, p<0.001). (C) qPCR for CCSP (black bars) and SPC (white bars) from co-cultures; 1.8-fold greater CCSP expression and 19.3-fold less SPC expression in BASC/LiMEC cultures relative to BASC/LuMEC (p<0.001). Normalized to Gapdh. Data presented are the mean of three independent experiments with triplicate wells. Error bars indicate standard deviation (**, p<0.001). (D) Representative results from BASC/LuMEC bronchioalveolar colonies passaged for co-culture with LuMECs or LiMECs. GFP fluorescent images (top) and IF analysis (bottom) for CCSP (red), SPC (green), and DAPI (blue). Arrowhead, bronchiolar colony; arrow, alveolar colony; asterisk, bronchioalveolar colony. Scale bar, 500um in top, 100um in bottom. (E) H&E (top) and IF (bottom) analysis for CCSP (red), SPC (green), and DAPI (blue) in tissue sections from subcutaneous co-injection of cells from BASC/LuMEC bronchioalveolar colonies co-transplanted with LuMECs or LiMECs. Scale bar, 100um. (F) Quantitative analysis of epithelial structures from (E). Data presented are the mean of two independent experiments with two individual mice wells. Error bars indicate standard deviation (*, p<0.01). (G) Immunoblotting for TSP1 in LuMECs and LiMECs. Tsp1−/−LuMECs was used for negative control. β-actin loading control. See also Figure S2.
Figure 4
Figure 4. Tsp1 deficiency in LuMECs inhibits alveolar differentiation in vitro and in vivo
(A) qPCR for Tsp1 in LuMECs isolated at time points (D, days) after naphthalene (left) or bleomycin (right) injury. Corn oil or PBS, diluent controls for naphthalene or bleomycin, respectively. Tsp1 levels were 10.1-fold less than control during naphthalene injury repair and 2.9-fold higher than control during bleomycin injury repair (p<0.001). Normalized to Gapdh. Data presented are the mean of samples from three individual mice. Error bars indicate standard deviation (**, p<0.001). (B) Representative GFP images of BASCs co-cultured with Tsp1+/+ (top) or Tsp1−/− LuMECs (bottom). Arrowhead, bronchiolar colony; arrow, alveolar colony; asterisk, bronchioalveolar colony. Scale bar, 500um. (C) Quantification of colony types from BASCs co-cultured with Tsp1+/+ or Tsp1−/− LuMECs (n=605, 753, respectively). n=number of colonies scored. Data presented are the mean of five independent experiments with triplicate wells. Error bars indicate standard deviation (*, p<0.01). (D) qPCR analysis for SPC and CCSP from colonies as in B; 4.8-fold higher levels of CCSP expression and 29.5-fold less SPC expression in BASC/Tsp1−/− LuMEC co-cultures vs BASC/Tsp1+/+ LuMECs (p<0.001). Normalized to Gapdh. Data presented are the mean of three independent experiments with triplicate wells. Error bars indicate standard deviation (**, p<0.001). (E) Quantification of colony types from passaged colonies co-cultured with Tsp1+/+ or Tsp1−/− LuMECs (Bronchiolar: n=471, Tsp1+/+; n=633, Tsp1−/−. Alveolar: n=460, Tsp1+/+; n=532, Tsp1−/−. Bronchioalveolar: n=566, Tsp1+/+; n=651, Tsp1−/−). Cells from bronchioalveolar colonies co-cultured with Tsp1−/− LuMECs produced 3.6-fold more bronchiolar colonies and 5.7-fold less alveolar colonies (p<0.01), respectively, than co-cultures with Tsp1+/+ LuMECs. n=number of colonies scored. Data presented are the mean of four independent experiments with duplicate wells of five individual colonies. Error bars indicate standard deviation (*, p<0.01) (F-G) H&E (top left) and IF analysis for CCSP (red), SPC (green), and DAPI (blue) in tissue sections from subcutaneous co-injection of bronchioalveolar colonies with Tsp1+/+ (F) or Tsp1−/− LuMECs (G). Insets (top right) show high-power view (a, bronchiolar; b, alveolar; c, d, bronchioalveolar). Scale bar, 100um. (H) Quantitative analysis of epithelial structures from (F and G). Data presented are the mean of two independent experiments with three individual mice. Error bars indicate standard deviation (*, p<0.01). See also Figure S3.
Figure 5
Figure 5. BMP4-induced, NFATc1-dependent Tsp1 expression in LuMECs is required for BASC alveolar differentiation
(A) qPCR for Bmp4 from LuMECs isolated at time points (D, days) after naphthalene (left) or bleomycin (right) injury. Normalized to Gapdh and expression in controls is set to 1 for comparison. Data presented are the mean of samples from three individual mice. Error bars indicate standard deviation (*, p<0.01). (B) Representative GFP images of BASC co-cultures treated with PBS or BMP4 (50ng/ml). BASC 3D co-cultures with Tsp1+/+ LuMEC (left), Tsp1−/− LuMEC (middle), or LiMEC (right) are shown. Arrowhead, bronchiolar colony; arrow, alveolar colony. Scale bar, 500um. (C) Quantification of colony types from BASC co-cultures treated with PBS or BMP4 with Tsp1+/+ LuMEC (n=414, PBS; n=367, BMP4), Tsp1−/− LuMEC (n=498, PBS; n=425, BMP4), or Tsp1+/+ LiMEC (n=376, PBS; n=334, BMP4). BASC/Tsp1+/+ LuMEC co-cultures with BMP4 treatment showed 1.6-fold more alveolar colonies than PBS control (p<0.01) and 3.0-fold less bronchiolar colonies than control (p<0.01). n=number of colonies scored. Data presented are the mean of three independent experiments with triplicate wells. Error bars indicate standard deviation (*, p<0.01). (D) qPCR for Tsp1 in LuMECs isolated by FACS (GFP-negative) after co-culture with BASCs in the presence of PBS control, BMP4, BMP4 plus Noggin (NOG) or BMP4 plus cyclosporin A (CsA). BMP4 treatment increased Tsp1 levels in LuMECs by 15.5-fold greater than PBS control (p<0.001). Normalized to Gapdh. Data presented are the mean of three independent experiments with triplicate wells. Error bars indicate standard deviation (*, p<0.01; **, p<0.001). (E) Immunoblotting for TSP1 in LuMECs treated as indicated. CaNFATc1, LuMEC infected with constitutively active form of NFATc1. β-actin loading control. (F) Intracellular calcium measurement. BMP4, VEGF, or ionomycin was loaded at indicated time (arrow head) followed by washing (arrow). Induced calcium mobilization was monitored by flou-4. (G) IF analysis for NFATc1 (red) and DAPI (blue) in LuMEC cultures treated as in E. Scale bar, 100um. (H) Quantification of colony types from passage of BASC/LuMEC bronchioalveolar colonies treated with PBS (n=415), BMP4 (n=385), BMP4 plus NOG (n=371), or BMP4 plus CsA (n=392) or co-cultured with CaNFATc1-LuMECs (n=388). Alveolar colony formation was 1.6-fold less in BMP4-treated cultures with NOG (p<0.01) and 1.4-fold less with CsA (p<0.01). Bronchiolar colony formation with BMP4 was increased 7.8-fold ( p<0.001) with NOG and 5.6-fold greater after CsA ( p<0.01). BASC/ CaNFATc1-LuMEC co-cultures formed 1.5-fold more alveolar colonies (p<0.01) and 3.5-fold less bronchiolar colonies (p<0.001) compared to BASC/LuMEC. n=number of colonies scored. Data presented are the mean of three independent experiments with five individual colonies. Error bars indicate standard deviation (*, p<0.01; **, p<0.001). (I) qPCR using Tsp1 promoter primers and DNA purified from NFATc1-ChIP in LuMECs after treatments indicated for 30min. NFATc1 ChIP in LuMECs with BMP4 addition showed 8-fold greater Tsp1 enrichment than IgG control and 30.8-fold greater than PBS control, p<0.001. The enrichment relative to Gapdh is shown. Data presented are the mean of three independent experiments with triplicate wells. Error bars indicate standard error of mean (**, p<0.001). See also Figure S4.
Figure 6
Figure 6. Bmpr1a is required for BASC alveolar differentiation
(A) qPCR for Bmpr1a in Bmpr1af/f; Ad-Emp (Ad-Emp) or Bmpr1af/f; Ad-Cre (Ad-Cre) LuMECs isolated from co-culture with BASCs with (blue bars) or without BMP4 (white bars). Normalized to Gapdh. Data presented are the mean of three independent experiments with triplicate wells. Error bars indicate standard deviation (**, p<0.001). (B) Quantification of colony types from BASC co-cultures treated with PBS or BMP4 with Ad-Emp LuMECs (n=423, PBS; n=388, BMP4) or Ad-Cre LuMECs (n=456, PBS; n=441, BMP4). After BMP4 treatment, whereas BASC/Ad-Emp LuMEC generated 3.8-fold less bronchiolar colonies (p<0.001) and 1.4-fold more alveolar colonies (p<0.01) compared to PBS controls, BASC/Ad-Cre LuMEC produced bronchiolar and alveolar colonies comparable to PBS controls. n=number of colonies scored. Data presented are the mean of three independent experiments with triplicate wells. Error bars indicate standard deviation (*, p<0.01; **, p<0.001). (C) qPCR for Tsp1 as in A. (D) Immunoblotting for TSP1 in Bmpr1af/f; Ad-Emp or Bmpr1af/f; Ad-Cre LuMECs at indicated time points after BMP4 treatment. β-actin loading control. (E) IF analysis for NFATc1 (red) and DAPI (blue) in Ad-Emp or Ad-Cre LuMEC cultures treated with PBS or BMP4. Scale bar, 100um. (F-G) qPCR for Bmpr1a (black bars) from LuMECs (F) or Bmp4 from AT2 cells (green bars), BASCs (yellow bars) or total live lung cells (black bars) (G) isolated at indicated time points after naphthalene (G, top) or bleomycin (G, bottom). Normalized to Gapdh. Data presented are the mean of samples from three independent mice. Error bars indicate standard deviation (*, p<0.01). See also Figure S5.
Figure 7
Figure 7. Accelerated bronchiolar injury repair and impaired alveolar injury repair in Tsp1-null mice
(A) Representative images showing club cell injury or repair determined by IF for CCSP (red), SPC (purple), and DAPI (blue) in lung tissue sections from Tsp1+/+ and Tsp1−/− mice at 2 days (top) or 5 days (bottom) after naphthalene. (B-C) Quantification of naphthalene injury repair in Tsp1+/+ (black bars) and Tsp1−/− (red bars) lungs. (B) For club cells, the percentage of DAPI-positive, CCSP-positive bronchiolar cells was assessed at indicated time points (*, p<0.01; **, p<0.001). (C) The numbers of CCSP-positive, SPC-positive BASCs in terminal bronchioles (TBs) were counted at indicated time points (+, p<0.05). (D) Representative IF analysis for SPC (red), BrdU (green), and DAPI (blue) in fibrotic lung regions from Tsp1+/+ or Tsp1−/− mice 21 days post intratracheal bleomycin injection. (E-F) Quantification of bleomycin injury repair. (E) The percentage of DAPI-positive, SPC-positive cells 21 days after bleomycin is shown (*, p<0.01). (F) The area of lung with fibrotic regions at each time point shown was calculated as the percentage of total lung area with fibrosis (*, p<0.01). (G) Representative IF analysis for CCSP (red), SPC (green), and DAPI (blue) in terminal bronchioles 21 days after bleomycin showing BASCs (arrowheads) in Tsp1+/+ (left) and Tsp1−/− mice (right). (H) Quantification of BASCs as in C during bleomycin injury repair in Tsp1+/+ (black bars) and Tsp1−/− mice (red bars). TBs, terminal bronchioles. Scale, 100um. Data presented are the mean of three individual mice. Error bars indicate standard deviation (*, p<0.01). Scale bar, 100um. See also Figure S6.

References

    1. Adams JC, Lawler J. The thrombospondins. Int J Biochem Cell Biol. 2004;36:961–968. - PMC - PubMed
    1. Aso Y, Yoneda K, Kikkawa Y. Morphologic and biochemical study of pulmonary changes induced by bleomycin in mice. Lab Invest. 1976;35:558–568. - PubMed
    1. Baenziger NL, Brodie GN, Majerus PW. A thrombin-sensitive protein of human platelet membranes. Proc Natl Acad Sci U S A. 1971;68:240–243. - PMC - PubMed
    1. Barkauskas CE, Cronce MJ, Rackley CR, Bowie EJ, Keene DR, Stripp BR, Randell SH, Noble PW, Hogan BL. Type 2 alveolar cells are stem cells in adult lung. J Clin Invest. 2013;123:3025–3036. - PMC - PubMed
    1. Chapman HA, Li X, Alexander JP, Brumwell A, Lorizio W, Tan K, Sonnenberg A, Wei Y, Vu TH. Integrin alpha6beta4 identifies an adult distal lung epithelial population with regenerative potential in mice. J Clin Invest. 2011;121:2855–2862. - PMC - PubMed

Publication types

Substances