. 2014 Jan 30;156(3):590-602.
doi: 10.1016/j.cell.2013.12.041.

Sensitizing protective tumor microenvironments to antibody-mediated therapy

Affiliations

Sensitizing protective tumor microenvironments to antibody-mediated therapy

Christian P Pallasch et al. Cell. .

Abstract

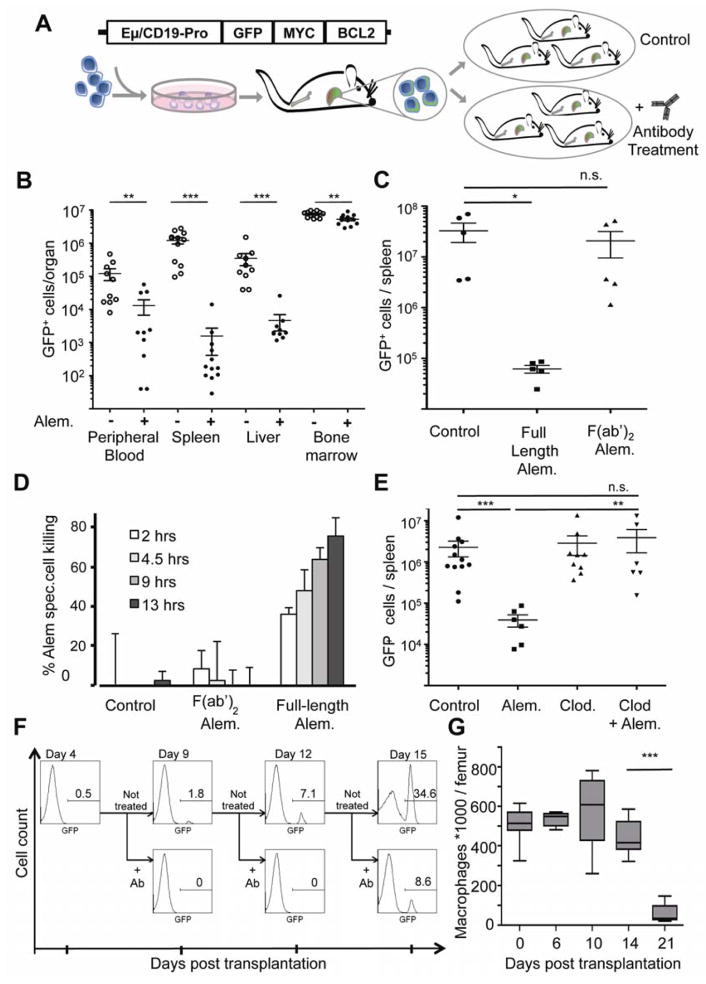
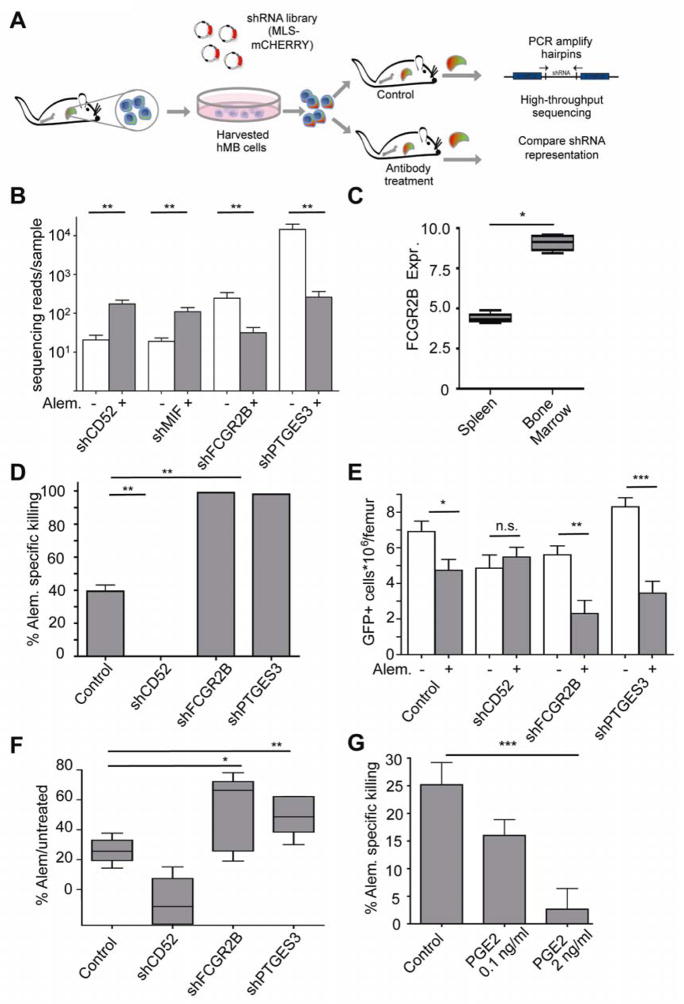
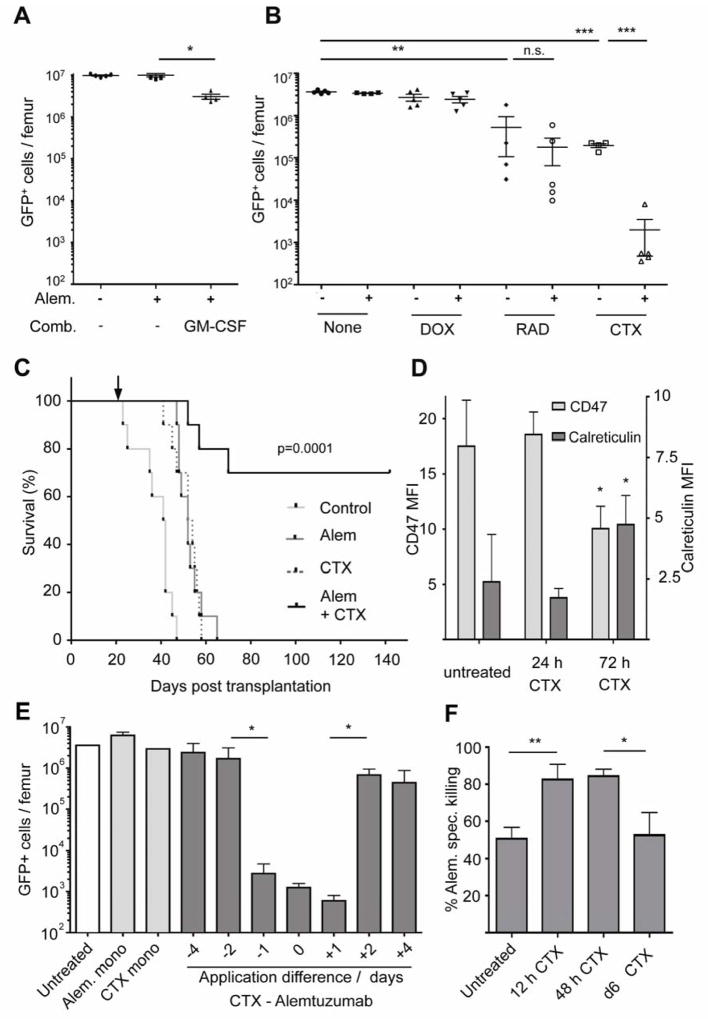
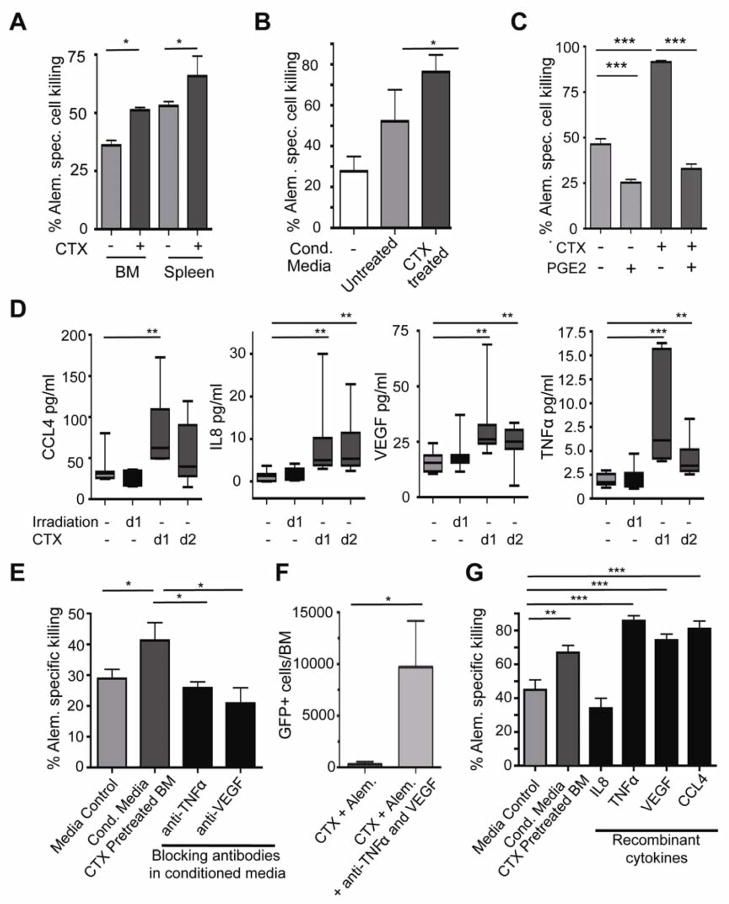
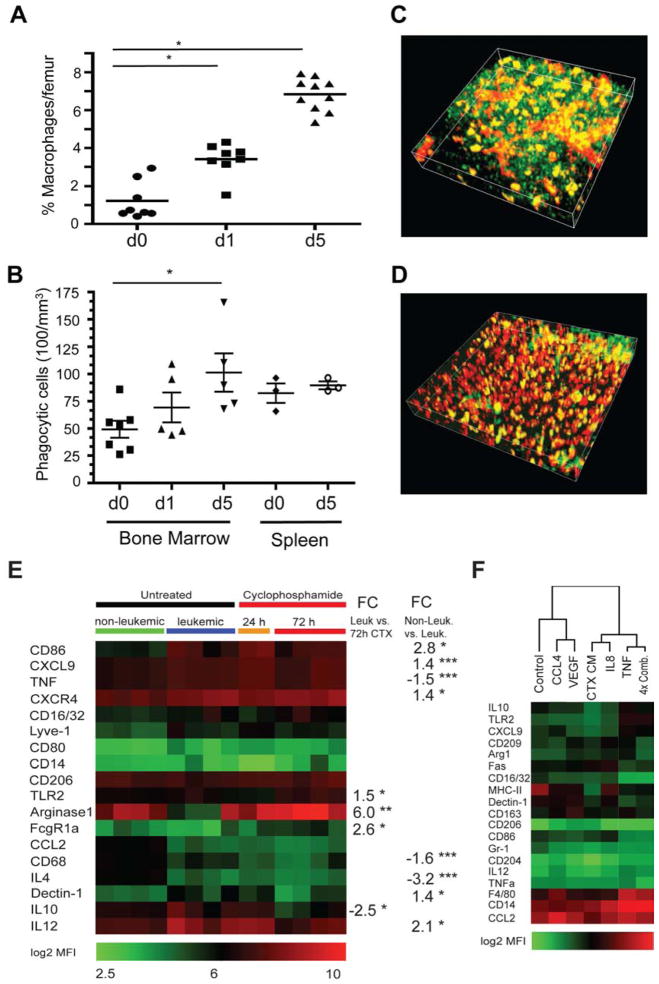
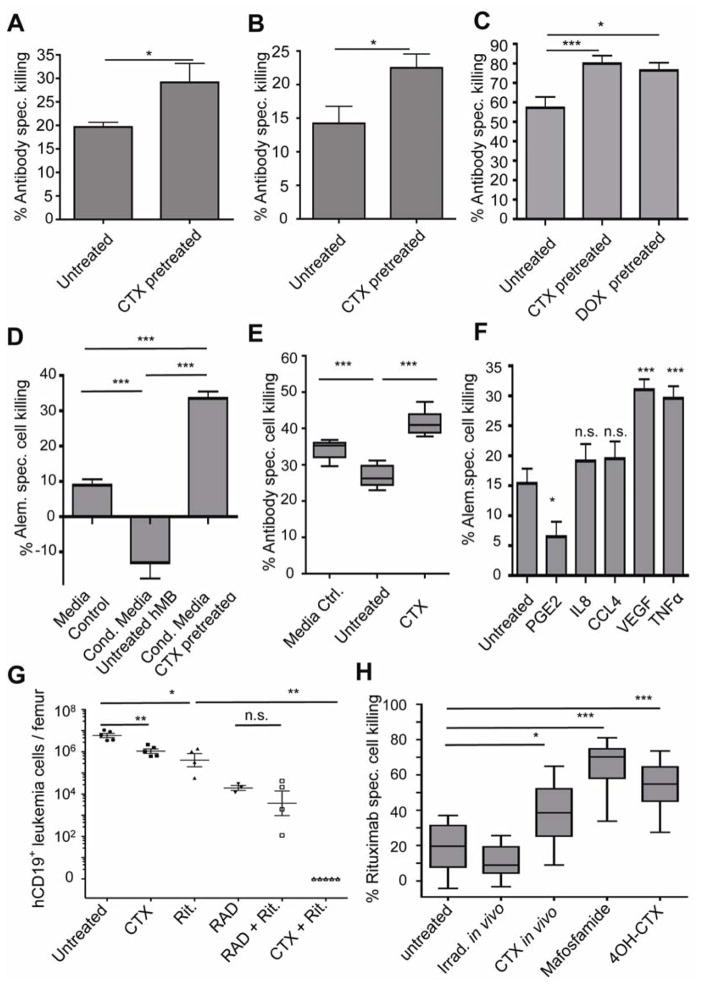
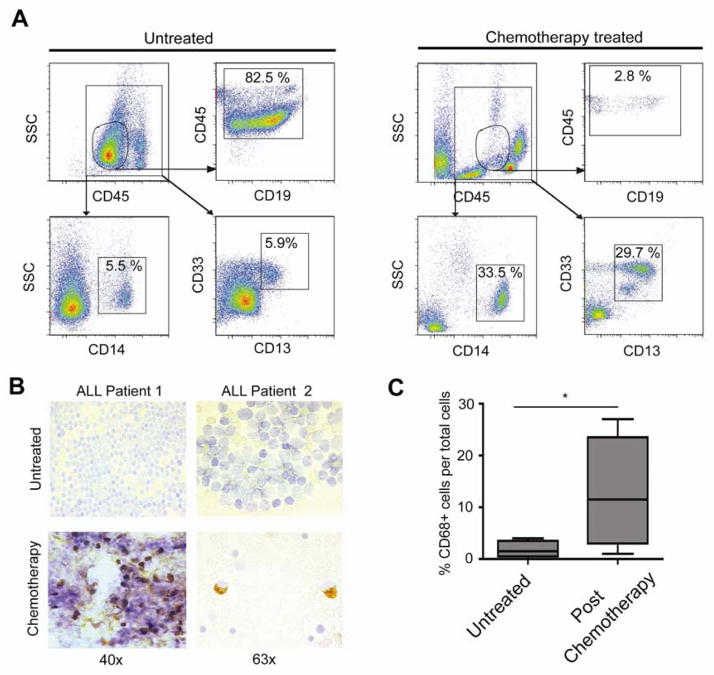
Therapy-resistant microenvironments represent a major barrier toward effective elimination of disseminated malignancies. Here, we show that select microenvironments can underlie resistance to antibody-based therapy. Using a humanized model of treatment refractory B cell leukemia, we find that infiltration of leukemia cells into the bone marrow rewires the tumor microenvironment to inhibit engulfment of antibody-targeted tumor cells. Resistance to macrophage-mediated killing can be overcome by combination regimens involving therapeutic antibodies and chemotherapy. Specifically, the nitrogen mustard cyclophosphamide induces an acute secretory activating phenotype (ASAP), releasing CCL4, IL8, VEGF, and TNFα from treated tumor cells. These factors induce macrophage infiltration and phagocytic activity in the bone marrow. Thus, the acute induction of stress-related cytokines can effectively target cancer cells for removal by the innate immune system. This synergistic chemoimmunotherapeutic regimen represents a potent strategy for using conventional anticancer agents to alter the tumor microenvironment and promote the efficacy of targeted therapeutics.


Figures

Figure 1
Figure 1. The bone marrow provides a resistant niche that protects leukemia cells from antibody-directed macrophage engulfment
(A) A schematic of the humanized hMB-model of double-hit lymphoma. Cord-blood-derived HSCs are infected with a B-cell directed BCL2/MYC overexpressing construct. Primary leukemias are transplanted to secondary recipient mice for further treatment studies. (B) A graph showing the relative tumor burden in distinct organs 8 days after initiating alemtuzumab treatment. Each symbol represents one mouse. For bone marrow, the total number of tumor cells in both femurs and tibias was counted. (C) A graph comparing the anti-tumor effect of the full-length and the F(ab′)2 fragment of alemtuzumab in NSG mice after 7 days of treatment. Each symbol represents one mouse. (D) A graph showing the relative macrophage-dependent cell death in the presence or absence of antibody. (E) A graph showing the relative tumor cell number following treatment with or without clodronate and alemtuzumab. GFP+ leukemic cells in the spleen were quantified after 7 days of treatment. (F) Histograms showing the percentage of hCD45+/ GFP+ cells in the bone marrow. Secondary hMB recipient mice were treated at the indicated times after leukemia cell transplantation, and the presence of GFP+ leukemic cells was assayed on day 9, 12 or 15, respectively. (G) A graph showing the time dependent abundance of CD11b+/GR1lo/CD11c/F4/80+ macrophages in femurs of hMB mice by flow cytometry. For all bar graphs, average and SEM are shown (* = p<0.05, ** = p<0.01, and *** = p<0.001). See also Figure S1 and Movie S1.
Figure 2
Figure 2. In vivo RNAi-screening identifies PGE2 and FCGR2B-mediated resistance to alemtuzumab
(A) Schematic of the shRNA screening approach. Primary hMB mouse derived leukemia cells were infected with an shRNA pool ex vivo and mCherry+ sorted cells were transplanted to secondary recipient mice. Prior and subsequent to treatment, leukemia cells were isolated and subjected to shRNA sequencing. (B) A bar graph showing the distribution of shRNA representation in untreated control samples (n=9) versus alemtuzumab treated mice (n=9). (C) A graph showing the relative expression of FCGR2B in spleen versus bone marrow derived leukemic cells, as determined by flow cytometry. Data is displayed as the ratio of the mean fluorescence intensity in specific stain/isotype control (n=4) (D) A bar graph showing the effects of specific shRNA-mediated knock-down on macrophages killing in vitro. The percentage of antibody-mediated killing in by macrophage ADCC was calculated from absolute counts of GFP+ cells. Percent killing = %100 −(100*(Ntreated/Nuntreated)) (n=8 per group) (E) A bar graph showing the treatment response shRNA-infected leukemias to alemtuzumab in vivo. Disease burden was assessed by flow cytometry and shown as absolute counts of leukemic cells per femur in untreated versus antibody treated mice. (F) A bar graph comparing the percentage (referring to absolute counts displayed in D) of residual disease in shRNA-infected leukemias after antibody treatment (n=6 per group). (G) A bar graph showing the effect of PGE2 on macrophage mediated ADCC of leukemia cells. For all bar graphs, average and SEM are shown (* = p<0.05, ** = p<0.01, and *** = p<0.001). See also Figure S2 and Table S1.
Figure 3
Figure 3. Combination therapy with alemtuzumab and CTX cures pre-B-ALL in the hMB model
A graph showing the number of live tumor cells in the bone marrow of mice treated with alemtuzumab alone or in combination with (A) GM-CSF (2×100ng/dose s.c. for 6 days) or (B) doxorubicin (5 mg/kg)(DOX), CTX (100 mg/kg)(CTX), or whole body irradiation (5 Gy)(RAD). Organs were harvested 8 days after treatment initiation. Each symbol represents one mouse. (C) Kaplan-Meier analysis comparing the survival of secondary hMB recipient mice receiving different anti-tumor treatments as indicated by arrow (n=10 per treatment arm). (D) A graph displaying CD47 and calreticulin expression on leukemia cells prior to CTX treatment and 24 and 72 hours post treatment post treatment. (E) A graph showing the number of surviving GFP+ cells following treatment of mice with alemtuzumab at distinct intervals relative to CTX. (F) A graph showing susceptibility to macrophage-mediated killing of hMB cells ex vivo following CTX chemotherapy. Data are shown at 12 h, 48 h and after 6 days. For all bar graphs, average and SEM are shown (* = p<0.05, ** = p<0.01, and *** = p<0.001). See also Figures S3 and S4.
Figure 4
Figure 4. CTX/alemtuzumab synergy is mediated by an acute secretory response from treated leukemia cells
(A) A bar graph showing the level of antibody-mediated cell death of bone marrow and spleen leukemia cells from hMB leukemia mice following treatment with 100 mg/kg CTX in the presence of peritoneal macrophages. (B) A bar graph showing the level of alemtuzumab-mediated ADCC one day after exposure to conditioned media from the bone marrow of CTX-treated mice or untreated controls. (C) A bar graph showing the level of alemtuzumab-mediated ADCC following the addition of 1 ng/ml PGE2 to the conditioned media from CTX or control pretreated leukemia cells. (D) Quantification of cytokine secretion from bone marrow residing leukemia cells following irradiation (5 Gy) or CTX (100 mg/kg). Lysates from whole tibia bone marrow from leukemic mice were subject to a human cytokine bioplex assay. (E) A bar graph showing the level of ADCC following prior incubation of CTX-conditioned media with the indicated cytokine-specific blocking antibodies. (F) A bar graph showing the number of surviving cells in vivo in the bone marrow following treatment with CTX and alemtuzumab plus or minus the blocking TNF and VEGF antibodies infliximab and bevacizumab. (G) A graph showing the effect of the indicated recombinant human cytokines (100 ng/ml each) on alemtuzumab-mediated ADCC. All macrophage ADCC assays were performed using 10 individual hMB cell lines. For all bar graphs, average and SEM are shown (* = p<0.05, ** = p<0.01 and *** = p<0.001). See also Table S2.
Figure 5
Figure 5. CTX increases macrophage frequency and shows time-dependent synergy with antibody therapy
(A) Flow cytometry quantification of the number of bone marrow macrophages after CTX treatment, as assessed by CD11b+/GR1lo/CD11c/F4/80+ staining. (B) A graph showing the number of phagocytic cells in the bone marrow following treatment with 100 mg/kg CTX. Phagocytic cells were quantified by automated identification of TexasRed-positive cells using IMARIS software package. (C and D) Representative three-dimensional reconstruction of (C) untreated bone marrow and (D) bone marrow 5 days post CTX treatment. Green cells indicate leukemic GFP+ cells, while phagocytic cells harboring dextran-TexasRed uptake are displayed in red (* = p<0.05). See also Figure S4. (E) A heat map showing macrophage marker expression, expressed as mean fluorescence intensities (MFIs), from control (non-leukemic) mice, untreated leukemic mice and CTX-treated leukemic mice (24h and 72h post treatment onset). Significant changes in marker expression are indicated to the right of the heat map. (F) A heat map showing marker expression in peritoneal macrophages cultivated in the presence of conditioned media generated from CTX-treated leukemia cells, recombinant CCL4, VEGF, TNFα, or IL8 or a combination of all 4 recombinant factors. Marker expression was obtained by flow cytometry and displayed as MFIs. Clustering of experimental conditions was performed using a Pearson correlation (* = p<0.05, ** = p<0.01 and *** = p<0.001).
Figure 6
Figure 6. CTX-dependent secretory responses can be elicited in independent murine tumor models, patient derived cells and independent effector cells
(A) A bar graph showing macrophage-dependent phagocytosis of in vivo CTX treated murine Arf−/−Ph+ B-ALL in the absence or presence of the 18B12 anti-CD20 antibody. (B) A bar graph showing the effect of conditioned media generated from cells derived from untreated vs. CTX treated Arf/Ph+ B-ALL-bearing mice on alemtuzumab-dependent phagocytosis of hMB cells. (C) A graph showing the effect of conditioned media generated from cells derived from untreated or DOX or CTX-treated Eμ-Myc/Arf−/− lymphoma-bearing mice on alemtuzumab-dependent phagocytosis of hMB cells. (D) A graph showing the relative level of alemtuzumab-mediated cell killing by human primary monocytes in the presence of conditioned media derived from control or CTX-treated leukemia cells. (E) A graph showing the level of alemtuzumab-mediated leukemia cell lysis, as determined by a europium-release assay, using primary human NK-cells from healthy donors. (F) A bar graph showing the level of human monocyte ADCC in the presence of PGE2, IL8, CCL4, VEGF, and TNFα. ( G) A graph showing the response of patient-derived B-ALL xenografts in NSG mice to treatment with rituximab (3×10mg/kg), total body irradiation (5Gy) CTX (2×100 mg/kg), or their respective combinations, as indicated. (H) A graph showing the level of rituximab-mediated ADCC following exposure of leukemia cells to conditioned media generated from tumor cells isolated from untreated, irradiated (5 Gy) and CTX -treated (100mg/kg) primary human patient B-ALL xenografted mice. Mafosfamide and 4-OH-CTX were used to treat cells ex vivo for 6h, and conditioned media was obtained after 24h of subsequent culture. Untreated leukemia cells served as target cells for Rituximab-mediated ADCC. For all graphs, * = p<0.05, ** = p<0.01 and *** = p<0.001.
Figure 7
Figure 7. Polychemotherapy induces macrophage infiltration in ALL patients
(A) Flow cytometry assessment of bone marrow aspirates taken from a patient at diagnosis (left panels) and undergoing CTX-containing polychemotherapy (GMALL Induction I) at d11 post treatment start (right panels). The circular CD45+/CD19+ gate shows the number of lymphocytic blasts. In the rectangular CD45+ gate, the CD14+ and CD13+/ CD33+ cells demarcate the bone marrow macrophage populations. (B) Representative immunostaining for CD68 in bone marrow smears prior therapy (upper panels) and at d11 post therapy onset (lower panel). (C) A graph showing the percentage of CD68+ macrophages per total cells in bone marrow smears from 6 ALL patients prior to therapy and at day 11 of the first treatment cycle (* = p<0.05).

Comment in

Similar articles

Cited by

References

    1. Aukema SM, Siebert R, Schuuring E, van Imhoff GW, Kluin-Nelemans HC, Boerma EJ, Kluin PM. Double-hit B-cell lymphomas. Blood. 2011;117:2319–2331. - PubMed
    1. Chao MP, Alizadeh AA, Tang C, Jan M, Weissman-Tsukamoto R, Zhao F, Park CY, Weissman IL, Majeti R. Therapeutic antibody targeting of CD47 eliminates human acute lymphoblastic leukemia. Cancer Research. 2011;71:1374–1384. - PMC - PubMed
    1. Chao MP, Alizadeh AA, Tang C, Myklebust JH, Varghese B, Gill S, Jan M, Cha AC, Chan CK, Tan BT, et al. Anti-CD47 antibody synergizes with rituximab to promote phagocytosis and eradicate non-Hodgkin lymphoma. Cell. 2010;142:699–713. - PMC - PubMed
    1. Chen Q, Zhang XH, Massague J. Macrophage binding to receptor VCAM-1 transmits survival signals in breast cancer cells that invade the lungs. Cancer Cell. 2011;20:538–549. - PMC - PubMed
    1. Clynes RA, Towers TL, Presta LG, Ravetch JV. Inhibitory Fc receptors modulate in vivo cytotoxicity against tumor targets. Nature Medicine. 2000;6:443–446. - PubMed

Publication types