. 2014 Feb 20;53(4):534-48.
doi: 10.1016/j.molcel.2013.12.026. Epub 2014 Jan 30.

Tyr phosphorylation of PDP1 toggles recruitment between ACAT1 and SIRT3 to regulate the pyruvate dehydrogenase complex

Affiliations

Tyr phosphorylation of PDP1 toggles recruitment between ACAT1 and SIRT3 to regulate the pyruvate dehydrogenase complex

Jun Fan et al. Mol Cell. .

Abstract

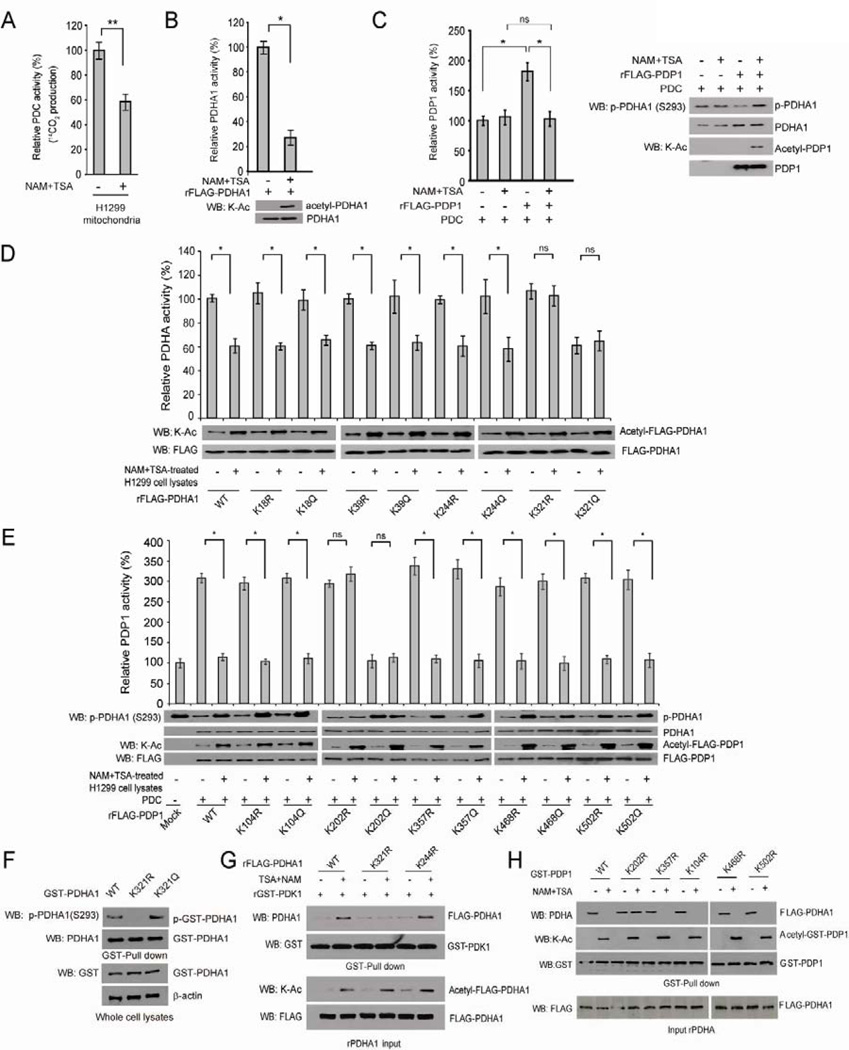
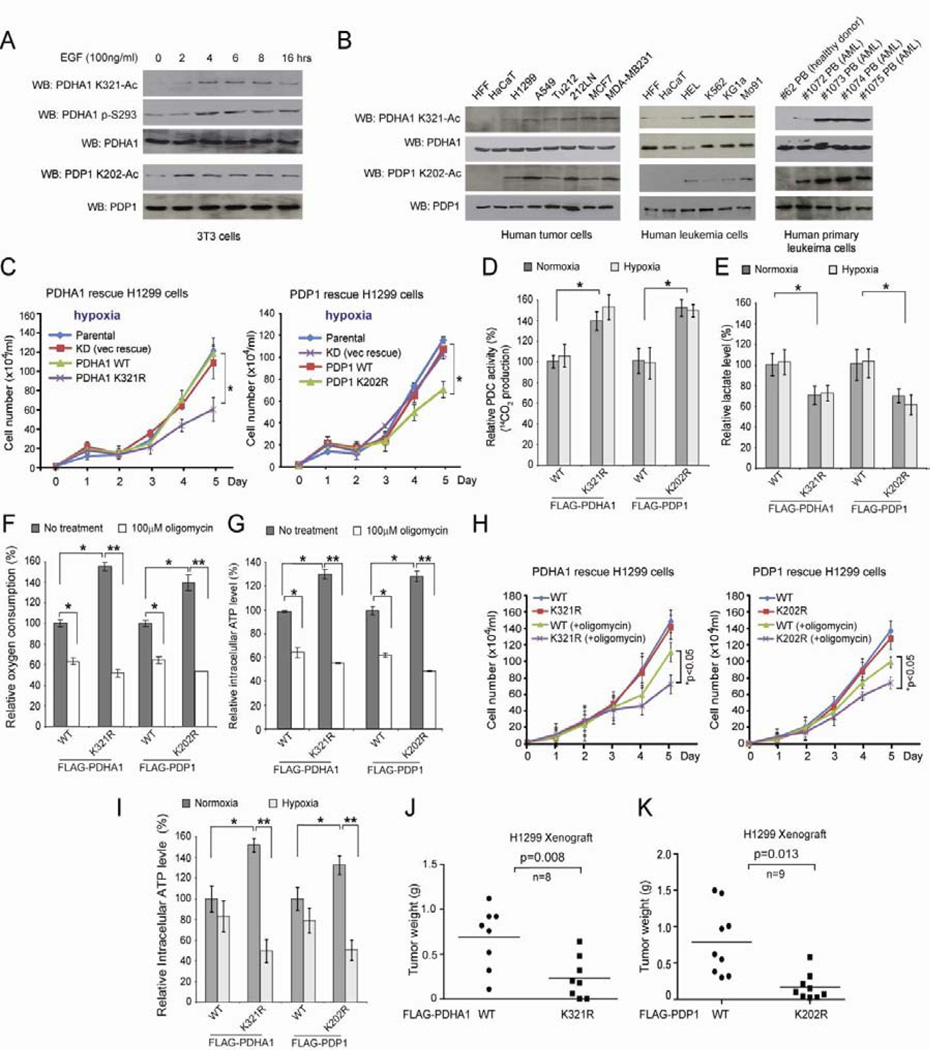
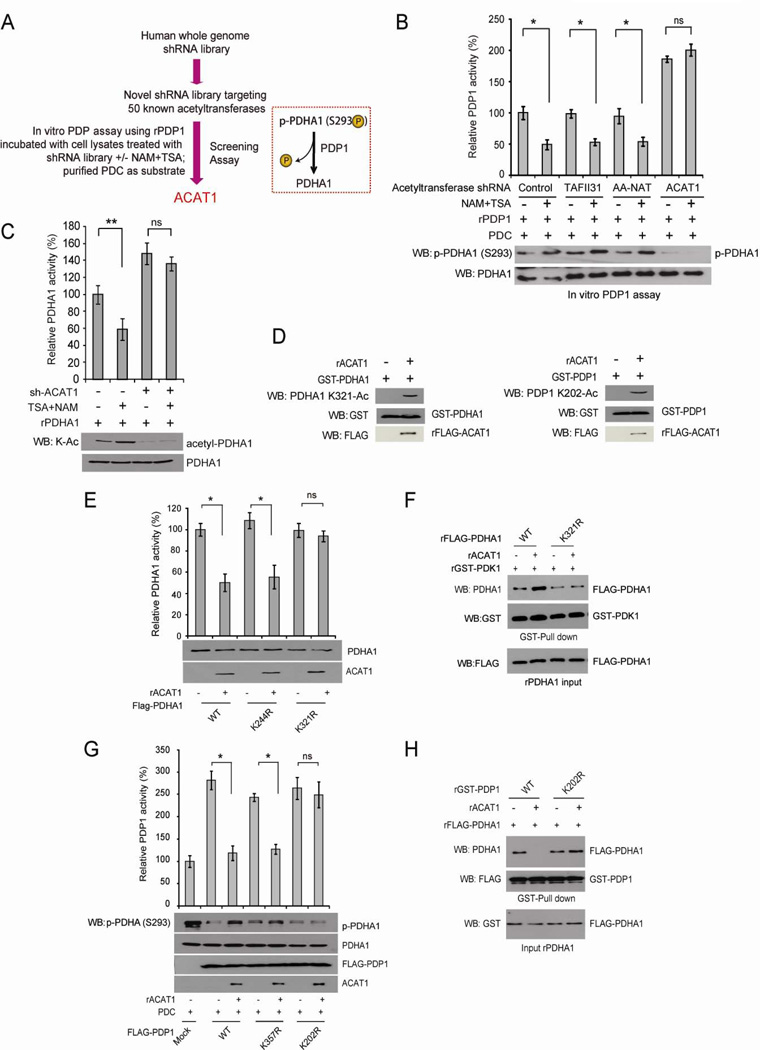
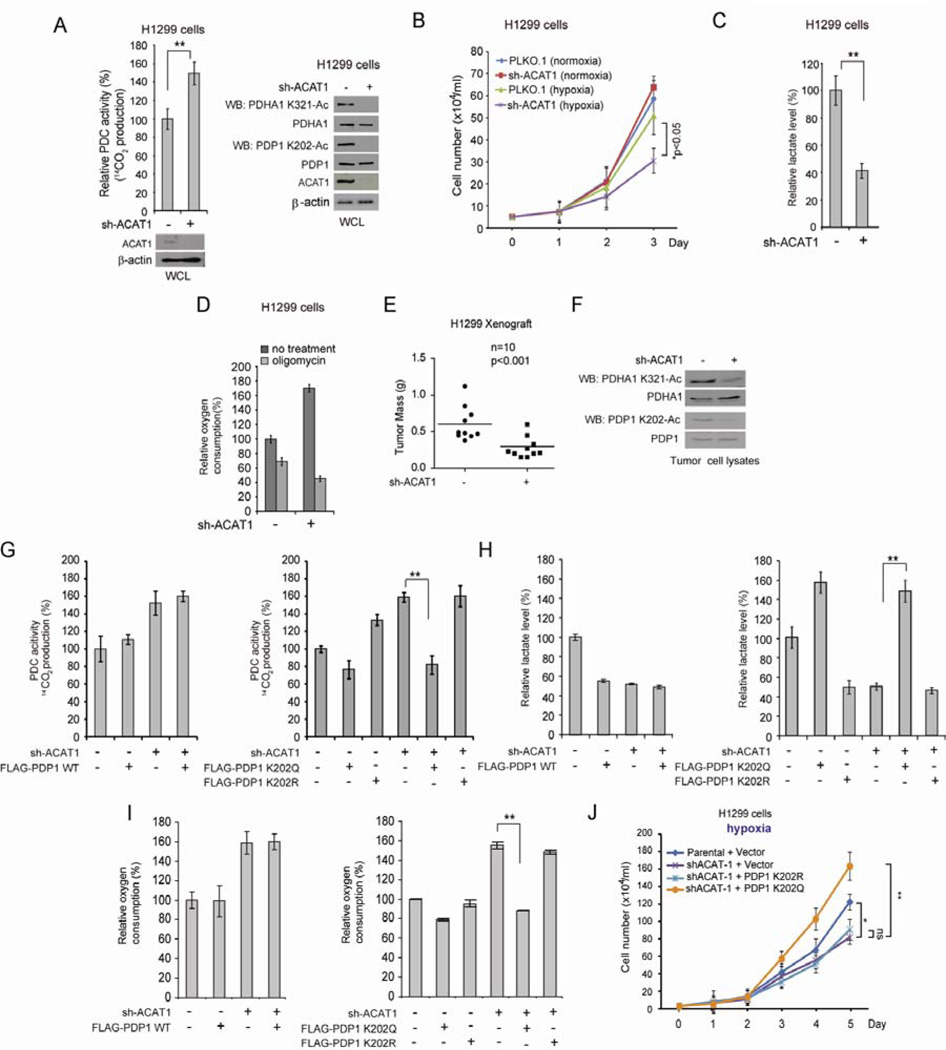
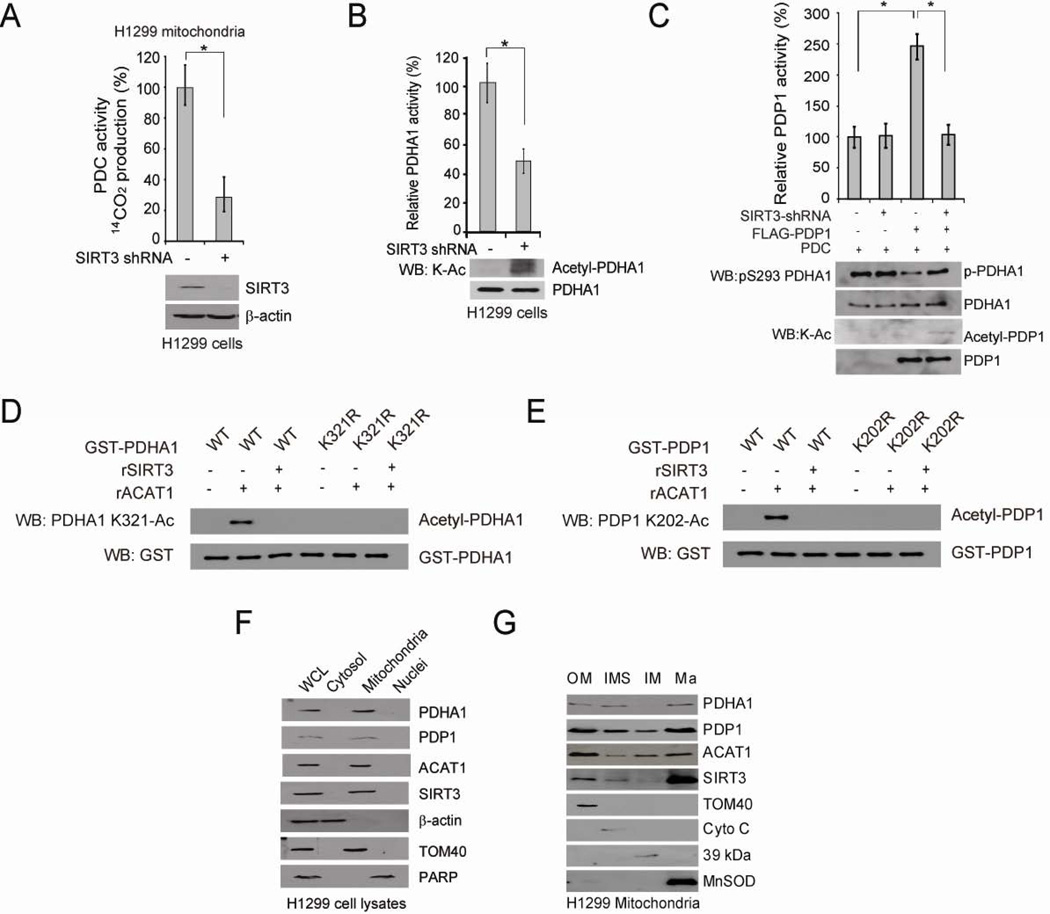
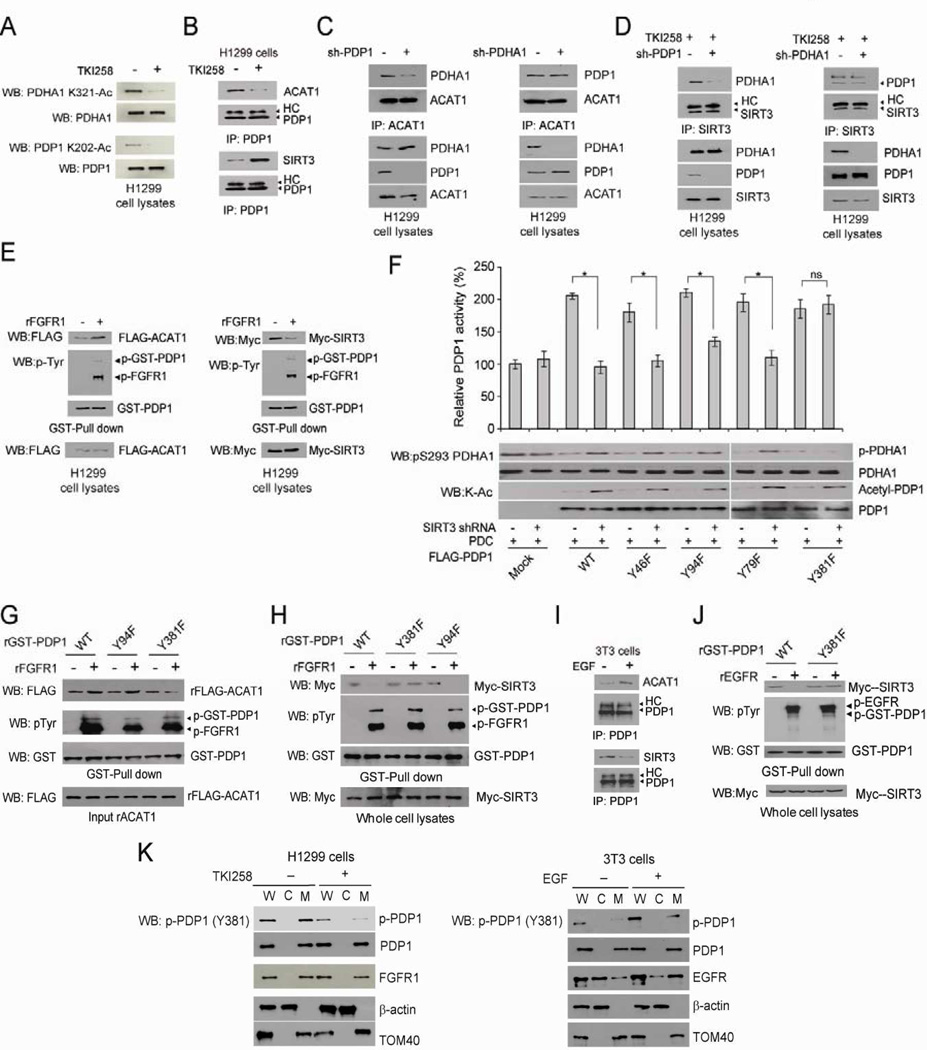
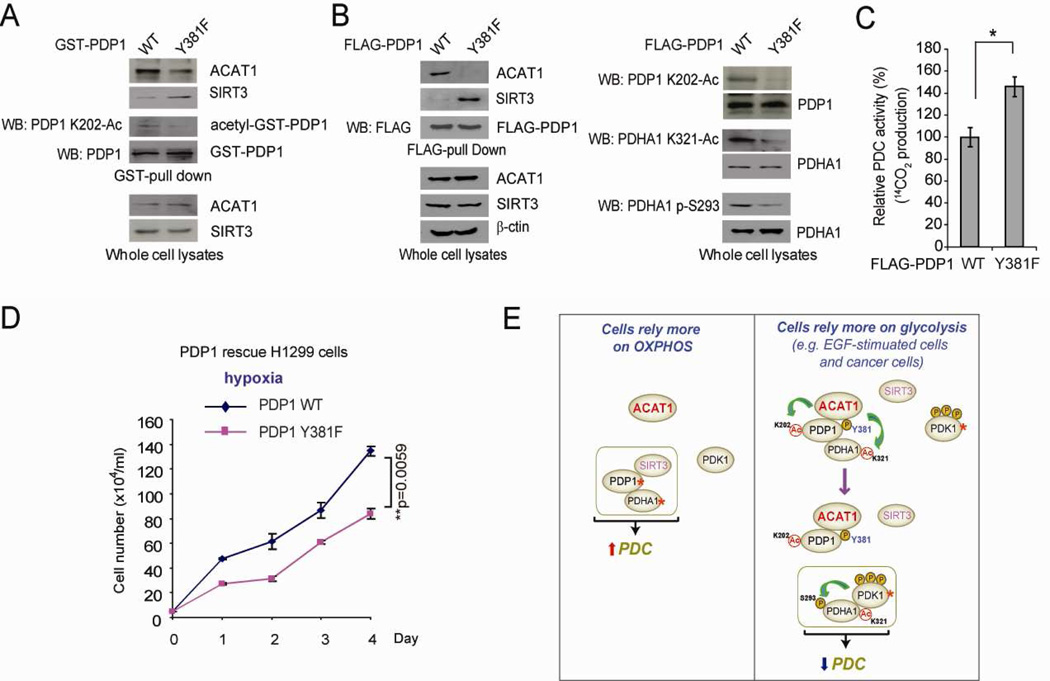
Mitochondrial pyruvate dehydrogenase complex (PDC) is crucial for glucose homeostasis in mammalian cells. The current understanding of PDC regulation involves inhibitory serine phosphorylation of pyruvate dehydrogenase (PDH) by PDH kinase (PDK), whereas dephosphorylation of PDH by PDH phosphatase (PDP) activates PDC. Here, we report that lysine acetylation of PDHA1 and PDP1 is common in epidermal growth factor (EGF)-stimulated cells and diverse human cancer cells. K321 acetylation inhibits PDHA1 by recruiting PDK1, and K202 acetylation inhibits PDP1 by dissociating its substrate PDHA1, both of which are important in promoting glycolysis in cancer cells and consequent tumor growth. Moreover, we identified mitochondrial ACAT1 and SIRT3 as the upstream acetyltransferase and deacetylase, respectively, of PDHA1 and PDP1, while knockdown of ACAT1 attenuates tumor growth. Furthermore, Y381 phosphorylation of PDP1 dissociates SIRT3 and recruits ACAT1 to PDC. Together, hierarchical, distinct posttranslational modifications act in concert to control molecular composition of PDC and contribute to the Warburg effect.


Figures

Figure 1
Figure 1. Lysine acetylation inhibits PDHA1 and PDP1
(A) PDC flux rate was measured using isolated mitochondria from H1299 cells incubated with 14C-labeled pyruvate and treated with NAM (10mM) + TSA (5µM) for 16 hours. (B) Purified recombinant FLAG-PDHA1 (rFLAG-PDHA) was incubated with lysates of NAM+TSA-treated H1299 cells, followed by in vitro PDHA1 enzyme assay and Western blot using a pan acetyl-Lys antibody (K-Ac). (C) Purified rFLAG-PDP1 was incubated with purified PDC proteins in the presence or absence NAM+TSA-treated H1299 cell lysates, followed by in vitro PDP1 assay (left). Decreased PDP1 activity was assessed by the increase in phosphor-S293 levels of PDHA1 using Western blot (right). (D–E) Purified rFLAG-PDHA1 (D) and rFLAG-PDP1 (E) variants were incubated with or without NAM+TSA-treated H1299 cell lysates, followed by in vitro PDHA1 and PDP1 assays, respectively. (F) Immunoblotting of GST-pull down samples using cell lysates from H1299 cells transiently transfected with distinct GST-PDHA1 variants. (G) Purified rFLAG-PDHA1 variants were incubated with NAM+TSA treated H1299 cell lysates, followed by incubation with purified GST-PDK1. GST-pull down was performed and bound FLAG-PDHA1 to GST-PDK1 was determined by Western blot. (H) Purified GST-PDP1 variants were incubated with NAM+TSA treated H1299 cell lysates, followed by incubation with purified FLAG-PDHA1. GST-pull down was performed and bound FLAG-PDHA1 to GST-PDP1 was determined by Western blot. The error bars represent mean values +/− SD. Also see Figure S1.
Figure 2
Figure 2. Lysine acetylation of PDHA1 and PDP1 is important to promote glycolysis as well as consequent cancer cell proliferation under hypoxia and tumor growth
(A) Immunoblotting of lysates of 3T3 cells treated with EGF stimulation for different time as indicated using specific acetyl- or phospho-PDHA1 and acetyl-PDP1 antibodies. (B) Immunoblotting to detect acetylation levels of PDHA1 K321 and PDP1 K202 in diverse human tumor (left) and leukemia (middle) cells as well as human primary leukemia cells isolated from peripheral blood (PB) samples from representative AML patients (right). Normal proliferating human foreskin fibroblasts (HFF), HaCaT keratinocyte cells and PB cells from a healthy human donor were included as controls. (C) Distinct PDHA1 (left) and PDP1 (right) rescue H1299 cells as well as parental H1299 and control knockdown (KD; empty vector rescue) cells were tested for cell proliferation rate under hypoxia. Cell proliferation was determined based on cell numbers counted daily. (D–H) Distinct PDHA1 and PDP1 WT and K→R mutant rescue H1299 cells were tested for PDC flux rate (D) and lactate production (E) under both normoxia and hypoxia, as well as oxygen consumption (F), intracellular ATP level (G) and cell proliferation rate (H) in the presence and absence of ATP synthase inhibitor oligomycin under normoxia. (I) Distinct PDHA1 and PDP1 WT and K→R mutant rescue H1299 cells were tested for intracellular ATP level under both normoxia and hypoxia. (J–K) Tumor masses in xenograft nude mice injected with PDHA1 K321R rescue cells compared to mice injected with control PDHA1 WT rescue cells (J) or mice injected with PDP1 K202R rescue cells compared to mice injected with control PDP1 WT rescue cells (K) are shown. p values were determined by a two-tailed paired Student’s t test. The error bars represent mean values +/− SD. Also see Figures S1–S2.
Figure 3
Figure 3. Identification of ACAT1 as the upstream acetyltransferase for PDHA1 and PDP1
(A) Schematic representation of a PDP1 activity assay-based screening strategy to identify the upstream acetyltransferase that mediates NAM+TSA treatment-dependent inhibition of PDP1. Purified PDP1 was incubated with cell lysates from H1299 cells that were infected with lentiviruses targeting each acetyltransferase in the presence or absence of NAM+TSA treatment, followed by PDP1 assay. (B) Purified PDP1 was incubated with cell lysates from H1299 cells that were infected with lentiviruses targeting ACAT1, or control acetyltransferases TAFII31 and AA-NAT in the presence or absence of NAM+TSA treatment, followed by PDP1 activity assay. (C) Recombinant PDHA1 was incubated with cell lysates from H1299 cells with ACAT1 knockdown treated with or without NAM+TSA, followed by PDHA1 activity assay (top) and Western blot (bottom). (D) Immunoblotting of recombinant PDHA1 (left) and PDP1 (right) treated with recombinant ACAT1 (rACAT1) using specific acetyl-PDHA1 and acetyl-PDP1 antibodies, respectively. (E–F) Purified FLAG-PDHA1 variants were incubated with recombinant ACAT1 (rACAT1), followed by in vitro PDHA1 enzyme assay (E) or incubation with purified GST-PDK1 and PDHA1/PDK1 binding assays as described in Figure 1G. (G–H) Purified FLAG-PDP1 variants were incubated with recombinant ACAT1 (rACAT1), followed by in vitro PDP1 assay (G) or incubation with purified FLAG-PDHA1 and PDP1/PDHA1 binding assay as described in Figure 1H. The error bars represent mean values +/− SD. Also see Figure S3.
Figure 4
Figure 4. ACAT1 signals through inhibition of PDC by acetylating PDHA1 and PDP1 to promote glycolysis and tumor growth
(A) H1299 cells with stable knockdown of ACAT1 by shRNA and control cells harboring an empty vector were tested for PDC flux rate (left) and Western blot (right). (B–D) ACAT1 KD cells were tested for cell proliferation rate under normoxia and hypoxia (B), lactate production (C) and oxygen consumption in the presence and absence of ATP synthase inhibitor oligomycin (D). (E) Tumor masses in xenograft nude mice injected with ACAT1 knockdown cells compared to mice injected with control vector cells are shown. p values were determined by a two-tailed paired Student’s t test. (F) Western blot results show K321 acetylation levels of PDHA1 (upper panels) and K202 acetylation levels of PDP1 (lower panels) in tumor lysates. (G–J) Stable ACAT1 knockdown cells with stable expression of FLAG-PDP1 WT (left panels), or acetyl-mimetic form K202Q or acetyl-deficient form K202R of FLAG-PDP1 (right panels) were tested for PDC flux (G), lactate production (H), oxygen consumption (I) and cell proliferation rate under hypoxia (J). The error bars represent mean values +/− SD. Also see Figures S3–S4.
Figure 5
Figure 5. Mitochondrial SIRT3 is the upstream deacetylase of PDHA1 and PDP1
(A) Control vector and stable SIRT3 knockdown cells were tested for PDC flux (upper). SIRT3 protein level was detected by Western blot (lower). (B–C) Purified PDHA1 (B) and PDP1 (C) were incubated with cell lysates from H1299 cells with stable knockdown of SIRT3 or an empty vector, followed by PDHA1 and PDP1 activity assays (upper panels) and Western blot (lower panels). (D–E) Purified PDHA1 WT and K321R mutant (D) or PDP1 WT and K202R mutant (E) were treated with rACAT1, followed by incubation with recombinant SIRT3 and Western blot. (F) Western blot results show co-localization of PDHA1, PDP1, ACAT1 and SIRT3 in mitochondria of H1299 cells. Cytosolic β-actin, mitochondrial TOM 40 and nuclear PARP were included as control markers. (G) Western blot results show co-localization of PDHA1, PDP1, ACAT1 and SIRT3 in the outer membrane (Om), inter-membrane space (IMS) and matrix (Ma) of mitochondria in H1299 cells. TOM40, Cyto C, complex I 39-kDa protein, and MnSOD are markers for Om, IMS, inner membrane (Im), and Ma, respectively. The error bars represent mean values +/− SD. Also see Figure S5.
Figure 6
Figure 6. Y381 phosphorylation of PDP1 recruits ACAT1 but dissociates SIRT3 to acetylate PDP1 and PDHA1
(A) Cell lysates from H1299 cells treated with or without FGFR1 inhibitor TKI258 (1µM) for 4 hours were applied to Western blot to detect acetylation of PDHA1 K202 (upper) and PDP1 K321 (lower). (B) Endogenous PDP1 was immunoprecipitated from H1299 cells treated with or without FGFR1 inhibitor TKI258. Co-immunoprecipitated endogenous ACAT1 (upper) and SIRT3 (lower) were detected using Western blot. HC: heavy chain. (C–D) Endogenous ACAT1 (C) or SIRT3 (D) were immunoprecipitated from H1299 cells with stable knockdown of PDP1 (left panels) or PDHA1 (right panels), and co-immunoprecipitated endogenous PDHA1 or PDP1 were detected using Western blot, respectively. SIRT3 was immunoprecipitated from TKI258-treated cells. (E) Purified GST-PDP1 was incubated with recombinant FGFR1 (rFGFR1), followed by incubation with cell lysates from H1299 cells transiently transfected with FLAG-ACAT1 (left) or Myc-SIRT3 (right). GST-pull-down was performed and FLAG-ACAT1 (left) or Myc-SIRT3 (right) bound to GST-PDP1 were detected by Western blot. (F) Purified FLAG-PDP1 variants were incubated with purified PDC proteins in the presence or absence of cell lysates from SIRT3 KD cells, followed by in vitro PDP1 assay. (G) Purified GST-PDP1 WT, Y94F or Y381F were incubated with rFGFR1, followed by incubation with recombinant FLAG-ACAT1. GST-pull-down was performed and FLAG-ACAT1 bound to GST-PDP1 were detected by Western blot. (H) Purified GST-PDP1 variants were incubated with rFGFR1, followed by incubation with cell lysates from H1299 cells transiently transfected with Myc-SIRT3. GST-pull-down was performed and Myc-SIRT3 bound to GST-PDP1 were detected by Western blot. (I) 3T3 cells were treated with EGF (100ng/ml) for 4 hours. Endogenous PDP1 was immunoprecipitated and co-immunoprecipitated endogenous ACAT1 (upper) and SIRT3 (lower) were detected using Western blot. HC: heavy chain. (J) GST-PDP1 variants were incubated with rEGFR, followed by incubation with lysates from H1299 cells expressing Myc-SIRT3. GST-pull-down was performed to detect Myc-SIRT3/GST-PDP1 association. (K) Immunoblots of FGFR1 (left) or EGFR (right), PDP1 and phospho-PDP1 (Y381) in whole cell lysates (W), cytosolic fraction (C) and mitochondrial fraction (M) of H1299 cells treated with FGFR1 inhibitor TKI258 (left) or 3T3 cells stimulated with EGF (right), respectively.. Cytosolic β-actin and mitochondrial TOM40 were included as controls. The error bars represent mean values +/− SD. Also see Figure S6.
Figure 7
Figure 7. Y381 phosphorylation of PDP1 is important for lysine acetylation of PDP1 and PDHA1 and contributes to the enhanced glycolysis in cancer cells
(A) GST-PDP1 WT and Y381F were expressed in H1299 cells by transient transfection. GST-pull-down was performed, followed by Western blot to detect endogenous ACAT1 and SIRT3 bound to GST-PDP1 as well as K202 acetylation level of GST-PDP1 protein. (B) Left: FLAG-PDP1 WT and Y381F were pulled down from rescue cells and applied to Western blot for detection of endogenous ACAT1 and SIRT3 bound to FLAG-PDP1 variants. Right: Western blot was performed to detect K202 acetylation level of FLAG-PDP1 and K321 acetylation and S293 phosphorylation levels of endogenous PDHA1. (C–D) PDP1 Y381 rescue cells and control WT cells were tested for PDC flux rate (C) and cell proliferation rate under hypoxia (D). (E) Proposed model shows that Y381 phosphorylation of PDP1 toggles recruitment of ACAT1 and PDP1 to regulate lysine acetylation status of PDHA1 and PDP1, which contributes to phosphorylation-dependent regulation of PDHA1 and subsequent PDC activity (active enzymes are marked by asterisks). The error bars represent mean values +/− SD. Also see Figure S7.

References

    1. Balasse EO, Fery F. Ketone body production and disposal: effects of fasting, diabetes, and exercise. Diabetes Metab Rev. 1989;5:247–270. - PubMed
    1. Bell EL, Emerling BM, Ricoult SJ, Guarente L. SirT3 suppresses hypoxia inducible factor 1alpha and tumor growth by inhibiting mitochondrial ROS production. Oncogene. 2011;30:2986–2996. - PMC - PubMed
    1. Boerner JL, Demory ML, Silva C, Parsons SJ. Phosphorylation of Y845 on the epidermal growth factor receptor mediates binding to the mitochondrial protein cytochrome c oxidase subunit II. Molecular and cellular biology. 2004;24:7059–7071. - PMC - PubMed
    1. Cairns RA, Harris IS, Mak TW. Regulation of cancer cell metabolism. Nature reviews. Cancer. 2011;11:85–95. - PubMed
    1. Choudhary C, Kumar C, Gnad F, Nielsen ML, Rehman M, Walther TC, Olsen JV, Mann M. Lysine acetylation targets protein complexes and co-regulates major cellular functions. Science. 2009;325:834–840. - PubMed

Publication types

MeSH terms